


1. Introduction
The financial growth of G10 nations has shown a notable increase in recent years. However, these countries face challenges in balancing innovation with their economic strategies, despite its critical role in driving global productivity and long-term economic growth [1]. In this context, the research questions of the underlying research are:
• What is the trend of the innovation index across G10 nations from 2011 to 2020?
• What is the association between financial determinants and innovation index in G10 nations?
• How are G10 nations’ innovation indices influenced by economic factors?
The innovation index is necessary for these economies as G10 nations are already developed, so a rise in innovation stimulates technological innovation, contributing to the economic development of the economy [2]. This is because it causes a hike in productivity in generating output in the nation as it enhances the economic value of goods and services. It also ensures an improvement in the advancements in the economy by improving the quality of life, thereby stimulating the economic development of the nation in the long run.
The research aim of the study is to explore the impact of financial determinants on the GII in G10 economies. It incorporates a detailed literature review based on past studies, along with a research methodology. The research incorporates a quantitative analysis using the panel data across G10 nations from 2011 to 2020. The analysis is conducted by the Stata incorporating descriptive statistics, the correlation matrix, the OLS regression model, the Hausman test, the RE model, and the FE model. Additionally, the study provides a discussion of the findings and their policy implications.
The research is crucial as it contributes to the existing literature by examining the influence of financial determinants on the innovation index across G10 economies. Though past studies have investigated the association between financial components and innovation. This research uses multiple factors like portfolio investment, capitalization, etc, thereby filling the research gap.
2. Literature Review
2.1. Introduction
This section includes a detailed analysis of the past studies of literature with similar research objectives. It includes definitions of key terms, theoretical framework, past literature analysis, along with the research gap.
2.2. Definition of key terms
Innovation plays a crucial role in an economy. According to the report published by WIPO, the Global Innovation Index (GII) determines the level of innovation in a nation against a background of steady but slow economic growth, which also highlights the productivity of the economy [2]. The GII assesses factors such as education, knowledge, infrastructure, and the political environment. Additionally, financial determinants impact the financial performance of the economy, thereby determining financial development [3]. It can determine the level of investment decisions since it includes distinct factors such as market capitalization, interest rates, and so on.
2.3. Theoretical Framework
The role of financial determinants in fostering innovation is supported by existing theoretical frameworks. William Siber proposed a theoretical framework of financial innovation in 1957, emphasizing that new financial instruments or practices alleviate constraints faced by financial institutions [4]. This theory suggests that an increase in financial determinants, such as portfolio investments and foreign direct investment (FDI), can stimulate technological progress. By reducing financial constraints and enhancing resource allocation, these factors contribute to innovation and, subsequently, long-term economic growth.
2.4. Effect of financial determinants on innovation index
Previous studies have highlighted the relationship between financial factors and innovation. One study explored the effect of finance and FDI on technological innovation by analyzing the data of 69 nations from 2000 to 2014 with the help of a panel data analysis [5]. The results depicted a positive correlation, with finance and FDI promoting technological growth by enhancing investment, cash flow, and profitability. This, in turn, drives innovation and economic development. Another research investigates the impact of financial factors on innovation projects using a bivariate probit model for the economy of Spain from 2010 to 2015 [6]. The results of the analysis indicated that financial constraints significantly increase the likelihood of abandoning innovation projects, as such constraints heighten reliance on external financial resources. Projects yielding unfavorable economic returns were found to negatively affect innovation. These studies have been considered by the current research for their similar objectives and methodological insights.
2.5. Impact of economic indicators on innovation index-
Apart from financial indicators, economic indicators also help to determine the innovation index of a country. The research explored the association between economic indicators and innovation in EU nations with the help of a systematic integrated approach [7]. The analysis highlighted that an addition in economic parameters of the EU such as industrial growth hampers innovation in an economy. This is because of the rise in efficiency of the allocation of resources, along with the effectiveness in socio-economic outcomes, which added to innovation in the long run by hampering the economic growth of the country. Another research used an extensive literature review to examine the effect of unique indicators on innovation by incorporating studies from 1980 to 2015 [8]. The analysis of the research represented that addition in landscape or indirect parameters like market launch, portfolio, synergy potential, etc can help to increase the innovation process in the long run but can neglect innovation in the short run. At the same time, it highlighted that the innovation process should be improved by the researchers, managers, and policymakers of an economy in order to raise innovation in the nation.
2.6. Research gap
Though previous literature studies highlighted the effect of financial determinants on innovation but they lacked a detailed econometrical analysis by considering various financial factors like market capitalization, exchange rate, interest rate, etc, indicating the addition to the past literature. In addition, the innovation parameter considered by the past studies is different and the underlying study uses the global innovation index, thereby highlighting the research gap. This research also considers both the individual effects of financial determinants, along with a combined effect of both economic and financial factors, which have not been undertaken by past researchers. Moreover, past literature has also undertaken qualitative research analysis on G10 economies, which is an addition to this research in comparison to past research analysis due to different groups of countries' analysis, which is considered by this research with the help of a new time period from 2011 to 2020. It depicts that the underlying research has significantly highlighted the research gap and aims to contribute to future research.
3. Methodology
3.1. Introduction
This section of the research highlights the quantitative research methodology undertaken to analyze the effect of financial determinants on the innovation index. It incorporates the research method and strategy included in the research, along with various hypothesis tests, and models considered by the research.
3.2. Research method and strategy
A quantitative research method is undertaken by the study to fulfill the set research aims. Based on this research method, statistical and econometrical methods and models are included to interpret the association between variables [9]. This study uses an analysis of panel data by considering the RE model, the FE model, and the Hausman test, along with statistical tests such as OLS regression, correlation matrix, etc. At the same time, it also uses a graphical analysis by highlighting the trend of GII across G10 economies during the period of 2011 to 2020 with the help of Stata software. Similarly, a quantitative research strategy based on positivism is undertaken by the research. It is based on cause and effect analysis with the help of the formulation of a hypothesis, data collection, data analysis, and providing a conclusion using empirical evidence [10]. For this purpose, the research has set null and alternative hypotheses for each model, data collection from reliable websites, and associations are determined on the basis of results. Therefore, the research uses a quantitative research method and strategy to examine the association between financial determinants and the GII index in G10 nations from 2005 to 2020 using Stata.
3.3. Model and hypothesis
There are three models under the analysis of panel data namely, the OLS regression model, the RE model, and the FE model. Thereafter, the Hausman test is conducted to determine the best-fit model between the three.
Trend of GII in G& countries from 2011 to 2020- This research objective includes a scatter plot of all G10 nations indicating the trend of GII in Canada, the Netherlands, Sweden, Switzerland, Belgium, Germany, Japan, the UK, the US, France, and Italy.
Effect of financial determinants on innovation index in G10 nations
(1) Pooled OLS
\( {Innovation Index_{it}}={β_{0}}+{β_{1}}{ Portfolio Investment_{it}}+{β_{2 }}{Turnover ratio_{it}}+{β_{3}}{ Market Capitalization_{it}} \) (1)
(2) Random effect model
\( {Innovation Index_{it}}={β_{0}}+{β_{1}}{ Portfolio Investment_{it}}+{β_{2 }}{Turnover ratio_{it}}+{β_{3}}{ Market Capitalization_{it}}+α+{μ_{it}}+{ϵ_{it}} \) (2)
(3) Fixed effect model
\( {Innovation Index_{it}}={β_{0}}+{β_{1}}{ Portfolio Investment_{it}}+{β_{2 }}{Turnover ratio_{it}}+{β_{3}}{ Market Capitalization_{it}}+{α_{0}}+{α_{1}}{D_{1}}+…+{μ_{it}} \) (3)
The Hausman test H0 and H1 are depicted below:
\( {H_{0}}: β1=0 (The RE model is the best fit model) \) (4)
\( {H_{1}}: β1≠0 (The FE model is the best fit model) \) (5)
If the p-value of the Hausman test is lower than or equal to 0.05 at a 5% significance level, the FE model is the best fit. However, if this value is more than 0.05, then a selection between the RE model and OLS model is determined on the basis of the hypothesis below:
\( {H_{0}}: β2=0 (The OLS model is the best fit model) \) (6)
\( {H_{1}}: β2≠0 (The RE model is best fit model) \) (7)
In addition, the significance of the explanatory variables is determined by:
\( {H_{0}}: β1=0 (The portfolio investment has no significant impact on the GII) \) (8)
\( {H_{1}}: β1≠0 (The portfolio investment has a significant impact on the GII) \) (9)
\( {H_{0}}: β2=0 (The turnover ratio has no significant impact on the GII) \) (10)
\( {H_{1}}: β2≠0 (The turnover ratio has a significant impact on the GII) \) (11)
\( {H_{0}}: β3=0 (The market capitalization has no significant impact on the GII) \) (12)
\( {H_{1}}: β3≠0 (The market capitalization has a significant impact on the GII) \) (13)
If the p-value of the coefficient is lower than 5%, H0 is rejected and it is highlighted that the financial determinant impacts the GII significantly at a 5% level.
Impact of economic parameters on innovation index in G10 countries
(1) Pooled OLS
\( {Innovation Index_{it}}={β_{0}}+{β_{1}}{ GDP growth_{it}}+{β_{2 }}{Inflation rate_{it}}+{β_{3}}{ Uenmployment rate_{it}} \) (14)
(2) Random effect model
\( {Innovation Index_{it}}={β_{0}}+{β_{1}}{ GDP growth_{it}}+{β_{2 }}{Inflation rate_{it}}+{β_{3}}{ Uenmployment rate_{it}}α+{μ_{it}}+{ϵ_{it}} \) (15)
(3) Fixed effect model
\( {Innovation Index_{it}}={β_{0}}+{β_{1}}{ GDP growth_{it}}+{β_{2 }}{Inflation rate_{it}}+{β_{3}}{ Uenmployment rate_{it}}+{α_{0}}+{α_{1}}{D_{1}}+…+{μ_{it}} \) (16)
The hypothesis for this research objective is also the same as the above research aim. Thus, in this case also,
(1)
\( {H_{0}}: β1=0 (The RE model is the best fit model) \) (17)
\( {H_{1}}: β1≠0 (The FE model is the best fit model) \) (18)
(2)
\( {H_{0}}: β2=0 (The OLS model is the best fit model) \) (19)
\( {H_{1}}: β2≠0 (The RE model is best fit model) \) (20)
(3)
\( {H_{0}}: β1=0 (The GDP growth has no significant effect on the GII) \) (21)
\( {H_{1}}: β1≠0 (The GDP growth has a significant effect on the GII) \) (22)
(4)
\( {H_{0}}: β2=0 (The inflation rate has no significant effect on the GII) \) (23)
\( {H_{1}}: β2≠0 (The inflation rate has a significant effect on the GII) \) (24)
(5)
\( {H_{0}}: β3=0 (The unemployment rate has no significant effect on the GII) \) (25)
\( {H_{1}}: β3≠0 (The unemployment rate has a significant effect on the GII) \) (26)
3.4. Data
The data for all the parameters is obtained from World Development Indicators, which is an open and reliable source [11]. The data for GII is collected from the World Intellectual Property Organization (WIPO) report for the respective years from 2011 to 2020.
4. Results and Discussion
4.1. Descriptive Statistics
Table 1 highlights the descriptive statistics of the data undertaken for the research analysis. It shows that there are a total of 110 observations for all variables, except turnover ratio and market capitalization as the data was missing for Sweden. The missing values have been computed using the mean imputation method. In addition, the mean value of GII is 56.925 and its standard deviation is 6.006, highlighting a significant variability in the dataset of G10 nations. In addition, the minimum GII of G10 nations is 40.690 and its maximum is 68.400. Similarly, there exists a significant variability in the portfolio investment as its mean is -16500000000 while the standard deviation is 133000000000. However, the variability in GDP growth is less as there is a small difference between its mean value and standard deviation.
Table 1: Descriptive Statistics
Variable | Obs | Mean | Std. Dev. | Min | Max |
GII | 110 | 56.925 | 6.006 | 40.690 | 68.400 |
Portfolio inv | 110 | -16500000000 | 133000000000 | -540000000000 | 285000000000 |
Turnover ratio | 100 | 92.256 | 56.977 | 28.333 | 350.012 |
Market cap | 100 | 102.097 | 54.333 | 18.801 | 269.758 |
GDP growth | 110 | 0.923 | 2.416 | -10.360 | 4.489 |
Inflation | 110 | 1.209 | 1.017 | -1.144 | 3.856 |
Unemployment | 110 | 6.507 | 2.404 | 2.351 | 12.683 |
4.2. Trend of GII index in G10 economies
A scatterplot is used to highlight the trend of the GII index in G10 countries from 2010 to 2010. The graph in Figure 1 highlights that there has been a significant improvement in the GII index of France, Germany, Italy, Japan, and the US because the scatter plot highlights the upward trend over the years. On the contrary economies like Belgium, Canada, Sweden, Switzerland, the Netherlands, and the UK have not made a significant growth in their GII index over these years.
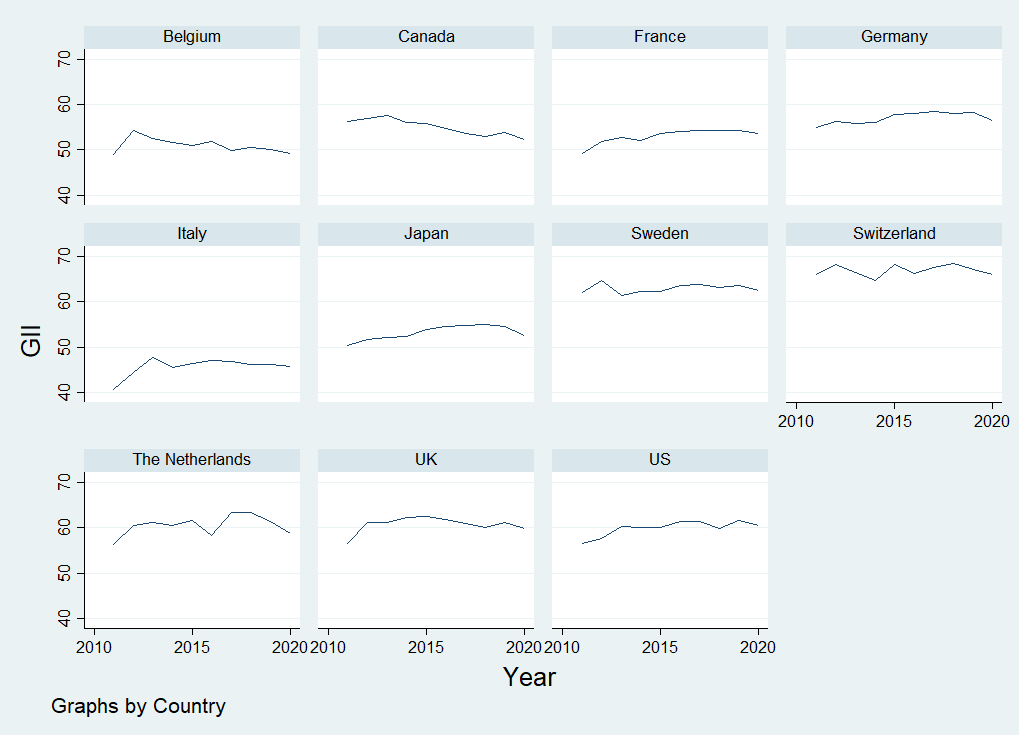
Figure 1: GII index across G10 economies from 2010 to 2020
4.3. The effect of financial determinants on innovation index in G10 nations
In order to fulfill this research objective, the research considers a correlation matrix as indicated in Table 2 below. It represents the association and the degree of correlation between two variables. As per the correlation matrix, there is a low negative correlation between GII and portfolio investment as the correlation value is -0.094. Similarly, a low degree of association exists between GII and turnover ratio. On the contrary, a high degree of positive association is highlighted between market capitalization and GII.
Table 2: Correlation Matrix
GII | Portfolio inv | Turnover ratio | Market cap | |
GII | 1 | |||
Portfolio inv | -0.094 | 1 | ||
Turnover ratio | -0.396 | -0.113 | 1 | |
Market cap | 0.783 | -0.252 | -0.310 | 1 |
After the correlation matrix, the Hausman test is conducted to analyze the best-fit model to determine the association between financial determinants and the innovation index. The results of the Hausman test, presented in Table 3 below depict that as the p-value is lower than 0.05, the null hypothesis is rejected and it can be depicted that the FE model is the best fit for this analysis.
Table 3: Hausman test results
fe | re | Difference | S.E. | |
Portfolio inv | 2.90E-12 | 2.64E-12 | 2.60E-13 | 1.77E-13 |
Turnover ratio | -0.014739 | -0.0144018 | -0.0003371 | 0.0016251 |
Market cap | 0.018288 | 0.0266626 | -0.0083747 | 0.0030757 |
b = consistent under Ho and Ha; obtained from xtregB = inconsistent under Ha, efficient under Ho; obtained from xtregTest: Ho: difference in coefficients not systematicchi2(2) = (b-B)'[(V_b-V_B)^(-1)](b-B)8.04Prob>chi2 = 0.0180 | ||||
Thus, the results of the FE model selected from the Hausman test are shown in Table 4. It depicts that there exists a positive association between portfolio investment and the GII index in G10 countries. This is because it highlights that a rise in portfolio investment by a US$ leads to an increase in the GII index of G10 nations by 0.0000000000029 units, keeping other factors constant. The results are significant at a 5% significance level. Additionally, a hike in the turnover ratio of the G10 economy by a percentage point reduces the GII index by 0.015 units, ceteris paribus. Lastly, there is also an addition in the GII index by 0.018 units because of a hike in market capitalization by 1 percent point. Both these results are also significant at a 5% level as the p-value is lower than 0.05. Therefore, the regression equation of the model can be expressed as:
\( {Global Innovation Index_{it}}=55.866+0.0000000000029{ Portfolio Investment_{it}}- 0.015 {Turnover ratio_{it}}+0.018 { Market Capitalization_{it}} \) (27)
Table 4: The FE model results
GII | Coef. | Std. Err. | t | P>t | [95% Conf. | Interval] |
Portfolio inv | 2.90E-12 | 1.5E-12 | 2.000 | 0.049 | 1.47E-14 | 5.79E-12 |
Turnover ratio | -0.015 | 0.006 | -2.300 | 0.024 | -0.027 | -0.002 |
Market cap | 0.018 | 0.009 | 2.070 | 0.041 | 0.001 | 0.036 |
_cons | 55.866 | 1.237 | 45.160 | 0.000 | 53.407 | 58.324 |
4.4. The impact of economic factors on the Global Innovation Index in G10 countries
For this purpose, a correlation index followed by the Hausman test, along with the RE or the FE model is included. Table 5 represents the results of the correlation matrix. It shows that the correlation coefficient between GDP growth and GII is 0.2535, highlighting a low degree of correlation between the two. In addition, a low degree of correlation exists between inflation and GII as the coefficient is -0.145. At last, a negative moderate correlation coefficient between unemployment and GII is -0.492.
Table 5: Correlation matrix results
GII | GDP growth | Inflation | Unemployment | |
GII | 1 | |||
GDP growth | 0.254 | 1 | ||
Inflation | -0.145 | 0.190 | 1 | |
Unemployment | -0.492 | -0.093 | 0.054 | 1 |
In addition, the results of the Hausman test show that the FE model is selected over the RE model as the best-fit model. This is because the p-value of the Hausman test is 0.0180, as highlighted in Table 6 below, which is lesser than 0.05, thus the H0 is rejected.
Table 6: Hausman test results
fe | re | Difference | S.E. | |
GDP growth | 1.44E-01 | 1.55E-01 | -1.14E-02 | 3.56E-03 |
Inflation | -0.5274254 | -0.5473129 | 0.0198874 | 0.0171552 |
Unemployment | -0.240823 | -0.3019856 | 0.0611627 | 0.0303124 |
b = consistent under Ho and Ha; obtained from xtreg B = inconsistent under Ha, efficient under Ho; obtained from xtreg Test: Ho: difference in coefficients not systematic chi2(3) = (b-B)'[(V_b-V_B)^(-1)](b-B) = 10.85 Prob>chi2 = 0.0126 | ||||
As the results of the Hausman test depict that the FE is the best-fit model, results are presented in the form of a table below. The results show that there is a significant rise in the GII index of 0.144 units due to an addition in the GDP growth rate of G10 countries, ceteris paribus. These results are significant at a 5% significance level. Apart from this, a hike in the inflation rates affects the GII index negatively as an addition to a 1% inflation rate leads to a decline in the GII by 0.527, keeping other factors constant. It is also significant at a 5% level. Similarly, the GII index of G10 nations declines by 0.241 points because of the rise in unemployment rates in the nation by a percent point. The result is significant at a 10% significance level. Therefore, the regression equation of the model is:
\( {Innovation Index_{it}}=58.997+0.144{ GDP growth_{it}}-0.527 {Inflation rate_{it}}-0.241{ Uenmployment rate_{it}} \) (28)
Table 7: The FE model results
GII | Coef. | Std. Err. | t | P>t | [95% Conf. | Interval] |
GDP growth | 0.144 | 0.066 | 2.170 | 0.033 | 0.012 | 0.276 |
Inflation | -0.527 | 0.183 | -2.880 | 0.005 | -0.891 | -0.164 |
Unemployment | -0.241 | 0.132 | -1.830 | 0.070 | -0.502 | 0.020 |
_cons | 58.997 | 0.909 | 64.910 | 0.000 | 57.193 | 60.802 |
4.5. Discussion of the results
The results of the underlying research highlight that a rise in portfolio investment leads to an addition in the GII index of G10 nations. Similarly, higher market capitalization is associated with a rise in the GII. However, results also show that a higher turnover ratio affects the GII of G10 economies negatively. These results are aligned with the past studies of literature as they highlighted that a hike in financial determinants like FDI, capitalization, etc has a positive impact on the innovation index in the economy [5, 6]. At the same time, the analysis also indicates that a hike in GDP growth, along with a decline in the inflation rate and unemployment rates in G10 countries causes an addition to the GII index. These findings also align with the previous literature studies as they highlighted that favorable economic factors such as allocation of resources, effectiveness in socio-economic outcomes, etc lead to an addition to the innovation in the economy. It highlights that it is crucial for the policymakers and the government to undertake policies that help in increasing portfolio investment in the nation as it positively adds to the GII. In addition, a measure to raise market capitalization further causes a hike in the GII of G10 economies. Similarly, policies to stimulate the GDP growth rate can also hamper GII. In addition, necessary measures should be undertaken to reduce the unemployment rates, along with inflation rates as they impact the GII of G10 countries negatively. Therefore, it can be concluded that all these policies can lead to favorable financial and economic determinants, which further lead to an addition to the global innovation index in G10 economies.
5. Conclusion
This study examines the effect of financial determinants on the Global Innovation Index in G10 nations from 2010 to 2020. The analysis is conducted using Stata and the models incorporated are the RE model, the FE model, and the Hausman test. The trend analysis reveals that a few economies have witnessed a hike in their global innovation index over the period like Germany, the US, etc while the other economies need significant improvement in their GII to stimulate economic development in the long run. Furthermore, for both the research objective the FE model is the best-fit model. In addition, the results also highlight that financial determinants and economic factors stimulate GII in G10 nations. This is because a rise in market capitalization, along with an increase in portfolio investment helps to hamper the GII of these countries. Moreover, the additional GDP growth rate, a decline in the unemployment rate, and a reduction in the inflation rate further stimulate the GII of the G10 countries as they help the economies to innovate, which further adds to technological progress hampering the nation’s economic development in the long run. However, this study has certain limitations. The results of the analysis are limited to only G10 economies and the study’s results consider only three financial and economic determinants. Despite these limitations, the research is useful and can be used by future researchers as it indicates the effect of financial determinants on the global innovation index in G10 countries, along with the policy recommendations.
References
[1]. UK Government (2024) G10 nations to harness AI and innovation to drive growth and productivity. https://www.gov.uk/government/news/G10-nations-to-harness-ai-and-innovation-to-drive-growth-and-productivity#:~:text=G10%20nations%20have%20signed%20an,global%20productivity%20and%20economic%20growth.&text=the%20public%20sector-,G10%20nations%20have%20signed%20an%20agreement%20to%20unite%20and%20harness,global%20productivity%20and%20economic%20growth.
[2]. WIPO (2024) Global Innovation Index. https://www.wipo.int/web/global-innovation-index
[3]. IGI Global (2024) What is Financial Factors? https://www.igi-global.com/dictionary/financial-factors/39752
[4]. Khraisha, T., Arthur, K. (2018) Can we have a general theory of financial innovation processes? A conceptual review. Financial Innovation, 4: 1-27.
[5]. Khan, A., Chenggang, Y., Hussain, J., Kui, Z. (2021) Impact of technological innovation, financial development and foreign direct investment on renewable energy, non-renewable energy and the environment in belt & Road Initiative countries. Renewable Energy, 171: 479-491.
[6]. García-Quevedo, J., Segarra-Blasco, A., Teruel, M. (2018) Financial constraints and the failure of innovation projects. Technological forecasting and social change, 127: 127-140.
[7]. Smol, M., Kulczycka, J., Avdiushchenko, A. (2017) Circular economy indicators in relation to eco-innovation in European regions. Clean Technologies and Environmental Policy, 19: 669-678.
[8]. Dziallas, M., Blind, K. (2019) Innovation indicators throughout the innovation process: An extensive literature analysis. Technovation, 80: 3-29.
[9]. Bloomfield, J., Fisher, M.J. (2019) Quantitative research design. Journal of the Australasian Rehabilitation Nurses Association, 22(2): 27-30.
[10]. Park, Y.S., Konge, L., Artino Jr, A.R. (2020) The positivism paradigm of research. Academic medicine, 95(5): 690-694.
[11]. World Development Indicators (2024) Data Bank. https://databank.worldbank.org/source/world-development-indicators#
Cite this article
Xiong,T. (2025). Financial Drivers of Innovation: An Analysis of Its Determinants in G10 Nations. Advances in Economics, Management and Political Sciences,161,24-33.
Data availability
The datasets used and/or analyzed during the current study will be available from the authors upon reasonable request.
Disclaimer/Publisher's Note
The statements, opinions and data contained in all publications are solely those of the individual author(s) and contributor(s) and not of EWA Publishing and/or the editor(s). EWA Publishing and/or the editor(s) disclaim responsibility for any injury to people or property resulting from any ideas, methods, instructions or products referred to in the content.
About volume
Volume title: Proceedings of the 4th International Conference on Business and Policy Studies
© 2024 by the author(s). Licensee EWA Publishing, Oxford, UK. This article is an open access article distributed under the terms and
conditions of the Creative Commons Attribution (CC BY) license. Authors who
publish this series agree to the following terms:
1. Authors retain copyright and grant the series right of first publication with the work simultaneously licensed under a Creative Commons
Attribution License that allows others to share the work with an acknowledgment of the work's authorship and initial publication in this
series.
2. Authors are able to enter into separate, additional contractual arrangements for the non-exclusive distribution of the series's published
version of the work (e.g., post it to an institutional repository or publish it in a book), with an acknowledgment of its initial
publication in this series.
3. Authors are permitted and encouraged to post their work online (e.g., in institutional repositories or on their website) prior to and
during the submission process, as it can lead to productive exchanges, as well as earlier and greater citation of published work (See
Open access policy for details).
References
[1]. UK Government (2024) G10 nations to harness AI and innovation to drive growth and productivity. https://www.gov.uk/government/news/G10-nations-to-harness-ai-and-innovation-to-drive-growth-and-productivity#:~:text=G10%20nations%20have%20signed%20an,global%20productivity%20and%20economic%20growth.&text=the%20public%20sector-,G10%20nations%20have%20signed%20an%20agreement%20to%20unite%20and%20harness,global%20productivity%20and%20economic%20growth.
[2]. WIPO (2024) Global Innovation Index. https://www.wipo.int/web/global-innovation-index
[3]. IGI Global (2024) What is Financial Factors? https://www.igi-global.com/dictionary/financial-factors/39752
[4]. Khraisha, T., Arthur, K. (2018) Can we have a general theory of financial innovation processes? A conceptual review. Financial Innovation, 4: 1-27.
[5]. Khan, A., Chenggang, Y., Hussain, J., Kui, Z. (2021) Impact of technological innovation, financial development and foreign direct investment on renewable energy, non-renewable energy and the environment in belt & Road Initiative countries. Renewable Energy, 171: 479-491.
[6]. García-Quevedo, J., Segarra-Blasco, A., Teruel, M. (2018) Financial constraints and the failure of innovation projects. Technological forecasting and social change, 127: 127-140.
[7]. Smol, M., Kulczycka, J., Avdiushchenko, A. (2017) Circular economy indicators in relation to eco-innovation in European regions. Clean Technologies and Environmental Policy, 19: 669-678.
[8]. Dziallas, M., Blind, K. (2019) Innovation indicators throughout the innovation process: An extensive literature analysis. Technovation, 80: 3-29.
[9]. Bloomfield, J., Fisher, M.J. (2019) Quantitative research design. Journal of the Australasian Rehabilitation Nurses Association, 22(2): 27-30.
[10]. Park, Y.S., Konge, L., Artino Jr, A.R. (2020) The positivism paradigm of research. Academic medicine, 95(5): 690-694.
[11]. World Development Indicators (2024) Data Bank. https://databank.worldbank.org/source/world-development-indicators#