


1. Introduction
The transition to a green low-carbon economy is a critical strategy for addressing climate change. And China’s 14th Five-Year Plan clearly sets the goal of reaching carbon peak by 2030 and carbon neutrality by 2060. As a major carbon emitter, the construction industry must accelerate its green transformation. In this process, steel structures, as an energy-efficient and eco-friendly building material, play a key role. However, existing research has primarily focused on macro-level policies and technological developments, with limited quantitative analysis of the paths and effects of green transformation in small and medium-sized enterprises [1]. Shandong Province, as a core region for steel structure production and application in China, leads the country in both processing volume and output value of steel structures [2].Thus, this paper selects a typical steel structure enterprise in Zibo, Shandong Province as the research object, combines the green transformation practice of this enterprise in recent years, and explores its transformation and upgrading path under the concept of sustainable development. Specifically, it aims to assess the impact of an enterprise’s technological innovation, environmental protection investment, resource allocation and other factors on its business performance and growth potential, as well as to elucidate how steel structure enterprises can boost their sustainable development capacity through green transformation. To deeply explore the effect of the enterprise’s transformation and upgrading, the paper adopts the disaster progression method to analyze the comprehensive impact of different factors on the enterprise’s transformation through the quantitative assessment of key indicators. The research data mainly comes from the sustainability reports and annual financial statements of enterprises from 2019 to 2023. As such, the study aims to provide recommendations for related enterprises on optimizing resource allocation, enhancing technological innovation, and boosting green performance in response to policy changes and market pressures.
2. Literature review
To explore the theoretical basis and practical path of green transformation, numerous studies have centered on the evaluation methodology, industry application and enterprise development of green technology innovation.
The evaluation methods of green technology innovation are undergoing constant enhancement. And the most commonly used evaluation tools are the comprehensive evaluation method based on an indicator system and the intelligent algorithm based on a mathematical model. Previous research proposed an evaluation system for urban green technology innovation, and built a multi-indicator system for enterprise green technology innovation via hierarchical clustering method, identifying internal and external factors affecting innovation [3,4]. In the study of paper industry, an innovation capability evaluation model based on support vector machine was proposed [5]. In addition, entropy weight TOPSIS method was used to evaluate the performance of green technology innovation [6]. Gray fuzzy comprehensive evaluation method was used to assess the green development level of automobile manufacturing enterprises [7]. The multi-attribute decision-making method with fuzzy number intuition fuzzy information was also used to assess the innovation capability of high-tech enterprises [8]. And the DEA (Data Envelopment Analysis) window analysis method was used to measure the green technology innovation capability of the manufacturing industry [9].
In terms of green technology innovation performance analysis, some studies used the DEA-RAM model to assess the green performance efficiency of the manufacturing industry and proposed an improvement path [10]. Moreover, structural equation modeling was used to explore the role of green innovation in promoting the greening of enterprise supply chains, clarifying the key position of green technology in supply chain management [11]. These studies provide a theoretical basis and practical path for the optimization of green performance of enterprises. The industry path of green transformation has also received academic attention. Most studies have used fuzzy comprehensive evaluation, hierarchical analysis and support vector machine to deal with the evaluation index data, but these methods are somewhat subjective in terms of weight allocation [12]. To fill this gap, this study uses the mutation degree method, combined with the specific characteristics of the steel structure industry, to assess the effectiveness of enterprise transformation and upgrading [13]. And the method is simple, efficient, and provides empirical evidence and practical guidance for optimizing transformation strategies and promoting sustainable development in the construction industry.
3. Methodology
3.1. Research Subject
In this paper, a comprehensive steel structure enterprise in Zibo City, Shandong Province is selected as the research subject, which is primarily engaged in steel structure design, assembly component production and construction installation. And the company has an annual steel structure production capacity of 30,000 tons, a yearly production capacity of 1 million square meters for floor slabs and color steel products, and an engineering installation capacity of over 500,000 m2. Its products are widely applied in various fields. In recent years, the company has won several prestigious awards, including the China Steel Structure Gold Award as well as the State Grid Power Transmission and Transformation Gold Award. And it holds over 20 patents and qualifications in steel structure contracting and manufacturing, along with multiple international quality certifications. Recognized as a High-tech Enterprise and a Technology-based SME, this study uses the company’s operational data to empirically analyze its green transformation path and influencing factors.
3.2. Construction of the Catastrophe Progression Method
From 2019 until the present, led by government policies, the corporation has concentrated on technical and energy use transformation to achieve sustainable development. Thus, the catastrophe progression model, commonly used in enterprise analysis, is employed to analyze the sustainable development effectiveness of its transformation and upgrading. According to catastrophe theory, there are seven types of mutation systems, with the spire, swallowtail, and butterfly catastrophes being the most common, involving two, three, and four sub-indicators, respectively.
Let f(x) be the potential function of the state variable x, and a, b, c, d denote the control variables. According to catastrophe theory, by taking the second order derivative of f(x), that is, f''(x)=0, and eliminating x, the divergence point set equation is obtained, indicating that the system undergoes a mutation when the control variables satisfy the equation. The divergence set equation can be further derived from the normalization equation, and the different qualitative states of the control variables in the system are reduced to the same qualitative state by the normalization formula [14]. The types of catastrophe systems and related expressions selected are shown in Table 1. After selecting the model, the evaluators rank the importance of the indicators within the same level based on the company’s experience and determine whether the indicators are complementary [15]. If the control variables of the same object are not significantly correlated, they are non-complementary; otherwise, they are complementary. For non-complementary indicators, the value is taken as the minimum of the maximum values, i.e., x=min{xa,xb,xc,xd}; for complementary indicators, the value is calculated as the average, i.e., x=(xa+xb+xc+xd)/4. In this way, the overall performance of the company’s transformation and upgrading is derived and analyzed using this method.
Table 1: Mutation System Types and Related Expressions
Type | No. of variables | System model | Divergence point set equation | Normalization formula |
The cusp catastrophe | 2 | f(x)=x4+ax2+bx | a=-6x2,b=8x3 | xa= \( \sqrt[]{a} \) ,xb= \( \sqrt[3]{b} \) |
The swallowtail catastrophe | 3 | f(x)= \( \frac{1}{5} \) x5+ \( \frac{1}{3} \) ax3+ \( \frac{1}{2} \) bx+cx | a=-6x2,b=8x3, c=-3x4 | xa= \( \sqrt[]{a} \) ,xb= \( \sqrt[3]{b} \) , xc= \( \sqrt[4]{c} \) |
The butterfly catastrophe | 4 | f(x)= \( \frac{1}{6} \) x6+ \( \frac{1}{4} \) ax4+ \( \frac{1}{3} \) bx3+ \( \frac{1}{2} \) cx2+dx | a=-10x2,b=20x3, c=-15x4,d=5x5 | xa= \( \sqrt[]{a} \) ,xb= \( \sqrt[3]{b} \) , xc= \( \sqrt[4]{c} \) ,xd= \( \sqrt[5]{d} \) |
3.3. Indicator Selection and Data Processing
Based on sustainable development theory and catastrophe theory, and following the principles of purposefulness, comprehensiveness, feasibility, and stability in constructing the evaluation index system, this study analyzes and organizes relevant indicators, proposing a set of programs suitable for evaluating the development benefits of steel structure enterprises, as shown in Figure 1. The study establishes three primary indicators, including economic performance, green performance and operational performance. The economic performance is evaluated based on financial status and market performance, subdivided into six quantifiable tertiary indicators, such as sales revenue, research expenses, number of customers served, and number of patents. The green performance is evaluated based on environmental protection and resource recycling, with four sub-indicators, such as environmental protection inputs and energy consumption. And the operational performance is evaluated based on production efficiency and human resources, with four sub-indicators, including output of steel components, product qualification rate, and number of employees. In addition, the priority ranking of each tertiary indicator is based on the results of industry expert ratings, and arranged in ascending order after weight calculation. All indicator data are sourced from the sustainability reports, annual reports and financial statements from 2019 to 2023.
Before applying the model, the original data must be dimensionless, as the value ranges and measurement units of the indicators differ. The original data for control variables are transformed to fall between [0, 1]. Indicators are divided into positive and negative categories. Positive indicators are converted using formula (1), while negative indicators are converted using formula (2). Here, i=1,2,3,... , m (m is the number of indicators), and j=1,2,3,..., n (n is the number of indicators).
\( {y_{ij}}=\frac{{x_{ij}}-{x_{min(i)}}}{{x_{max(i)}}-{x_{min(i)}}} \) (1)
\( {y_{ij}}=\frac{{x_{max(i)}}-{x_{ij}}}{{x_{max(i)}}-{x_{min(i)}}} \) (2)
The data after dimensionless processing are shown in Table 2. Since the product qualification rate of this steel structure enterprise is always maintained at 95%, the scrap rate is stably controlled at 5%, and the recycling rate reaches 100% from 2019 to 2023, these indicators are at extreme values in the data. To ensure the effectiveness of the dimensionless treatment and the relative comparability of the results, the values of C9, C10 and C12 after dimensionless are set to 0.500.
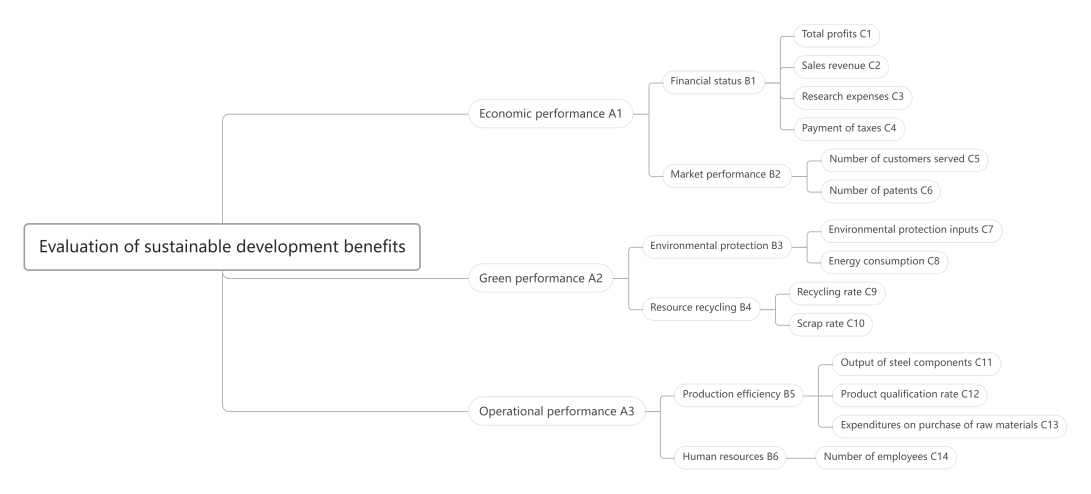
Figure 1: Indicator Level
Table 2: Dimensionless Values of the Tertiary Indicator
Tertiary indicators Year | 2019 | 2020 | 2021 | 2022 | 2023 |
Total profits C1 | 0.525 | 0.595 | 0.670 | 0.000 | 1.000 |
Sales revenue C2 | 0.000 | 0.325 | 1.000 | 0.875 | 0.943 |
Research expenses C3 | 0.000 | 0.326 | 1.000 | 0.877 | 0.889 |
Payment of taxes C4 | 0.045 | 0.000 | 0.310 | 0.135 | 1.000 |
Number of customers served C5 | 0.000 | 0.075 | 0.425 | 0.725 | 1.000 |
Number of patents C6 | 0.750 | 1.000 | 0.750 | 0.000 | 0.25 |
Environmental protection inputs C7 | 0.000 | 0.000 | 0.116 | 0.000 | 1.000 |
Energy consumption C8 | 0.0329 | 0.457 | 0.108 | 0.000 | 1.000 |
Recycling rate C9 | 0.500 | 0.500 | 0.500 | 0.500 | 0.500 |
Scrap rate C10 | 0.500 | 0.500 | 0.500 | 0.500 | 0.500 |
Output of steel components C11 | 0.000 | 0.339 | 0.777 | 0.941 | 1.000 |
Product qualification rate C12 | 0.500 | 0.500 | 0.500 | 0.500 | 0.500 |
Expenditures on purchase of raw materials C13 | 0.000 | 0.211 | 0.587 | 1.000 | 0.808 |
Number of employees C14 | 0.000 | 0.000 | 0.571 | 1.000 | 0.667 |
4. Calculation Results and Overall Evaluation
4.1. Calculation of Secondary Indicators
The secondary indicators of enterprise transformation and upgrading are calculated and normalized to ensure effective comparison among different measures. For the financial status indicator (B1), with C1, C2, C3, and C4 as components, a butterfly mutation model is used for quantitative evaluation. This model assumes a complementary relationship between the control variables, with the calculation formula as follows::
xB1= \( \frac{(\sqrt[]{{x_{C1}}}+\sqrt[3]{{x_{C2}}}+\sqrt[4]{{x_{C3}}}+\sqrt[5]{{x_{C4}}})}{4} \) (3)
The market performance (B2) indicator is composed of two sub-indicators, C5 and C6, which are processed using the peak mutation model and additional control variables. The calculation formula is as follows:
xB2= \( \frac{(\sqrt[]{{x_{C5}}}+\sqrt[3]{{x_{C6}}})}{2} \) (4)
The environmental protection (B3) indicator is composed of two sub-indicators, C7 and C8, and is processed using the cusp mutation model with complementary control variables. The calculation formula is as follows:
xB3= \( \frac{(\sqrt[]{{x_{C7}}}+\sqrt[3]{{x_{C8}}})}{2} \) (5)
The resource recycling (B4) indicator is composed of two sub-indicators, C9 and C10, which are processed using the cusp mutation model with complementary control variables. The calculation formula is as follows:
xB4= \( \frac{(\sqrt[]{{x_{C9}}}+\sqrt[3]{{x_{C10}}})}{2} \) (6)
The production efficiency (B5) indicator is composed of three sub-indicators, C11, C12 and C13, which are processed using the swallow-tailed mutation model, with calculation formula as follows:
xB5= \( \frac{(\sqrt[]{{x_{C11}}}+\sqrt[3]{{x_{C12}}}+\sqrt[4]{{x_{C13}}})}{3} \) (7)
Table 3 presents the results of the dimensionless calculations for each of the secondary indicators from 2019 to 2023.
Table 3: Dimensionless Values of the Secondary Indicators
Secondary indicators Year | 2019 | 2020 | 2021 | 2022 | 2023 |
Financial status B1 | 0.316 | 0.554 | 0.902 | 0.649 | 0.988 |
Market performance B2 | 0.454 | 0.637 | 0.780 | 0.426 | 0.815 |
Environmental protection B3 | 0.160 | 0.385 | 0.408 | 0.000 | 1.000 |
Resource recycling B4 | 0.750 | 0.750 | 0.750 | 0.750 | 0.750 |
Production efficiency B5 | 0.265 | 0.792 | 0.850 | 0.921 | 0.914 |
Human resources B6 | 0.000 | 0.000 | 0.571 | 1.000 | 0.667 |
4.2. Calculation of Primary indicators
The primary indicators are quantitatively assessed based on secondary indicator calculations, i.e. economic performance (A1), green performance (A2) and operational performance (A3), which are analyzed via the cusp mutation model, assuming a complementary relationship between the control variables. The A1 indicator, composed of B1 and B2, is analyzed using the cusp mutation model with complementary control variables. The calculation formula is as follows:
xA1= \( \frac{(\sqrt[]{{x_{B1}}}+\sqrt[3]{{x_{B2}}})}{2} \) (8)
The A2 indicator, composed of B3 and B4, is also analyzed by using the cusp mutation model with complementary control variables. The calculation formula is as follows:
xA2= \( \frac{(\sqrt[]{{x_{B3}}}+\sqrt[3]{{x_{B4}}})}{2} \) (9)
The A3 indicator, composed of B5 and B6, is analyzed by using the cusp mutation model with complementary control variables. The calculation formula is as follows:
xA3= \( \frac{(\sqrt[]{{x_{B5}}}+\sqrt[3]{{x_{B6}}})}{2} \) (10)
Table 4 presents the results of the dimensionless calculations for each of the first-level indicators from 2019 to 2023.
Table 4: Dimensionless Values of the Primary Indicators
Primary indicators Year | 2019 | 2020 | 2021 | 2022 | 2023 |
Economic performance A1 | 0.665 | 0.802 | 0.935 | 0.779 | 0.964 |
Green performance A2 | 0.654 | 0.765 | 0.774 | 0.454 | 0.954 |
Operational performance A3 | 0.257 | 0.445 | 0.876 | 0.980 | 0.915 |
4.3. Total Performance Results and Evaluation
The total performance consists of three components: economic performance, green performance and operational performance, with the weights of A2, A3 and A1 in decreasing order. The formula for calculating total performance is as follows:
A= \( \frac{(\sqrt[]{{x_{A2}}}+\sqrt[3]{{x_{A3}}}+\sqrt[4]{{x_{A1}}})}{3} \) (11)
The total performance calculation results are shown in Table 5, and the performance is depicted in Figure 2.
Table 5: Total Performance
Year | 2019 | 2020 | 2021 | 2022 | 2023 |
Total performance | 0.783 | 0.861 | 0.940 | 0.869 | 0.979 |
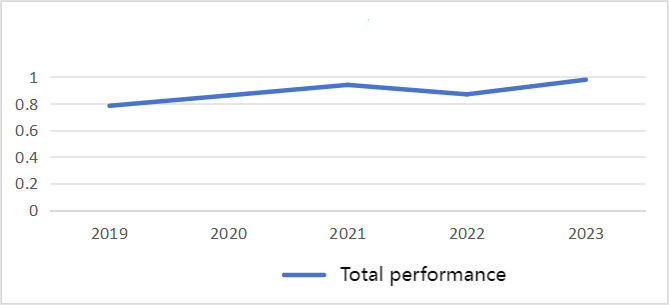
Figure 2: Performance Chart
The performance results indicate that during the period from 2019 to 2023, as the company embraced the concept of sustainable development and underwent green transformation, its total performance gradually improved, hence showing a positive growth trend. Driven by national policy guidance and its own development needs, the company balanced operating costs, technological innovation, and R&D investments to achieve intelligent and green transformation in production and processing. At the same time, the company actively responded to the environmental protection calls, increasing environmental investment and ensuring that pollutant emissions from all construction projects met national standards, reflecting a strong sense of social responsibility and environmental awareness. Despite the temporary decline in some performance indicators due to the impact of special economic periods, this fluctuation is a contingent factor and does not affect the positive evaluation of the company’s overall development [16]. Thus, similar companies should recognize the importance of green innovation, environmental protection investment, policy adaptability and human resource allocation for sustainable development, and only by achieving coordinated development can they stand out in the fierce market competition and promote green, smart and efficient sustainable development.
At the end of 2023, the company further promoted green innovation by installing a distributed photovoltaic power generation system with a total capacity of 645.7 kilowatts on the roof of the plant, with an average annual power generation capacity of about 656,000 kWh, which saves 181.97 tons of coal combustion per year compared with a thermal power plant with the same power generation capacity; and mitigates the emission of carbon dioxide (CO2), a greenhouse effect gas, by 496.54 tons per year; It reduces the emission of air pollutant gas (SO2) by about 0.1 tons per year; and reduces soot by about 0.02 tons per year. In addition, the project significantly saves water and reduces the impact of wastewater and warm drainage on the water environment. This environmental initiative not only consolidates the company’s determination on the path of green and sustainable development, but sets an example for other enterprises in the industry to make a green transition.
5. Conclusion
This paper evaluates the transformation and upgrading path and effect of a steel structure enterprise in Zibo, Shandong Province, under the concept of sustainable development based on the catastrophe process method. The results demonstrate that the enterprise has realized significant improvement in economic, environmental and operational performance via policy guidance and strategic adjustment in the process of green transformation. In particular, enterprises have increased their investment in technological innovation and R&D to enhance product value-added and market competitiveness, and have reached the goals of energy saving, emission reduction and green production by increasing environmental protection investment and resource recycling. Besides, enterprises have implemented green innovations such as distributed photovoltaic power generation driven by policies, further consolidating their leading position in the industry. However, the method primarily focuses on the overall effect of transformation and upgrading, without analyzing the specific impact of each indicator on the path. As different researchers choose different evaluation indicators based on their research background, it may lead to non-unique assessment results. Thus, future research should explore the mechanism and path of enterprise transformation from multiple dimensions, combine qualitative and quantitative analysis methods, construct a more comprehensive assessment model, and reveal the impact of different factors on the sustainable development of enterprises. Also, it should also focus on the long-term monitoring and dynamic adjustment of enterprise transformation strategies to enhance the adaptability and resilience of enterprises in the face of policy, market, and technological changes.
References
[1]. Liu, X. (2024) The impact of digital transformation of new energy enterprises on sustainable development performance under the background of “dual carbon”. Inner Mongolia University of Finance and Economics.
[2]. Li, Q.W., et al. (2022) Development Status and Prospect of Steel Structure Industry under Dual Carbon Target. Progress in Construction Steel Structure, 24(04): 1-6+23.
[3]. Hong, Y.Y. and He, Q. (2009) The evaluation analysis of green technological innovation. Comprehensive Evaluation of Economy and Society with Statistical Science, 547-550.
[4]. Xie, J.M., Tang. X.W. and Shao. Y.F. (2012) Researchonstratified cluster evaluation of enterprise green technology innovation based on the rough set. Technology and Investment, 3: 68-73.
[5]. Zhou. Z.F. (2014) On Evaluation Model of Green Technology Innovation Capability of Pulp and Paper Enterprise Based on Support Vector Machines. Advanced Materials Research, 886: 285-288.
[6]. Sun, L.Y., Miao, C.L. and Yang, L. (2017) Ecological-economic efficiency evaluation of green technology innovation in strategic emerging industries based on entropy weighted TOPSOS method. Ecological Indicators, 73: 554–558.
[7]. Tong, L., Zhong, S. and Zhang, X. (2017) Evaluation on green development ability of Chinese automobile manufacturing enterprises. In International conference on industrial economics system and industrial security engineering , 1-8.
[8]. Zeng, Z. (2017) Model for evaluating the Technological Innovation Capability in High-tech Enterprises with Fuzzy Number Intuitionistic Fuzzy Information. J. Intell. Fuzzy Syst., 33: 2085-2094.
[9]. Lin, S.F., Sun, D. and Zhao, M.D. (2018) Evaluation of the green technology innovation efficiency of China’s manufacturing industries: DEA window analysis with ideal window width. Technology Analysis &Strategic Management, 30(10): 1166-1181.
[10]. Wang, W.X., et al. (2017) Estimation of innovation’s green performance: A range-adjusted measure approach to assess the unified efficiency of China’s manufacturing industry. Journal of Cleaner Production, 149: 919-924.
[11]. Chiou. T.Y., et al. (2011) The influence of greening the suppliers and green innovation on environmental performance and competitive advantage in Taiwan. Transportation Research Part E, 47(6): 822-836.
[12]. Pan,, X., et al. (2020) Green innovation ability evaluation of manufacturing enterprises based on AHP–OVP model. Ann Oper Res, 290: 409-419).
[13]. Li, Y, Chen, X.H. and Zhang, P.F. (2007) Application of mutation series method in regional ecosystem health assessment[J].Chinese Population, Resources and Environment, 2007(03): 50-54.
[14]. Zhu Shunquan. Research on comprehensive evaluation of listed company performance based on mutation series method[J].Systems Engineering Theory & Practice,2002,(02):90-94+117.)
[15]. Han, S.P. (2022) Analysis and countermeasures of transformation and upgrading of D iron and steel company under the concept of green and sustainable development. Shijiazhuang Tiedao University.
[16]. Yin. P. and Liu, D. (2022) Study on the Chinese MSMEs Development in the Post-Epidemic Era[J].Academic Journal of Business & Management, 4(19):
Cite this article
Li,A. (2025). Analysis of Transformation and Upgrading Path of a Steel Structure Company in Zibo City, Shandong Province under the Concept of Sustainable Development. Advances in Economics, Management and Political Sciences,162,191-199.
Data availability
The datasets used and/or analyzed during the current study will be available from the authors upon reasonable request.
Disclaimer/Publisher's Note
The statements, opinions and data contained in all publications are solely those of the individual author(s) and contributor(s) and not of EWA Publishing and/or the editor(s). EWA Publishing and/or the editor(s) disclaim responsibility for any injury to people or property resulting from any ideas, methods, instructions or products referred to in the content.
About volume
Volume title: Proceedings of the 4th International Conference on Business and Policy Studies
© 2024 by the author(s). Licensee EWA Publishing, Oxford, UK. This article is an open access article distributed under the terms and
conditions of the Creative Commons Attribution (CC BY) license. Authors who
publish this series agree to the following terms:
1. Authors retain copyright and grant the series right of first publication with the work simultaneously licensed under a Creative Commons
Attribution License that allows others to share the work with an acknowledgment of the work's authorship and initial publication in this
series.
2. Authors are able to enter into separate, additional contractual arrangements for the non-exclusive distribution of the series's published
version of the work (e.g., post it to an institutional repository or publish it in a book), with an acknowledgment of its initial
publication in this series.
3. Authors are permitted and encouraged to post their work online (e.g., in institutional repositories or on their website) prior to and
during the submission process, as it can lead to productive exchanges, as well as earlier and greater citation of published work (See
Open access policy for details).
References
[1]. Liu, X. (2024) The impact of digital transformation of new energy enterprises on sustainable development performance under the background of “dual carbon”. Inner Mongolia University of Finance and Economics.
[2]. Li, Q.W., et al. (2022) Development Status and Prospect of Steel Structure Industry under Dual Carbon Target. Progress in Construction Steel Structure, 24(04): 1-6+23.
[3]. Hong, Y.Y. and He, Q. (2009) The evaluation analysis of green technological innovation. Comprehensive Evaluation of Economy and Society with Statistical Science, 547-550.
[4]. Xie, J.M., Tang. X.W. and Shao. Y.F. (2012) Researchonstratified cluster evaluation of enterprise green technology innovation based on the rough set. Technology and Investment, 3: 68-73.
[5]. Zhou. Z.F. (2014) On Evaluation Model of Green Technology Innovation Capability of Pulp and Paper Enterprise Based on Support Vector Machines. Advanced Materials Research, 886: 285-288.
[6]. Sun, L.Y., Miao, C.L. and Yang, L. (2017) Ecological-economic efficiency evaluation of green technology innovation in strategic emerging industries based on entropy weighted TOPSOS method. Ecological Indicators, 73: 554–558.
[7]. Tong, L., Zhong, S. and Zhang, X. (2017) Evaluation on green development ability of Chinese automobile manufacturing enterprises. In International conference on industrial economics system and industrial security engineering , 1-8.
[8]. Zeng, Z. (2017) Model for evaluating the Technological Innovation Capability in High-tech Enterprises with Fuzzy Number Intuitionistic Fuzzy Information. J. Intell. Fuzzy Syst., 33: 2085-2094.
[9]. Lin, S.F., Sun, D. and Zhao, M.D. (2018) Evaluation of the green technology innovation efficiency of China’s manufacturing industries: DEA window analysis with ideal window width. Technology Analysis &Strategic Management, 30(10): 1166-1181.
[10]. Wang, W.X., et al. (2017) Estimation of innovation’s green performance: A range-adjusted measure approach to assess the unified efficiency of China’s manufacturing industry. Journal of Cleaner Production, 149: 919-924.
[11]. Chiou. T.Y., et al. (2011) The influence of greening the suppliers and green innovation on environmental performance and competitive advantage in Taiwan. Transportation Research Part E, 47(6): 822-836.
[12]. Pan,, X., et al. (2020) Green innovation ability evaluation of manufacturing enterprises based on AHP–OVP model. Ann Oper Res, 290: 409-419).
[13]. Li, Y, Chen, X.H. and Zhang, P.F. (2007) Application of mutation series method in regional ecosystem health assessment[J].Chinese Population, Resources and Environment, 2007(03): 50-54.
[14]. Zhu Shunquan. Research on comprehensive evaluation of listed company performance based on mutation series method[J].Systems Engineering Theory & Practice,2002,(02):90-94+117.)
[15]. Han, S.P. (2022) Analysis and countermeasures of transformation and upgrading of D iron and steel company under the concept of green and sustainable development. Shijiazhuang Tiedao University.
[16]. Yin. P. and Liu, D. (2022) Study on the Chinese MSMEs Development in the Post-Epidemic Era[J].Academic Journal of Business & Management, 4(19):