


1. Introduction
Climate change has been a critical global concern for decades [1]. It refers to long-term shifts in temperatures, weather patterns, and changes to the Earth’s biological and physical systems [2]. Both natural factors and human activities contribute to this phenomenon, but human-induced greenhouse gas emissions are the primary drivers of global warming, leading to environmental degradation and health risks [3-4]. Major international bodies, such as the United Nations Framework Convention on Climate Change [5] and the Intergovernmental Panel on Climate Change [6], confirm this.
Despite a strong scientific consensus on climate change [7], public opinion remains divided, particularly in the U.S. Public figures like former U.S. President Donald Trump have publicly dismissed climate science, fueling skepticism [8]. Only 60% of U.S. adults express concern about climate change, compared to a median of 72% in other advanced economies [9]. As one of the largest greenhouse gas emitters, U.S. public attitudes significantly influence both domestic policy and global climate governance. Climate change denial spreads misinformation, distorts public understanding, and hinders policy implementation [10]. Denialists often cherry-pick data, emphasizing short-term cooling while ignoring long-term warming [11]. Given the U.S.’s substantial emissions and vulnerability to climate-related disasters, this is particularly concerning.
This study explores why significant portions of the U.S. population reject the link between human activities and climate change, despite scientific consensus. Denial remains widespread in certain regions, affecting national policy directions. For instance, U.S. withdrawal from the Paris Agreement weakened international cooperation and reduced aid to developing nations [12]. Conversely, stronger U.S. engagement could foster global climate commitments. Generational and regional divides further shape these perceptions. Millennials and Gen Z are more supportive of climate action—66% of Gen Z and 64% of Millennials advocate urgent measures—while older generations show less concern. Economic anxieties persist, with 40% of Americans fearing renewable energy transitions may harm the economy [13]. Regionally, belief in climate change varies; in 2014, only 63% of U.S. adults believed global warming was happening, with lower rates in the southeastern states [14].
This lack of consensus is troubling as the world risks exceeding the 1.5°C threshold, which could cause over 99% of coral reefs to disappear if warming surpasses 2°C . Denialism, driven by misinformation, ideology, and economic interests, undermines support for policies like carbon pricing and renewable energy investment [15-17]. If unaddressed, global warming will lead to more extreme weather events and biodiversity loss, threatening ecosystems and economies [18-19]. Although much research has examined the causes and consequences of climate change [20-21], fewer studies focus on public denial. Existing studies often rely on surveys from Western countries and overlook regional and cultural variations, as well as underrepresented groups like Indigenous communities in the U.S. [22].
Moreover, longitudinal analyses of evolving public perceptions remain limited. Most studies provide static snapshots without tracking long-term trends. To address these gaps, this study uses large-scale social media data to examine attitudes toward anthropogenic climate change in the U.S. While Twitter data may not represent all demographics, it offers valuable insights into public discourse, complementing traditional data [23]. By integrating digital trace data with state-level economic and demographic indicators, this research provides a novel analysis of the spatial and temporal dynamics of climate change denial. The study investigates two key questions: (1) Which U.S. states exhibit the highest levels of climate change denial on social media? (2) What factors—such as GDP per capita, gender, and temperature—explain why denial is more prevalent in certain states?
By answering these questions, this research offers insights into the socio-economic and demographic drivers of climate change denial, informing strategies to foster public support for effective climate policies.
2. Literature Review and Hypotheses Development
While previous studies have examined various aspects of climate change, they often fail to address the factors that influence people’s opinions on the issue. This study aims to fill this gap by exploring the roles of economic prosperity, gender, and temperature in shaping climate change beliefs.
2.1. GDP per Capita and Climate Change Denial
The first hypothesis in Research Question 2 posits that economically more prosperous states tend to have fewer climate change deniers. Higher levels of income and wealth are associated with a greater likelihood of residents believing that global warming is caused by human activities, such as CO₂ and methane emissions.
The most commonly used indicator of economic prosperity is the gross domestic product (GDP) per capita. GDP measures the value of all goods and services traded within a country (or American state) in a given year. When divided by the population of a country or state, GDP per capita provides a measure of the average income of the inhabitants of state i in year t (where i indicates the index of a state, and t indicates the time period, i.e., the year).
\( {GdpPerCapita_{i,t}}=\frac{GD{P_{i,t}}}{POPULATIO{N_{i,t}}} \)
Recent models, such as the computable general equilibrium (CGE) models, examine the relationship between GDP per capita and climate change impacts, predicting how climate change will affect global GDP [24]. However, these models have limitations, including dimensional constraints that lead to data aggregation and oversimplification, which may understate future climate impacts across countries.
Hypothesis 1: GDP per capita has an inverse relationship with the share of denier tweets.
2.2. Gender and Climate Change Denial
Efforts to address the gender gap in climate change discussions have focused on integrating gender into climate policies [25], increasing female representation in governance , and ensuring gender-sensitive approaches in climate finance [26]. Despite these efforts, progress remains hindered by inadequate gender mainstreaming, limited gender-specific data, and insufficient monitoring of gender-focused initiatives.
It is hypothesised that men are more likely to deny human-caused climate change than women. Women are generally more empathetic, detail-oriented, and aware of environmental consequences;[27], which makes them more likely to recognise the impacts of global warming.
Hypothesis 2: Compared to men, women tend to exhibit less denial of climate change.
2.3. Temperature and Climate Change Denial
Temperature, particularly its impact on foodborne illnesses, is an important factor in climate change research. Rising temperatures can lead to an increase in diseases such as salmonellosis and campylobacteriosis by promoting bacterial growth in food [28]. However, isolating temperature effects from other variables and predicting the long-term impact of climate change on foodborne illnesses remains difficult.
It is hypothesised that individuals living in states with relatively high temperatures are more likely to believe in the human impact on global warming. Experiencing high temperatures may raise awareness of the consequences of global warming, even if it does not directly lead individuals to interpret heat as evidence of climate change.
Hypothesis 3: Temperature has an inverse relationship with the share of denier tweets.
3. Data and Methods
3.1. Data Sources
This research uses a large-scale Twitter dataset containing web-scraped tweets on climate change, categorized into three groups: (a) belief in human-caused climate change, (b) belief in a non-human cause, and (c) neutral statements. Sentiment analysis was employed for classification. The tweets are geocoded to enable mapping by state, showing tweet counts per state.
Additionally, Python (version 3.11) was used for data cleaning and preprocessing, while R (version 4.3.1) supported data visualization and regression analysis.
3.2. Data-Wrangling Process
The dataset consists of 15,789,111 tweets from 2006 to 2019, with 56% originating from the United States [29]. A 5% random sample of U.S. tweets was selected for analysis. Missing values were addressed through reverse geocoding, and data on climate change deniers, gender, and temperatures were extracted.
State-level GDP per capita was determined using demographic and GDP data from 1997-2020, covering 51 states and territories [30]. Two population datasets were used: one for main U.S. states and another for additional territories. After cleaning and combining these datasets, GDP per capita was calculated for each state.
Finally, the data were merged, aggregating tweets by state and including GDP per capita as a variable. This prepared the data for descriptive and advanced statistical analyses, as detailed in the following sections.
3.3. Statistical Regression Models
To address the explanatory research question, ordinary least squares (OLS) regression and fixed-effects regression models (one-way and two-way) are used to estimate climate change deniers by state and track changes over time. The analysis begins with OLS regression and then incorporates fixed-effects methods for panel data.
OLS regression minimizes the squared distance between the estimated and actual values of the dependent variable. The dependent variable is the share of social media statements classified as climate change deniers, with the unit of analysis being the state level, covering 51 U.S. states. For each state, the percentage of climate change-denying tweets in a given year is used as the dependent variable in the regression.
Explanatory variables include GDP per capita, the share of female tweets, and the median temperature of each state. When analyzing the effect of one independent variable, other variables are held constant.
The OLS regression equation is as follows:
\( Shareofdeniertweets_{i}^{t}={β_{0}}+{β_{1}}GDPPerCapita_{i}^{t}+{β_{2}}Shareoffemaletweets_{i}^{t}+{β_{3}}LocalTemperature_{i}^{t}+ϵ_{i}^{t} \)
Next, a fixed-effects regression model is introduced to estimate whether climate change deniers in neighboring states affect the frequency of deniers in the focal state. The equations for the one-way and two-way fixed-effects models are as follows:
\( Shareofdeniertweets_{i}^{t}={β_{0}}+{β_{1}}GDPPerCapita_{i}^{t}+{β_{2}}Shareoffemaletweets_{i}^{t}+{β_{3}}Temperature_{i}^{t}+α_{i}+ν_{i}^{t} \)
\( Shareofdeniertweets_{i}^{t}={β_{0}}+{β_{1}}GDPPerCapita_{i}^{t}+{β_{2}}Shareoffemaletweets_{i}^{t}+{β_{3}}Temperature_{i}^{t}+α_{i}+τ_{t}+ν_{i}^{t} \)
In these equations, \( {β_{0}} \) is the intercept, and \( ϵ \) is the error term. \( {β_{1}} \) to \( {β_{3}} \) are the coefficients for the explanatory variables. The variable “t” represents each year (2009-2019), and “i” represents a specific state. 𝛼𝑖 denotes the state-specific fixed effect, such as the state’s unique culture and approach to environmental protection, which remains stable over time. 𝜏𝑡 represents time-specific effects shared across all states but varying by year, such as the impact of the 2008 financial crisis on state GDP per capita. Finally, 𝜈𝑖𝑡 is the error term in both fixed-effects models.
3.4. Descriptive Statistics
Table 1: Descriptive Statistics
Variable name | Variable type | Obs | Mean | Std.Dev. | Min | Max |
Share of denier tweets | Dependent variable | 561.0 | 13.50 | 9.80 | 0.00 | 72.00 |
Share of female tweets | Independent variable | 561.0 | 28.62 | 11.98 | 0.00 | 100.00 |
Median Temperature | lndependent variable | 558.0 | 1.03 | 1.93 | -7.05 | 8.26 |
GDP Per Capita | Independent variable | 561.0 | 57317.29 | 23955.82 | 32000.00 | 238000.00 |
The table presents the descriptive statistics for the variables in the analysis. The dependent variable, share of denier tweets, has 561 observations with a mean of 13.50 and a standard deviation of 9.80, reflecting variability in climate change responses. “GDP Per Capita” has a high mean of 57,317.29 and an extremely high standard deviation, indicating significant economic disparities among states. The wide range of values for each variable further highlights the diversity in the dataset.
3.5. Correlation Matrix
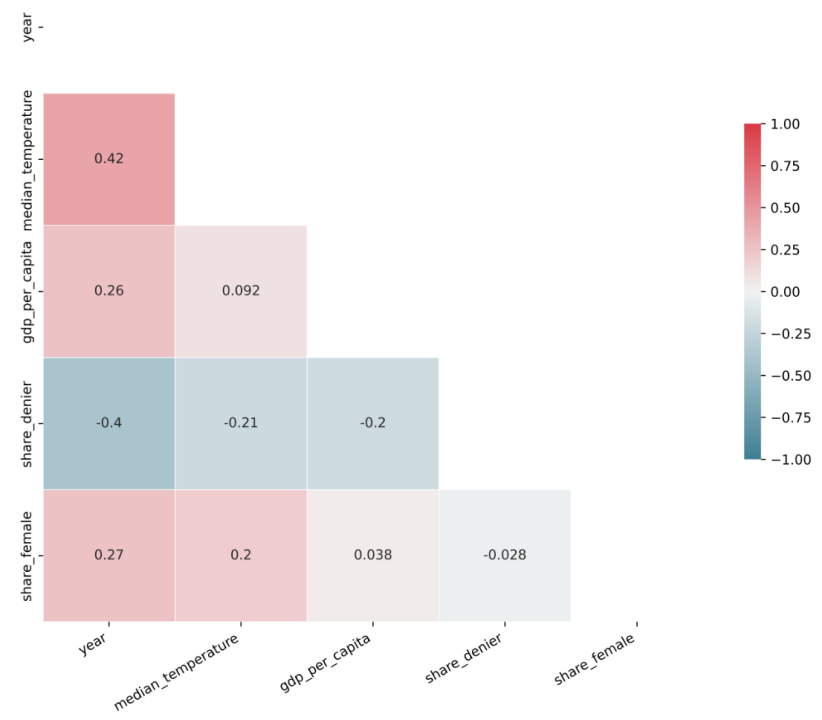
Figure 1: Correlation Heatmap of All Variables
The correlation matrix, based on Pearson’s correlation coefficient, reveals relationships between the independent and dependent variables. Median temperature and year have a positive correlation of 0.42, indicating a rise in temperatures over time. GDP per capita shows a moderate positive correlation with year (0.26) and a slight positive correlation with median temperature (0.092). The share of denier tweets has negative correlations with all variables, with the strongest negative correlation with year (-0.4), suggesting a decrease in denier tweets over time. It also negatively correlates with median temperature (-0.21) and GDP per capita (-0.2), emphasizing the need for fixed-effects regression models to account for temporal factors.
The share of female tweets has a positive correlation with year (0.27) and median temperature (0.2) but a small negative correlation with the share of denier tweets (-0.028), suggesting that changes in economic and environmental factors influence public opinion and demographics in social media discussions.
4. Results
4.1. Trends and Details of Relevant Variables
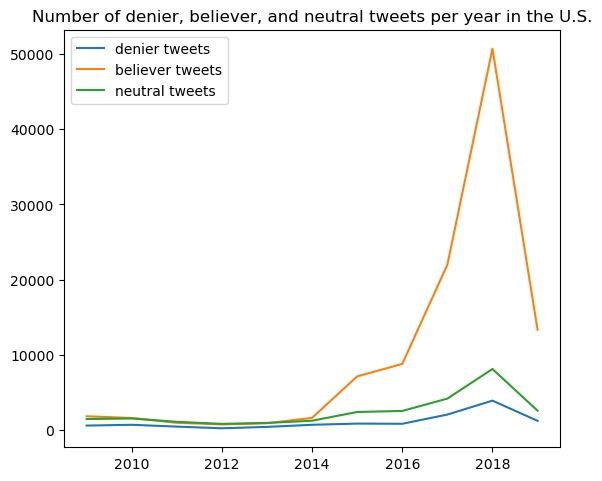
Figure 2: Number of Denier, Believer, and Neutral Tweets per Year in the United States (2009-2019)
Figure 2 presents the number of denier, believer, and neutral tweets per year within the U.S. dataset. From 2009 to 2014, the volume of tweets in all three categories—denial, belief, and neutrality—remained relatively low, averaging approximately 2,000 tweets annually. However, a noticeable increase occurred starting in 2014, with a significant spike in 2018, particularly in tweets expressing belief in human-caused climate change. After reaching this peak, the number of tweets in all categories subsequently declined, with the most significant decrease observed in tweets expressing belief.
|
|
|
|
|
|
|
|
|
| ||
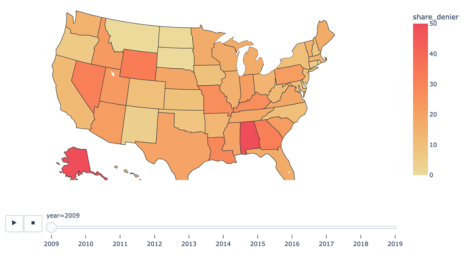
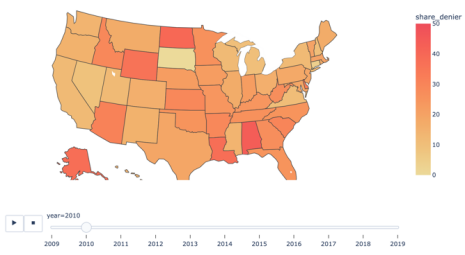
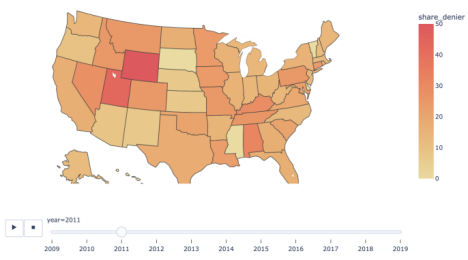
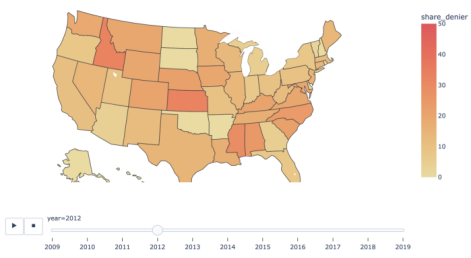
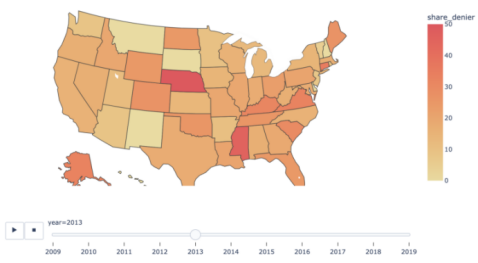
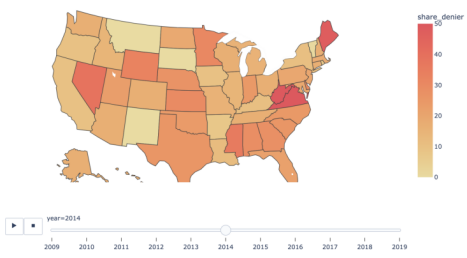
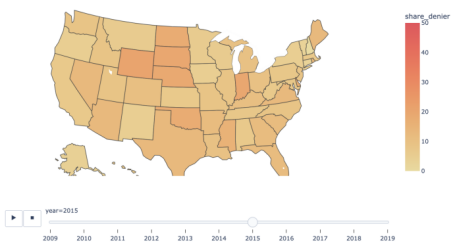
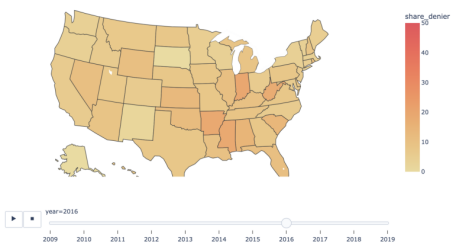
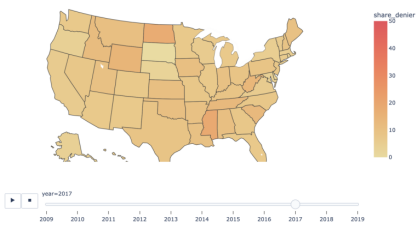
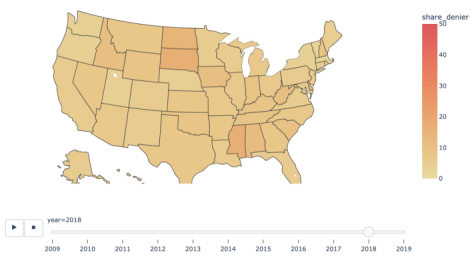
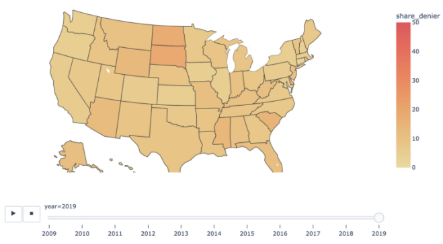
Figure 3: United States Map of Percent of Deniers in Each State (2009-2019)
Figure 3 illustrates the percentage of denier tweets across U.S. states from 2009 to 2019. The majority of states fell within the 0% to 50% range in terms of the proportion of denier tweets, with this range used for visualization purposes. An outlier, with an exceptionally high percentage of 70% denier tweets, was excluded from the analysis due to its extreme nature. A decreasing trend in denier tweets began around 2012, becoming more pronounced after 2014, corresponding with the increase in believer tweets. Geographically, the Midwest and South regions of the United States had the highest concentration of denier tweets, while the Northeast and Southwest regions consistently exhibited lower percentages, as indicated by lighter shades on the map.
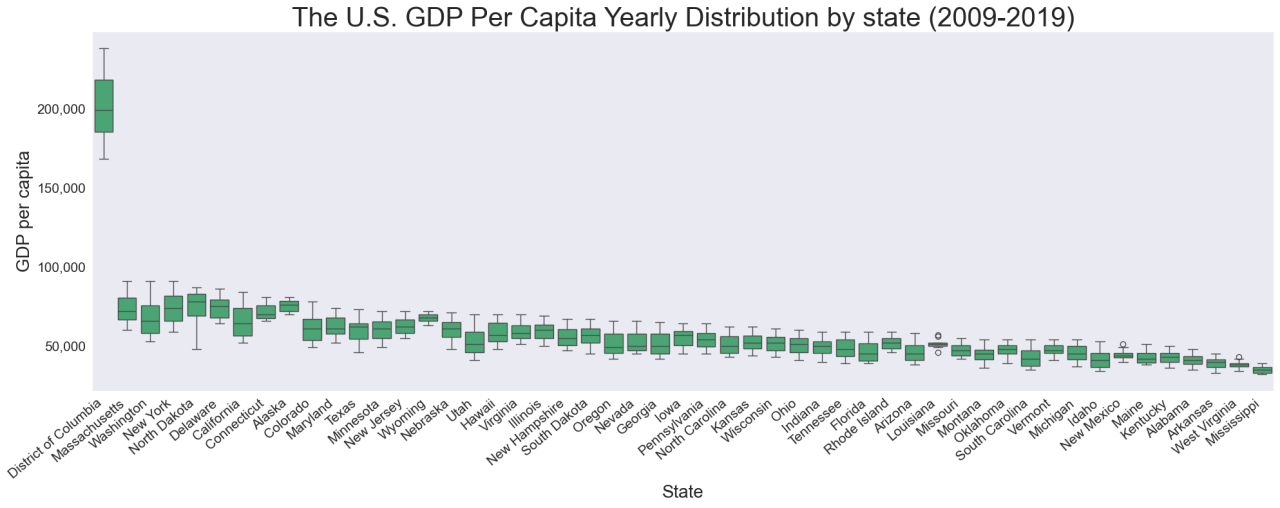
Figure 4: United States GDP per Capita Yearly Distribution by State (2009-2019)
Figure 4 displays the distribution of GDP per capita by state from 2009 to 2019, arranged in descending order from the highest to the lowest GDP per capita. The arrangement highlights a discernible decreasing trend, with significant variations in GDP per capita among states. The District of Columbia stands out with an extremely high GDP per capita, while states such as Massachusetts, North Dakota, and Utah also demonstrate relatively higher values. In contrast, states such as Alaska, Wyoming, and Louisiana exhibit lower GDP per capita during the analyzed period.
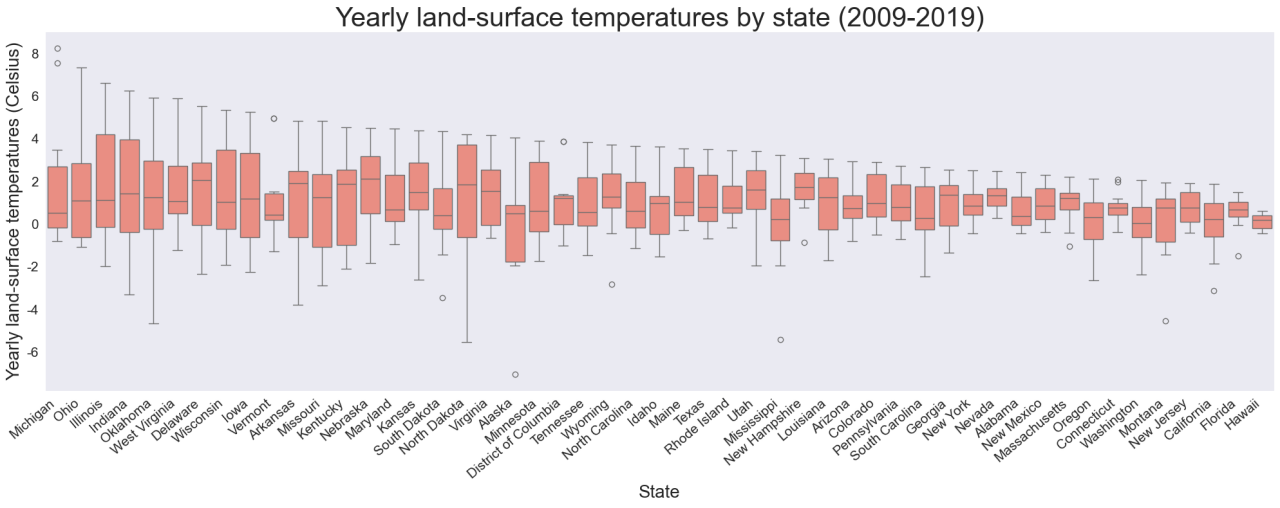
Figure 5: United States Yearly Land Temperature by State (2009-2019)
Figure 5 depicts the land-surface temperature distribution by state from 2009 to 2019, arranged in decreasing order of temperature range. Notable patterns emerge, with North Dakota exhibiting a surprisingly large temperature range relative to its geographical position, indicating significant climate fluctuations within the state. Conversely, Connecticut demonstrates a notably small temperature range compared to other states at similar latitudes, suggesting a more stable and consistent climate profile.
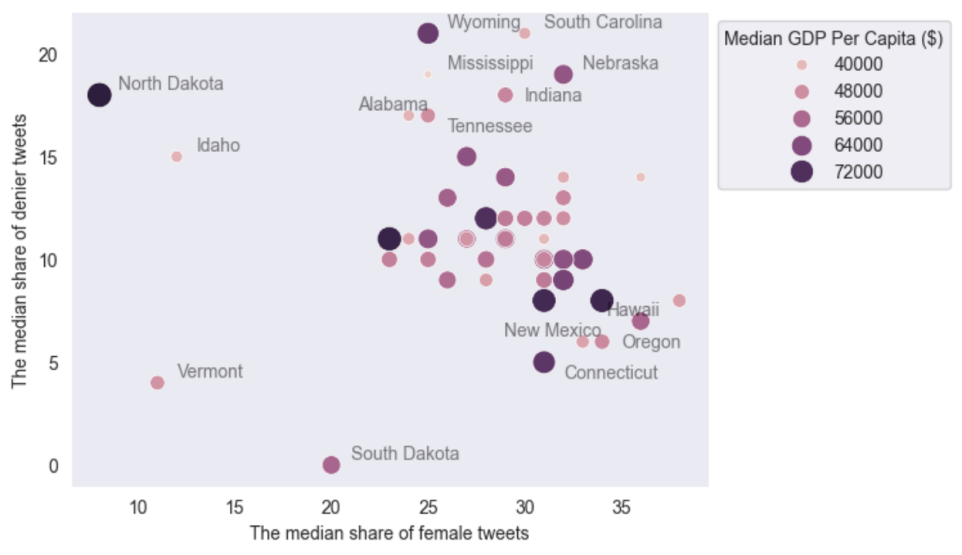
Figure 6: Scatter Plot Exhibiting Relationship Between the Median Share of Denier Tweets, Female Tweets, and GDP per Capita
Figure 6 presents a scatter plot displaying the share of female tweets, denier tweets, and GDP per capita. The District of Columbia has been excluded from this analysis due to its extreme GDP per capita value. The plot reveals that most states cluster within a specific range, with a higher share of female tweets (ranging from 22% to 35%) alongside a notable percentage of denier tweets (ranging from 5% to 23%). However, South Dakota deviates from this general trend, exhibiting lower proportions of both female and denier tweets compared to its neighboring states. In contrast, North Dakota has the lowest share of female tweets but one of the highest shares of denier tweets among the states analyzed.
4.2. Explanatory Results
Three regression models are employed to examine factors associated with the share of climate change deniers in each state: a pooled ordinary least squares (OLS) model and two fixed-effects models (one-way and two-way). The goal is to assess biases in the pooled OLS model and better understand the relationships between explanatory and outcome variables.
Given the panel data structure, the pooled OLS model treats observations as independent, ignoring both temporal and unmeasured within-state factors. This can lead to inaccurate results, as factors like local culture or geography may influence the outcome. A one-way fixed-effects model accounts for within-state heterogeneity, reducing bias from unmeasured factors. The two-way fixed-effects model captures both within-unit and time effects, which helps adjust for abrupt changes like those caused by the COVID-19 pandemic.
The analysis begins with a multivariate linear regression (pooled OLS) to test the relationship between the share of deniers and GDP per capita. Since states exhibit temporal correlations, the pooled OLS model fails to capture these dependencies across repeated observations (51 states over 11 years, totaling 558 state-year combinations).
Table 2: Regression Models of All Variables
Dependent variable: | |||
Share of denier tweets | |||
OLS | Fixed-effects models | ||
One-way | Two-way | ||
(1) | (2) | (3) | |
GDP Per Capita | -0.0001*** (0.00002) | -0.0004*** (0.0001) | 0.0002*(0.0001) |
Share of female tweets | -0.001 (0.034) | 0.056 (0.035) | 0.099*** (0.032) |
Median temperature | -0.967*** (0.211) | -0.770*** (0.210) | 0.178 (0.223) |
Constant | 18.822*** (1.392) | ||
Observations | 558 | 558 | 558 |
R² | 0.076 | 0.152 | 0.026 |
Adjusted R² | 0.071 | 0.062 | -0.098 |
Residual Std.Error | 9.419 (df=554) | 30.032*** (df =3;504) | 4.359*** (df =3;494) |
F Statistic | 15.141*** (df=3;554) | ||
Note: *p<0.1;**p<0.05;***p<0.01
The table presents the results from three regression models: the pooled OLS model and two fixed-effects models. The analysis starts with the OLS model, followed by the fixed-effects models.
In the pooled OLS regression, the coefficient for GDP per capita is negative and statistically significant, indicating that wealthier states tend to have lower shares of climate change deniers. This supports the hypothesis that wealthier states are more likely to accept human contributions to global warming. The coefficient is significant at the 1% level, rejecting the null hypothesis of no association between GDP per capita and climate change denial. Similarly, higher median temperatures are associated with lower shares of climate change deniers, with a statistically significant coefficient at the 1% level. However, the share of females in the population does not show a statistically significant relationship with the share of climate change deniers.
The F-test confirms the overall statistical significance of the model, but the low R-squared suggests that many variables are omitted and a substantial amount of variation remains unexplained. To address this, fixed-effects regression models are used to account for time-invariant state differences, reducing bias and providing a clearer view of the relationships between explanatory variables and the outcome.
Fixed-effects models control for unobserved state-level characteristics, such as geography or culture, that could influence climate change beliefs. These models offer a more accurate estimate of the effects of GDP per capita, temperature, and female tweet share by isolating these effects from potential confounders. The one-way model accounts for fixed effects within each state, while the two-way model controls for both state-specific and time-specific effects, capturing broader influences like economic downturns and policy changes.
In the fixed-effects models, a one-unit increase in GDP per capita is associated with a 0.0004 percentage point decrease in the share of denier tweets, a statistically significant result. While the coefficients for GDP per capita across all models are similar, the share of female tweets is statistically significant only in the pooled OLS model, suggesting its influence may be less robust. Fixed-effects models reveal a positive relationship between female tweet share and the share of climate change deniers, with states showing higher female tweet shares also exhibiting higher shares of denial.
Additionally, a 1°C increase in median local temperature is associated with a 0.77 percentage point decrease in the share of denier tweets, a significant effect in the fixed-effects models. Despite statistical significance, the low R-squared in the fixed-effects models suggests that much of the variation in climate change denial remains unexplained, with considerable differences in the magnitude and significance of regression coefficients across models.
5. Discussion
As shown in Figure 4, states with lower GDP per capita, such as Alaska and Wyoming, tend to have a higher share of denier tweets, while wealthier states like Massachusetts and Washington exhibit lower levels of denial. Both the pooled OLS and fixed-effects models in Table 1 confirm a statistically significant relationship between GDP per capita and denial. In the pooled OLS model, there is less than a 1% probability that the observed association is due to random variation. The one-way fixed-effects model shows that a unit increase in GDP per capita reduces the share of denier tweets by 0.0004 percentage points. However, the two-way fixed-effects model indicates a slight increase of 0.0002 percentage points, suggesting some sensitivity to model specification.
This trend reflects broader societal attitudes. For example, 86% of Massachusetts residents attribute past climate change to human activities [31], supporting the idea that economic prosperity may enhance public acceptance of anthropogenic climate change.
The relationship between gender and climate change denial is less consistent. Figure 6 shows that North Dakota, with the lowest share of female tweets, has a higher prevalence of denial, while South Dakota, with similarly low female tweet shares, exhibits lower denial rates. The correlation heatmap indicates a weak negative correlation between gender and denial. Only the pooled OLS model shows a statistically significant association, though there is more than a 10% chance that this relationship is random. After controlling for fixed effects, the gender effect diminishes, suggesting that gender does not play a decisive role in shaping beliefs about climate change. This aligns with findings from the Yale Program on Climate Change Communication, which reports that women are only slightly more concerned about the environment than men [32].
Figures 3 and 5 present contrasting patterns between land temperature and climate denial. North Dakota, with its wide temperature range, shows higher denial rates compared to Connecticut, which experiences less variation. The correlation heatmap reveals a weak negative correlation between temperature range and denial. Nevertheless, both the pooled OLS and fixed-effects models show statistically significant results. The pooled OLS model indicates less than a 1% chance that the relationship is random. The one-way fixed-effects model suggests that a 1°C increase in local temperature corresponds to a 0.77 percentage point decrease in denial, while the two-way model shows a 0.178 percentage point increase.
These findings imply that higher temperatures and greater variability may influence personal experience and beliefs, reducing denial in some contexts but not all. This aligns with research from the University of Oxford, which highlights how individuals’ beliefs about climate change are shaped by direct experiences with local weather [33].
6. Conclusion
This study demonstrates that U.S. states with higher incomes tend to have a greater proportion of social media posts expressing belief in man-made climate change. Specifically, the analysis reveals that states with higher GDP per capita show a higher share of social media statements (i.e., tweets) affirming the causal impact of human activities on global warming.
The results suggest that higher state income is linked to a greater likelihood of residents believing that climate change is driven by human activities, such as greenhouse gas emissions, rather than being caused solely by natural factors. The study does not attempt to quantify the exact extent of human influence on global warming, as this has been extensively studied elsewhere. Instead, the focus is on identifying factors that influence individuals’ likelihood of recognizing the connection between human greenhouse gas emissions and global warming.
In addition to income, the temperature experienced in a state appears to influence beliefs about climate change. States experiencing higher temperatures tend to show higher shares of social media posts supporting the view that climate change is human-made. This suggests that personal experiences, such as extreme weather events or temperature fluctuations, may play a significant role in shaping beliefs about global warming.
Belief formation regarding global warming may be more strongly influenced by personal experiences than by exposure to scientific evidence alone. Future research could explore the extent to which individuals are exposed to scientific information compared to other sources, and whether individuals in regions with frequent extreme weather events are more likely to accept the human-made climate change narrative. These areas provide potential avenues for further investigation into the factors influencing belief formation about global warming.
For future research, expanding the sample size could enhance the study. Analyzing only five percent of the sample may not fully capture the diversity of opinions, and increasing the sample size to ten percent would offer a more representative view. Additionally, examining variables such as political affiliation and familial or social influences could help address potential endogeneity issues. Finally, focusing on causal relationships rather than just associations would strengthen the robustness of the findings.
References
[1]. Sathaye J, Shukla PR, Ravindranath NH. Climate change, sustainable development and India: global and national concerns. Curr Sci. 2006;90(3):314-25. Available from: http://www.jstor.org/stable/24091865
[2]. Werndl C. On defining climate and climate change. Br J Philos Sci. 2016;67(2):337-64. doi:10.1093/bjps/axu048
[3]. Wigley TML, Jones PD, Raper SCB. The observed global warming record: what does it tell us? Proc Natl Acad Sci U S A. 1997;94(16):8314-20.
[4]. Weber EU. What shapes perceptions of climate change? Wiley Interdiscip Rev Clim Change. 2010;1(3):332-42. doi:10.1002/wcc.41
[5]. Bodansky D. The United Nations Framework Convention on Climate Change: a commentary. Yale J Int Law. 1993;18:451-558.
[6]. Agrawala S. Context and early origins of the Intergovernmental Panel on Climate Change. Clim Change. 1998;39:605-20. doi:10.1023/a:1005312331477
[7]. Cook J, Oreskes N, Doran PT, Anderegg WR, Verheggen B, Maibach EW, et al. Consensus on consensus: a synthesis of consensus estimates on human-caused global warming. Environ Res Lett. 2016;11(4):048002.
[8]. Dawsey J, Rucker P, Dennis B, Mooney C. Trump on climate change: ‘People like myself, we have very high levels of intelligence but we’re not necessarily such believers.’ The Washington Post [Internet]. 2018 Nov 27 [cited 2025 Mar 16]. Available from: https://www.washingtonpost.com/politics/trump-on-climate-change-people-like-myself-we-have-very-high-levels-of-intelligence-but-were-not-necessarily-such-believers/2018/11/27/722f0184-f27e-11e8-aeea-b85fd44449f5_story.html
[9]. Poushter J, Fagan M, Huang C. Americans are less concerned – but more divided – on climate change than people elsewhere. Washington, DC: Pew Research Center; 2021.
[10]. Treen KM, Williams HT, O’Neill SJ. Online misinformation about climate change. Wiley Interdiscip Rev Clim Change. 2020;11(5):e665.
[11]. Cook J, Nuccitelli D, Green SA, Richardson M, Winkler B, Painting R, et al. Quantifying the consensus on anthropogenic global warming in the scientific literature. Environ Res Lett. 2013;8(2):024024. doi:10.1088/1748-9326/8/2/024024
[12]. Zhang H, Dai H, Lai H, Wang W. U.S. withdrawal from the Paris Agreement: reasons, impacts, and China’s response. Adv Clim Change Res. 2017;8(4):220-5. doi:10.1016/j.accre.2017.09.002
[13]. ]Funk C. Key findings: how Americans’ attitudes about climate change differ by generation, party and other factors [Internet]. Washington, DC: Pew Research Center; 2021 May 26 [cited 2025 Mar 16].
[14]. Dempsey C. Tracking public perception about climate change [Internet]. Geography Realm; 2015 Apr 14 [cited 2025 Mar 16]. Available from: https://www.geographyrealm.com/tracking-public-perception-about-climate-change/
[15]. McCright AM, Dunlap RE. The politicization of climate change and polarization in the American public’s views of global warming, 2001–2010. Sociol Q. 2011;52(2):155-194. doi:10.1111/j.1533-8525.2011.01198.x
[16]. Lübke C. Socioeconomic roots of climate change denial and uncertainty among the European population. Eur Sociol Rev. 2022;38(1):153-168.
[17]. Khatibi FS, Dedekorkut-Howes A, Howes M, Torabi E. Can public awareness, knowledge and engagement improve climate change adaptation policies? Discov Sustain. 2021;2:1-24.
[18]. Tol RS. Correction and update: the economic effects of climate change. J Econ Perspect. 2014;28(2):221-226. doi:10.1257/jep.28.2.221
[19]. Bellard C, Bertelsmeier C, Leadley P, Thuiller W, Courchamp F. Impacts of climate change on the future of biodiversity. Ecol Lett. 2012;15(4):365-377. doi:10.1111/j.1461-0248.2011.01736.x
[20]. Hardy JT. Climate change: causes, effects, and solutions. Chichester (UK): Wiley; 2006.
[21]. Paavola J. Health impacts of climate change and health and social inequalities in the UK. Environ Health. 2017;16(S1). doi:10.1186/s12940-017-0328-z
[22]. Yu H, Wang B, Zhang YJ, Wang S, Wei YM. Public perception of climate change in China: results from the questionnaire survey. Nat Hazards. 2013;69(1):459-472. doi:10.1007/s11069-013-0711-1
[23]. Lazer D, Pentland A, Adamic L, Aral S, Barabási AL, Brewer D, et al. Computational social science. Science. 2009;323(5915):721-723. doi:10.1126/science.1167742
[24]. Kompas T, Pham VH, Che TN. The effects of climate change on GDP by country and the global economic gains from complying with the Paris Climate Accord. Earth S Future. 2018;6(8):1153-1173. doi:10.1029/2018ef000922
[25]. Alston M. Gender mainstreaming and climate change. Womens Stud Int Forum. 2014;47:287-294. doi:10.1016/j.wsif.2013.01.016
[26]. Schalatek L. Gender and climate finance: double mainstreaming for sustainable development. Berlin: Heinrich Böll Foundation; 2009.
[27]. Mostafa MM. Gender differences in Egyptian consumers’ green purchase behaviour: the effects of environmental knowledge, concern and attitude. Int J Consum Stud. 2006;31(3):220-229. doi:10.1111/j.1470-6431.2006.00523.x
[28]. Lake IR, Gillespie IA, Bentham G, Nichols GL, Lane C, Adak GK, Threlfall EJ. A re-evaluation of the impact of temperature and climate change on foodborne illness. Epidemiol Infect. 2009;137(11):1538-1547. doi:10.1017/s0950268809002477
[29]. Effrosynidis D, Karasakalidis AI, Sylaios G, Arampatzis A. The climate change twitter dataset. Expert Syst Appl. 2022;204:117541. doi:10.1016/j.eswa.2022.117541
[30]. Roberts D. US GDP by state 1997-2020. Kaggle. 2021 Jun 19. Available from: https://www.kaggle.com/datasets/davidbroberts/us-gdp-by-state-19972020
[31]. McDonald J, Maclnnis B, Krosnick JA. Climate insights 2020: Opinion in the States. Resources for the Future. 2020 Oct 26. Available from: https://www.rff.org/publications/reports/climateinsights2020-opinion-in-the-states/
[32]. Ballew M, Marlon J, Leiserowitz A, Maibach E. Gender differences in public understanding of climate change. Yale Program on Climate Change Communication. 2018 Dec 12. Available from: https://climatecommunication.yale.edu/publications/gender-differences-in-public-understanding-of-climate-change/#:~:text=A%20large%20body%20of%20research, pro%2Dclimate%20opinions%20and%20beliefs
[33]. Belief in climate change was found to be influenced by the local weather. University of Oxford. 2016 Dec 21. Available from: https://www.ox.ac.uk/news/2016-12-21-belief-climate-change-found-be-influenced-local-weather#:~:text=‘A%20belief%20in%20global%20climate, the%20Oxford%20Martin%20School%20at
Cite this article
Huang,K. (2025). Explaining Opinion Dynamics in Online Social Media: A Comparison of Attitudes Toward Climate Change Across U.S. States. Advances in Economics, Management and Political Sciences,175,1-13.
Data availability
The datasets used and/or analyzed during the current study will be available from the authors upon reasonable request.
Disclaimer/Publisher's Note
The statements, opinions and data contained in all publications are solely those of the individual author(s) and contributor(s) and not of EWA Publishing and/or the editor(s). EWA Publishing and/or the editor(s) disclaim responsibility for any injury to people or property resulting from any ideas, methods, instructions or products referred to in the content.
About volume
Volume title: Proceedings of the 4th International Conference on Business and Policy Studies
© 2024 by the author(s). Licensee EWA Publishing, Oxford, UK. This article is an open access article distributed under the terms and
conditions of the Creative Commons Attribution (CC BY) license. Authors who
publish this series agree to the following terms:
1. Authors retain copyright and grant the series right of first publication with the work simultaneously licensed under a Creative Commons
Attribution License that allows others to share the work with an acknowledgment of the work's authorship and initial publication in this
series.
2. Authors are able to enter into separate, additional contractual arrangements for the non-exclusive distribution of the series's published
version of the work (e.g., post it to an institutional repository or publish it in a book), with an acknowledgment of its initial
publication in this series.
3. Authors are permitted and encouraged to post their work online (e.g., in institutional repositories or on their website) prior to and
during the submission process, as it can lead to productive exchanges, as well as earlier and greater citation of published work (See
Open access policy for details).
References
[1]. Sathaye J, Shukla PR, Ravindranath NH. Climate change, sustainable development and India: global and national concerns. Curr Sci. 2006;90(3):314-25. Available from: http://www.jstor.org/stable/24091865
[2]. Werndl C. On defining climate and climate change. Br J Philos Sci. 2016;67(2):337-64. doi:10.1093/bjps/axu048
[3]. Wigley TML, Jones PD, Raper SCB. The observed global warming record: what does it tell us? Proc Natl Acad Sci U S A. 1997;94(16):8314-20.
[4]. Weber EU. What shapes perceptions of climate change? Wiley Interdiscip Rev Clim Change. 2010;1(3):332-42. doi:10.1002/wcc.41
[5]. Bodansky D. The United Nations Framework Convention on Climate Change: a commentary. Yale J Int Law. 1993;18:451-558.
[6]. Agrawala S. Context and early origins of the Intergovernmental Panel on Climate Change. Clim Change. 1998;39:605-20. doi:10.1023/a:1005312331477
[7]. Cook J, Oreskes N, Doran PT, Anderegg WR, Verheggen B, Maibach EW, et al. Consensus on consensus: a synthesis of consensus estimates on human-caused global warming. Environ Res Lett. 2016;11(4):048002.
[8]. Dawsey J, Rucker P, Dennis B, Mooney C. Trump on climate change: ‘People like myself, we have very high levels of intelligence but we’re not necessarily such believers.’ The Washington Post [Internet]. 2018 Nov 27 [cited 2025 Mar 16]. Available from: https://www.washingtonpost.com/politics/trump-on-climate-change-people-like-myself-we-have-very-high-levels-of-intelligence-but-were-not-necessarily-such-believers/2018/11/27/722f0184-f27e-11e8-aeea-b85fd44449f5_story.html
[9]. Poushter J, Fagan M, Huang C. Americans are less concerned – but more divided – on climate change than people elsewhere. Washington, DC: Pew Research Center; 2021.
[10]. Treen KM, Williams HT, O’Neill SJ. Online misinformation about climate change. Wiley Interdiscip Rev Clim Change. 2020;11(5):e665.
[11]. Cook J, Nuccitelli D, Green SA, Richardson M, Winkler B, Painting R, et al. Quantifying the consensus on anthropogenic global warming in the scientific literature. Environ Res Lett. 2013;8(2):024024. doi:10.1088/1748-9326/8/2/024024
[12]. Zhang H, Dai H, Lai H, Wang W. U.S. withdrawal from the Paris Agreement: reasons, impacts, and China’s response. Adv Clim Change Res. 2017;8(4):220-5. doi:10.1016/j.accre.2017.09.002
[13]. ]Funk C. Key findings: how Americans’ attitudes about climate change differ by generation, party and other factors [Internet]. Washington, DC: Pew Research Center; 2021 May 26 [cited 2025 Mar 16].
[14]. Dempsey C. Tracking public perception about climate change [Internet]. Geography Realm; 2015 Apr 14 [cited 2025 Mar 16]. Available from: https://www.geographyrealm.com/tracking-public-perception-about-climate-change/
[15]. McCright AM, Dunlap RE. The politicization of climate change and polarization in the American public’s views of global warming, 2001–2010. Sociol Q. 2011;52(2):155-194. doi:10.1111/j.1533-8525.2011.01198.x
[16]. Lübke C. Socioeconomic roots of climate change denial and uncertainty among the European population. Eur Sociol Rev. 2022;38(1):153-168.
[17]. Khatibi FS, Dedekorkut-Howes A, Howes M, Torabi E. Can public awareness, knowledge and engagement improve climate change adaptation policies? Discov Sustain. 2021;2:1-24.
[18]. Tol RS. Correction and update: the economic effects of climate change. J Econ Perspect. 2014;28(2):221-226. doi:10.1257/jep.28.2.221
[19]. Bellard C, Bertelsmeier C, Leadley P, Thuiller W, Courchamp F. Impacts of climate change on the future of biodiversity. Ecol Lett. 2012;15(4):365-377. doi:10.1111/j.1461-0248.2011.01736.x
[20]. Hardy JT. Climate change: causes, effects, and solutions. Chichester (UK): Wiley; 2006.
[21]. Paavola J. Health impacts of climate change and health and social inequalities in the UK. Environ Health. 2017;16(S1). doi:10.1186/s12940-017-0328-z
[22]. Yu H, Wang B, Zhang YJ, Wang S, Wei YM. Public perception of climate change in China: results from the questionnaire survey. Nat Hazards. 2013;69(1):459-472. doi:10.1007/s11069-013-0711-1
[23]. Lazer D, Pentland A, Adamic L, Aral S, Barabási AL, Brewer D, et al. Computational social science. Science. 2009;323(5915):721-723. doi:10.1126/science.1167742
[24]. Kompas T, Pham VH, Che TN. The effects of climate change on GDP by country and the global economic gains from complying with the Paris Climate Accord. Earth S Future. 2018;6(8):1153-1173. doi:10.1029/2018ef000922
[25]. Alston M. Gender mainstreaming and climate change. Womens Stud Int Forum. 2014;47:287-294. doi:10.1016/j.wsif.2013.01.016
[26]. Schalatek L. Gender and climate finance: double mainstreaming for sustainable development. Berlin: Heinrich Böll Foundation; 2009.
[27]. Mostafa MM. Gender differences in Egyptian consumers’ green purchase behaviour: the effects of environmental knowledge, concern and attitude. Int J Consum Stud. 2006;31(3):220-229. doi:10.1111/j.1470-6431.2006.00523.x
[28]. Lake IR, Gillespie IA, Bentham G, Nichols GL, Lane C, Adak GK, Threlfall EJ. A re-evaluation of the impact of temperature and climate change on foodborne illness. Epidemiol Infect. 2009;137(11):1538-1547. doi:10.1017/s0950268809002477
[29]. Effrosynidis D, Karasakalidis AI, Sylaios G, Arampatzis A. The climate change twitter dataset. Expert Syst Appl. 2022;204:117541. doi:10.1016/j.eswa.2022.117541
[30]. Roberts D. US GDP by state 1997-2020. Kaggle. 2021 Jun 19. Available from: https://www.kaggle.com/datasets/davidbroberts/us-gdp-by-state-19972020
[31]. McDonald J, Maclnnis B, Krosnick JA. Climate insights 2020: Opinion in the States. Resources for the Future. 2020 Oct 26. Available from: https://www.rff.org/publications/reports/climateinsights2020-opinion-in-the-states/
[32]. Ballew M, Marlon J, Leiserowitz A, Maibach E. Gender differences in public understanding of climate change. Yale Program on Climate Change Communication. 2018 Dec 12. Available from: https://climatecommunication.yale.edu/publications/gender-differences-in-public-understanding-of-climate-change/#:~:text=A%20large%20body%20of%20research, pro%2Dclimate%20opinions%20and%20beliefs
[33]. Belief in climate change was found to be influenced by the local weather. University of Oxford. 2016 Dec 21. Available from: https://www.ox.ac.uk/news/2016-12-21-belief-climate-change-found-be-influenced-local-weather#:~:text=‘A%20belief%20in%20global%20climate, the%20Oxford%20Martin%20School%20at