


1. Introduction
An economic recession is generally characterized by a significant and widespread decline in economic activity that persists for several months. Key indicators of a recession include reductions in GDP, income, employment, industrial production, and retail sales. During such periods, consumer spending, business investment, and overall economic confidence typically diminish, further exacerbating the downturn.
The COVID-19 pandemic triggered one of the most severe global economic crises since the Great Depression, causing unprecedented levels of uncertainty and disruption across various sectors. The pandemic's far-reaching effects have been extensively studied, revealing profound impacts on economic activity, labor markets, and consumer behavior. Several key studies have shed light on these dynamics, we will talk about it in the Related Paperwork section below.
This paper will build on these insights to further explore the economic repercussions of the COVID-19 pandemic, offering a comprehensive analysis of its impact and proposing targeted policy measures to address the ongoing challenges. The following sections will explore the key findings, methodologies, and implications of these studies, offering an in-depth analysis of the pandemic's economic impact and potential recovery strategies.
2. Related Paperwork
2.1. COVID-Induced Economic Uncertainty
This paper explores the economic impact of the COVID-19 pandemic, focusing on the surge in uncertainty it brought about. The authors—Scott Baker, Nicholas Bloom, Steven Davis, and Stephen Terry—highlight the unprecedented speed and scale of the crisis and outline three primary indicators for measuring real-time uncertainty: stock market volatility (such as the VIX), newspaper-based economic uncertainty indices, and business expectation surveys.
They demonstrate how these measures can quantify the uncertainty stemming from COVID-19 and project potential macroeconomic impacts, such as an estimated 11% year-on-year contraction in the U.S. GDP by the fourth quarter of 2020.[1] About half of this projected decline is attributed to uncertainty alone, illustrating the significant indirect economic consequences of the pandemic beyond immediate demand or supply shocks.
2.2. The Economic Impacts of COVID-19: Evidence from a New Public Database Built Using Private Sector Data
Written by Raj Chetty, John N. Friedman, Nathaniel Hendren, Michael Stepner, and the Opportunity Insights Team, this paper introduces a real-time database using private data sources—such as credit card spending, payroll records, and job postings—to track economic activity by geography, industry, and income. The authors compiled anonymized data on key indicators like consumer spending, business revenues, and employment, disaggregated by ZIP code, industry, and demographic segments, applying privacy protocols, data cleaning, and validation against public benchmarks [2].
Findings reveal that high-income individuals sharply reduced spending in sectors requiring in-person interaction, leading to significant revenue drops for small businesses in affluent areas and persistent job losses for low-wage workers there. Instead of relying on expert advice, consumers increasingly turn to fellow customers when choosing among products, a trend facilitated by the emergence of social media and the associated creation and consumption of user-generated content , for instance, finds that 82% of US Internet consumers report to be directly influenced by peer reviews in their purchasing decisions.[3] The study suggests that direct financial support, such as extended unemployment benefits, may be more effective than traditional stimulus during health crises and demonstrates the utility of private-sector data for real-time economic monitoring and policy evaluation.
2.3. COVID-19 and The Macroeconomic Effects of Costly Disasters
Written by Sydney Ludvigson, Sai Ma, and Serena Ng, this study investigates the broader economic impacts of large-scale disasters, focusing on the COVID-19 pandemic as a prolonged, global, multi-sector disruption unlike typical, localized natural disasters like hurricanes or earthquakes. While such events typically produce short-term local economic impacts, COVID-19 has simultaneously disrupted global markets, labor, and production for an extended period. Leveraging 40 years of historical U.S. disaster data, the authors develop a "costly disaster" (CD) series to quantify the pandemic's economic damage. Using a vector autoregression (VAR) model, they predict COVID-19's impact across sectors, assessing industrial production, service employment, unemployment claims, and flight departures based on prolonged relief costs and lockdown durations.
Key findings include an estimated 20% decline in industrial production over 12 months, potential 39% job losses in service employment impacting up to 55 million jobs, an unprecedented rise in unemployment claims, and a significant, sustained drop in flight departures, signaling broader declines in travel and tourism.[4] The study highlights those longer shocks delay recovery and emphasizes the necessity of sustained policy support and targeted aid to stabilize affected sectors, suggesting that pandemic-driven disruptions could influence labor markets and business operations well beyond the immediate crisis.
2.4. Macroeconomic Forecasting in the Time of COVID-19
Written by Giorgio E. Primiceri and Andrea Tambalotti, this paper presents a forecasting model for the economic impact of COVID-19 in the United States, highlighting the unique assumptions needed to predict such an unprecedented shock. The authors note that COVID-19 challenges standard economic models, requiring scenario-based assumptions beyond typical disruptions. By synthesizing COVID-19 as an exogenous shock within macroeconomic frameworks, the authors use historical data combined with projections of the virus's spread and economic impacts. They develop three forecasting scenarios: a baseline where the pandemic fades by late 2020, an optimistic scenario ending by September 2020, and a pessimistic scenario with a second wave peaking in early 2021.
Findings indicate significant economic decline: in the baseline, employment falls by over 20% with a slow, multi-year recovery; consumption and industrial production sharply drop and remain below pre-COVID levels across scenarios; unemployment peaks at over 20% in the baseline, with prolonged high rates in the pessimistic scenario; and inflation remains muted, with core PCE inflation temporarily turning negative due to demand-side constraints.[5] This analysis underscores that economic recovery depends heavily on the pandemic's trajectory, suggesting policy actions to stabilize demand and support labor markets are essential for a robust recovery.
2.5. Discussion
The COVID-19 pandemic triggered an unprecedented surge in economic uncertainty, measured through indicators such as stock market volatility, media coverage, and business surveys, which significantly contributed to economic contraction. Projections indicated substantial declines in GDP, employment, and industrial production, with one study estimating an 11% year-on-year contraction in U.S. GDP by late 2020, half of which was attributed to uncertainty alone.
The studies emphasize the need for sustained and targeted policy measures to stabilize affected sectors and labor markets, particularly given the prolonged nature of the crisis. Additionally, the pandemic underscored the importance of real-time data, such as credit card spending and payroll records, for monitoring economic activity and evaluating policy effectiveness. However, forecasting the economic trajectory of COVID-19 required scenario-based assumptions due to the unprecedented nature of the shock, with recovery heavily dependent on the pandemic's course.
3. Data and Correlation Analysis
The correlation analysis presented in the document examines the relationship between economic mobility data and COVID-19 case data in the United States. The economic mobility data, sourced from indicators such as retail and recreation, grocery and pharmacy, parks, transit stations, workplaces, and residential activity, reflects changes in mobility patterns compared to a pre-pandemic baseline. These mobility metrics are derived from anonymized location data, and provide insights into how people's movement and economic activities have shifted in response to the pandemic. On the other hand, the COVID-19 case data represents daily confirmed cases, which serve as a proxy for the spread of the virus.
Over time, the economic mobility data shows fluctuations in activity across different sectors. For example, retail and recreation, transit stations, and workplaces experienced declines in activity, reflecting reduced public interaction and shifts to remote work during the pandemic. Conversely, residential activity increased as people spent more time at home. These trends reflect public health interventions, including lockdowns, social distancing, and remote work policies, aimed at controlling the spread of COVID-19.
The correlation analysis was conducted by plotting daily confirmed COVID-19 cases against percent changes in mobility from the baseline for each sector. The results reveal mostly weak relationships between mobility and case counts. For instance:
1. Retail and recreation showed a weak negative correlation, suggesting that as mobility in these areas decreased, there was a slight reduction in cases, though the relationship was not strong.
2. Grocery and pharmacy exhibited a weak positive correlation, indicating a slight increase in cases with higher mobility, but the trend was not pronounced.
3. Parks also showed a weak positive correlation, with a small increase in cases as park activity rose, though the data points were widely dispersed.
4. Transit stations and workplaces both displayed weak negative correlations, implying that reduced activity in these areas slightly coincided with fewer cases, but the relationships were not robust.
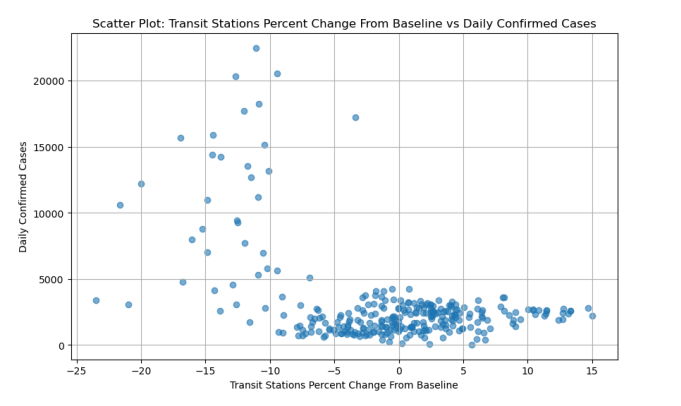
Figure 1: Transit Stations Percent Change from Baseline VS Daily Confirmed Cases
In conclusion, the analysis indicates that while certain trends between mobility and COVID-19 cases can be observed, the relationships are generally weak and not clearly defined. This may show up the complex interaction of various factors affecting case numbers, such as public health measures, vaccination rates, and changes in behavior, which mobility data cannot fully account for. The findings underestimate the difficulty in making definitive conclusions about the direct influence of mobility on the spread of COVID-19, highlighting the importance of detailed analyses that incorporate additional variables.
4. Predictive models
4.1. Variables
The dataset used in this analysis contains annual economic and financial data from 1984 to 2023 including key variables as:
5. GDP (Billions of USD), also treated as target variable.
6. Unemployment Rate (%), which affects GDP by reducing consumer spending, labor productivity, and business investment, as fewer people earning income leads to lower demand and underutilized resources.
7. Housing Price Index & Producer Price Index (PPI), which are indicators of the housing market's health and production costs.
8. Population (Millions), which affects GDP in shaping economic activity, as a larger population generally leads to increased consumption and production levels.
9. Stock Market Capitalization, which represents the total valuation of companies, serving as a gauge of investor confidence and economic stability.
10. 1-Year Treasury Rate (%) & Corporate Bonds Spread (%), which influence investment decisions and economic growth.
11. Net Exports (USD Billions), which contribute to GDP by reflecting the trade balance.
12. Savings Rate (%), which measures the portion of income saved rather than spent, influences consumption behavior.
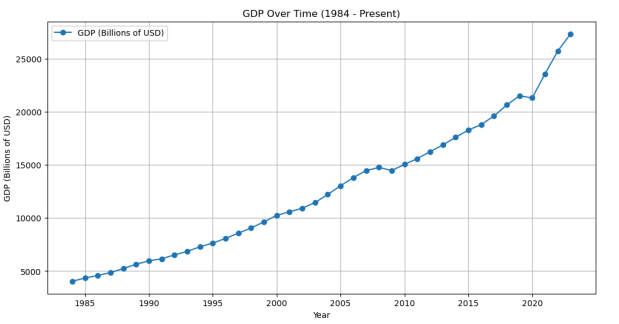
Figure 2: GDP between 1984 to present
Based on their information regression scores, which measure the dependency between each feature and the target variable, GDP, the top 8 features, including Population (Millions), Housing Price Index, PPI, Net Exports, 1-Year Treasury Rate, Savings Rate, Corporate Bonds Spread, and Stock Market Cap, was selected. These variables will be used in the following analysis with chosen models.
4.2. Models
Several models were employed to forecast GDP, the target variable. First, the data was split into a 70:30 ratio for the training and testing set, and the model was trained on the training data to forecast GDP for the testing period. The first model used was the Vector Autoregression Model (VAR Model). This is a statistical model to capture linear interdependencies among multiple time series variables. It works by predicting each variable based on its own historical values as well as the past values of other related variables in the system. This model is an effective one for analyzing linear relationships and dependencies among variables over time, which is widely used for studying time series data. By using Granger causality tests, GDP, Unemployment Rate, Housing Price Index, and Savings Rate were selected as the key variables for the VAR model. RMSE (Root Mean Squared Error) and MAE (Mean Absolute Error) were used for the model’s performance.
Besides the VAR model, there are also several machine learning models applied in this task. These included:
13. Support Vector Regression (SVR), which is an adaptation of the support vector machine algorithm for regression. It aims to find the hyperplane that best fits the data while providing a certain margin of error.
14. Decision Tree Regressor, which is a tree-based model that divides data into branches based on the values of input features,with each division creating a structure of decisions.
15. XGBoost, which is a boosting algorithm that sequentially builds decision trees. It focuses on correcting errors in each new tree from the previous ones, and incorporating regularization techniques to prevent overfitting.
16. LightGBM, which is another boosting algorithm similar to XGBoost but optimized for speed and efficiency, leading to fast training times by using a growth strategy.
17. Long Short-Term Memory (LSTM), which is a specialized type of recurrent neural network (RNN) designed to work with sequential data, allowing information to be stored or deleted for long periods of time.
For all models mentioned above, all variables except year and GDP were used as features and the top 8 features were selected using SelectKBest and mutual information regression. Each model was trained on the scaled training data and hyperparameter tuning was performed using GridSearchCV to optimize the performance. RMSE (root mean square error) and MAE (mean absolute error) were used to evaluate the performance of these models.
5. Prediction results of US
After evaluating all the models, XGBoost was selected to be the best prediction model due to its performance among all evaluation metrics. XGBoost has the lowest RMSE (6093.45) and MAE (5175.55), indicating that the predictions of XGBoost were the closest to the actual GDP values, with the smallest average errors.
The hyperparameters of the XGBoost model were optimized using GridSearchCV, and learning_rate: 0.1, max_depth: 7, n_estimators: 100 were identified as the optimal parameters, which improved the predictive accuracy of the model. When the predictions of the XGBoost model were plotted against the actual GDP values for the testing period (2012-2023), the predictions were nearly consistent with the actual trend, providing reliability and accuracy of the model.
6. Limitations and Further Suggestions
6.1. Limitations
Although this analysis is visually strong and insightful, there are still some limitations to be noticed. First, the dataset covers the period only from 1984 to 2023, and even if it provides a solid historical perspective, it may miss recent economic changes and future trends. Economic conditions change rapidly, and models may perform relatively differently when applied to certain environments. Second, this dataset only uses annual data, which may not capture short-term fluctuations or seasonal trends for more detailed forecasts. Another limitation is the model itself. For example, VAR models only apply linear relationships between variables, but may not fully capture the complexity that exists in real economic systems. Machine learning models such as XGBoost are known as powerful, but their performance is still limited by the quality and quantity of data, which remains a risk of overfitting, especially when applied to out-of-sample data.
6.2. Further Suggestions
Based on these limitations, there are several suggestions for further research to improve the analysis. Initially, incorporating additional data can increase the predictive power of the model. This may include variables such as the World Economic Indicator, the Technological Innovation Index, and the Geopolitical Risk Index to grab a larger range of factors that affect GDP. Using higher frequency data, such as quarterly or monthly data, can also improve the model's ability to forecast short-term trends and economic fluctuations. Exploring more advanced models is also another way of improvement. For example, trying Transformer-based models or hybrid models, such as integrating VAR with XGBoost, may give better results. Additionally, investigating methods that combine predictions from multiple models may improve overall accuracy and robustness. Feature engineering can be enhanced by incorporating techniques as well, such as polynomial features, interaction terms, and domain-specific transformations for interactions between variables.
By incorporating additional data, exploring advanced models, improving feature engineering, and enhancing evaluation techniques, the accuracy and robustness of GDP forecasts can be improved effectively. These advances will not only benefit economic forecasting, but also provide policymakers and businesses with more reliable tools for decision-making in an ever-changing economic environment.
7. Conclusion
Forecast models provide a valuable tool for understanding and predicting economic trends, but they need to evolve to better capture the complexity of a rapidly changing world. The global economy is deeply interconnected. Forecasting models should evolve by integrating AI-driven analytics, diverse data streams, and cross-sector collaboration to build resilient systems capable of weathering shocks and enabling sustainable recovery.
References
[1]. Scott R. Baker, Nicholas Bloom, Steven J. Davis, Stephen J. Terry, COVID-INDUCED ECONOMIC UNCERTAINTY.
[2]. Hailiang Chen, Prabuddha De, Yu (Jeffrey) Hu, and Byoung-Hyoun Hwang, WISDOM OF CROWDS: THE VALUE OF STOCK OPINIONS TRANSMITTED THROUGH SOCIAL MEDIA.
[3]. Private Sector Data*, Raj Chetty, John N. Friedman, Nathaniel Hendren, Michael Stepner, and the Opportunity Insights Team, The Economic Impacts of COVID-19: Evidence from a New Public Database Built Using.
[4]. Sydney C. Ludvigson, Sai Ma, and Serena Ng, COVID-19 and The Macroeconomic Effects of Costly Disasters.
[5]. Giorgio E. Primiceri Andrea Tambalotti, Macroeconomic Forecasting in the Time of COVID-19*.
Cite this article
Zhou,Y. (2025). The Economic Fallout of COVID-19: Uncertainty, Sectoral Disruptions, and Policy Responses. Advances in Economics, Management and Political Sciences,177,164-170.
Data availability
The datasets used and/or analyzed during the current study will be available from the authors upon reasonable request.
Disclaimer/Publisher's Note
The statements, opinions and data contained in all publications are solely those of the individual author(s) and contributor(s) and not of EWA Publishing and/or the editor(s). EWA Publishing and/or the editor(s) disclaim responsibility for any injury to people or property resulting from any ideas, methods, instructions or products referred to in the content.
About volume
Volume title: Proceedings of the 3rd International Conference on Management Research and Economic Development
© 2024 by the author(s). Licensee EWA Publishing, Oxford, UK. This article is an open access article distributed under the terms and
conditions of the Creative Commons Attribution (CC BY) license. Authors who
publish this series agree to the following terms:
1. Authors retain copyright and grant the series right of first publication with the work simultaneously licensed under a Creative Commons
Attribution License that allows others to share the work with an acknowledgment of the work's authorship and initial publication in this
series.
2. Authors are able to enter into separate, additional contractual arrangements for the non-exclusive distribution of the series's published
version of the work (e.g., post it to an institutional repository or publish it in a book), with an acknowledgment of its initial
publication in this series.
3. Authors are permitted and encouraged to post their work online (e.g., in institutional repositories or on their website) prior to and
during the submission process, as it can lead to productive exchanges, as well as earlier and greater citation of published work (See
Open access policy for details).
References
[1]. Scott R. Baker, Nicholas Bloom, Steven J. Davis, Stephen J. Terry, COVID-INDUCED ECONOMIC UNCERTAINTY.
[2]. Hailiang Chen, Prabuddha De, Yu (Jeffrey) Hu, and Byoung-Hyoun Hwang, WISDOM OF CROWDS: THE VALUE OF STOCK OPINIONS TRANSMITTED THROUGH SOCIAL MEDIA.
[3]. Private Sector Data*, Raj Chetty, John N. Friedman, Nathaniel Hendren, Michael Stepner, and the Opportunity Insights Team, The Economic Impacts of COVID-19: Evidence from a New Public Database Built Using.
[4]. Sydney C. Ludvigson, Sai Ma, and Serena Ng, COVID-19 and The Macroeconomic Effects of Costly Disasters.
[5]. Giorgio E. Primiceri Andrea Tambalotti, Macroeconomic Forecasting in the Time of COVID-19*.