


1. Introduction
Transportation is placed at the frontline of global decarbonization, as this sector remains one of the greatest contributors to greenhouse gas emissions. Passenger vehicles and public buses alone are responsible for nearly 45.1% of global carbon dioxide emissions [1], which underscores the urgency of transitioning to cleaner alternatives. To reduce the reliance on fossil fuels and cutting carbon emissions, New Energy Vehicles (NEVs) emerged. It is defined as “the four-wheel vehicle using unconventional vehicle fuel as the power source” [2]. In China, NEVs are used to refer to plug-in electric vehicles, which include Battery Electric Vehicles (BEVs) and Plug-in Hybrid Electric Vehicles (PHEVs) [3].
Beyond their environmental benefits, NEVs also have tremendous market value. According to the International Energy Agency, almost one in five cars sold in 2023 were electric globally [4]. However, as study indicated, NEVs are more expensive than conventional vehicles [5]. As a result, policy support is considered essential in driving the development of NEVs.
Among all the economic entities, mainland China (hereafter “China”), is a special existence. Government interference is particularly significant in China compared to other entities. As an integral part of China’s Strategy of Sustainable Development, the Chinese government has spent numerous efforts to support NEVs. Since 2009’s “Notice on Launching Pilot Projects for the Demonstration and Promotion of Energy-Saving and New Energy Vehicles”, the Chinese government has been providing financial support to new energy automakers and buyers. China’s NEVs market performance is also the most outstanding one. The number of new electric vehicles registered in 2023 reached 8.1 million, which contributed to almost 60% of the global statistics [4].
However, long-lasting subsidies have placed a burden on the national treasury, and as the market share of NEVs in China continues to increase, the necessity of subsidizing NEVs is considered to be decreasing. Consequently, the government has been gradually reducing the scale of subsidies. The adjustments of policy not only affect the operations and performance of automakers, but also affect the investment behaviors in the capital market. Despite the significance of these changes, the short-term market reactions to subsidy adjustments in the NEV industry remain underexplored. This study addresses this gap by analyzing the relationship between subsidy announcements and short-term stock market fluctuations, providing valuable insights for policymakers and market participants.
2. Literature Review
Existing literatures have discussed whether government subsidies have significantly promoted the development of NEVs or not. Most of the studies suggested that the NEVs industry is sensitive to subsidies, as subsidies facilitate technological innovations and market adoptions. Xu indicated that in the Chinese market, with the subsidy increase by 1%, the research input of NEVs auto-makers increased by 0.12% in general [6]. In Guo’s case study about BYD company, a leading NEV manufacturer in China, government subsidies contributed 23% of BYD’s net profit on average from 2011-2019 [7]. On the consumer’s side, studies also indicated a positive correlation between subsidies and NEVs market share [8]. Tax preferences as a form of subsidy, is also considered to have strong and positive impacts on the performance of NEV-related enterprises [9]. The NEV sector’s heavy reliance on subsidies not only supports its growth but also potentially triggers stock market reactions. Understanding the short-term effects of subsidy announcements on the stock market is therefore critical. However, these studies mostly focused on the long-term effect of subsidy instead of the short-term turbulence brought by the announcement of policy. Meanwhile, the adoption of NEVs and the performance of the NEV industry does not necessarily coincide with the situation in the investment market. There is a lack of specific studies for the stock market reaction.
The event-study method has been frequently used by scholars to evaluate the impact of a particular policy or regulation. Invented by Rayball and Philip Brown in 1968 [9], the method is designed to measure abnormal returns during a defined period, under the assumption that all relevant information is quickly reflected into stock prices by rational market participants. Scholars have adopted this analytical framework to evaluate the capital market responses to subsidy announcements. Liu et al. classified subsidy policy into fiscal subsidy, preferential tax, and procurement, and successfully demonstrated their connection with the stock market reaction [10]. The classification was instructive, but it was also worth noting that the preferential tax was often regarded as a part of fiscal subsidy, so the naming was to some extent misleading. Meanwhile, their study adopted the market model to estimate the normal return, which neglected the effect of risk-free interest rate. In other words, the opportunity costs for investors were ignored. The event window it had chosen was also too narrow (only three days), which potentially failed to capture the turbulence in the market. Most importantly, the study examines subsidy events up to 2019 before the epidemic, which failed to capture an important turning point in policy as well as market dynamics. There also existed a study, which evaluated the stock market reaction within single years, suggesting that the 2020 policy triggered a significantly positive stock market reaction [11]. However, this study was not referential to the subsidy policies, as the subject policy was an industrial development guiding plan without a substantial number of subsidies.
To address these gaps, this study employs the event study methodology to calculate and test the significance of cumulative abnormal returns (CAAR) around subsidy announcements. By incorporating a larger dataset of policy events, including those from the post-2019 period, this analysis offers more robust and comprehensive insights. The model and windows used in the event study is redesigned.
3. Methodology
3.1. Event-study
As discussed in the literature review, the event-study method is widely used to evaluate the impact of a specific event on the price of assets. The methodology follows standard event study procedures, including defining events, calculating abnormal returns (AR), cumulative abnormal returns (CAR), and cumulative average abnormal returns (CAAR), as well as performing statistical significance tests.
The events in this study are defined as the announcements of China’s national-wide NEVs subsidies. The official announcement date of the policies is defined as the Event Date (t=0). If the announcement date is not a trading day, then the next trading day is defined as the Event Date. Generally, the estimation window is prior to the event window and the event period itself is not included in the estimation window [12], so this study set the estimation window as [-85, -6], that is, 85 to 6 trading days before the event date to avoid the impact of the event. The estimation windows are used to estimate the parameters for the market model. This study sets up multiple Event Windows as [-3,3]
This study adopts the Capital Asset Pricing Model (CAPM) to calculate the Expected Return of the stocks.
\( E({R_{i,t}}) -rft ={α_{i}}+{β_{i}}{(R_{m,t}}-rft)+e \) (1)
\( E({R_{i,t}}) \) : the expected return of stock i at time t.
\( {β_{i}} \) are estimated using the Ordinary Least Square (OLS) in the Estimation Window.
\( {β_{i}} \) : the market sensitivity of stock i (the relationship between stock’s expected return and the market return).
\( {R_{m,t}} \) : the market return (measured by Shanghai Stock Exchange Composite Index SHA000001).
Based on the expected returns, the Abnormal Returns are calculated:
\( A{R_{i,t}}={R_{i,t}}-E({R_{i,t}}) \) (2)
\( {R_{i,t}} \) : the actual return of stock i on day t.
Cumulative Abnormal Return (CAR) is calculated by summing the abnormal returns of a single stock over the event window.
\( CA{R_{i}}=\sum _{t=t1}^{t2} A{R_{i,t}} \) (3)
[t1, t2]: the start and end date of the event window.
Cumulative Average Abnormal Return (CAAR) is calculated as the average of the CARs across all companies.
\( CAAR=\frac{1}{N}\sum _{i=1}^{N} CA{R_{i}} \) (4)
N: the total number of companies in the sample
To test the significance of the CAAR, t-test is conducted.
\( t=\frac{CAAR}{σCAAR/\sqrt[]{N}} \) (5)
\( σCAAR \) : standard deviation of CARs across companies.
To test the overall effect of a type of subsidy, the overall CAARs are calculated for different categories.
Overall CAAR: the average CAAR for a type of subsidy policy.
\( Overall CAAR= \frac{1}{N} \sum _{i=1}^{N}{CAAR_{i}} \) (6)
\( {σ_{CaseX}}=\sqrt[]{\frac{\sum _{f=1}^{M}{(CAA{R_{f}}-Overall {CAAR_{CaseX}})^{2}}}{M-1}} \) (7)
\( {t_{CaseX}}=\frac{Overall {CAAR_{CaseX}}}{{σ_{CaseX}}/\sqrt[]{M}} \) (8)
3.2. Policy and Data Collection
The study focuses exclusively on nation-wide subsidy policies from 2010 to 2024 issued by the Chinese central government (Ministry of Finance, National Development and Reform Commission, etc.), excluding provincial policies to ensure comparability. Only policies with explicitly defined subsidy measures are discussed (purchase subsidies, infrastructure support, operational subsidies, or tax preferences), while general guidelines without details are not involved. The sample period is from 2010 to 2024 (Table 1).
Table 1: All Subsidy Events
Classification | Document Title | Policy Nature | Date of Announcement |
Direct Subsidy | Notice on launching the pilot program for subsidizing the private purchase of NEVs. MOF [2010] No.230 | Positive | 01/06/2010 |
Notice on continuing the promotion and application of NEVs. MOF [2013] No.551 | Positive (phase out not declared yet) | 13/09/2013 | |
Notice on further enhancing the promotion of NEVs. MOF [2014] No.11 | Negative (5% decline of subsidy) | 08/02/2014 | |
Notice on incentives for the construction of NEV charging facilities. MOF [2014] No.692 | Positive (subsidize NEVs related infrastructures) | 18/11/2014 | |
Notice on fiscal subsidy policies for the promotion and application of NEVs (2016–2020)”. MOF29/04/[2015] No.134 | Negative (announcement for continuous decline in subsidy) | 22/04/2015 | |
Notice on adjusting the fiscal subsidy policies for the promotion and application of NEVs”. MOF29/12/[2016] No.958 | Negative (higher access threshold for subsidy; policy phase out) | 29/12/2016 | |
Notice on adjusting and improving the fiscal subsidy policies for the promotion and application of NEVs. MOF [2018] No.18 | Negative (higher access threshold for subsidy) | 13/02/2018 | |
Notice on further improving the fiscal subsidy policies for the promotion and application of NEVs”MOF [2019] No.138 | Negative (announcement for the partial end of subsidy) | 26/03/2019 | |
Notice on Improving the Fiscal Subsidy Policies for the Promotion and Application of New Energy Vehicles. MOF [2020] No.86 | Positive (extension of subsidy) | 23/04/2020 | |
Notice on Further Improving the Fiscal Subsidy Policies for the Promotion and Application of New Energy Vehicles. MOF [2020] No.593 | Negative (20% decline of subsidy) | 31/12/2020 | |
Notice on the Fiscal Subsidy Policies for the Promotion and Application of New Energy Vehicles in 2022. MOF [2021] No.466 | Negative (announcement for the partial end of subsidy) | 31/12/2021 | |
Government Procurement | Notice on continuing the promotion and application of NEVs. MOF [2013] No.551 | Positive (promotion for government procurement) | 13/09/2013 |
Implementation Plan for the Purchase of New Energy Vehicles by Government Agencies and Public Institutions. NGOA | Positive (regulate the minimum proportion for NEVs procurement) | 11/06/2014 | |
Notice on further clarifying the requirements for the proportion of government procurement of new energy vehicles. MOF [2024] No.269 | Positive (require the minimum size of NEVs fleet for civil service) | 19/12/2024 | |
Tax Preferences | Regulations for the Implementation of the Vehicle and Vessel Tax Law of the People's Republic of China. The State Council [2011] No.611 | Positive (Exemption of vehicle and vessel tax) | 05/12/2011 |
Announcement on Exempting New Energy Vehicles from Vehicle Purchase Tax. MOF [2017] No.172 | Positive (listed NEVs are free from purchase tax) | 26/12/2017 | |
Notice on the preferential policy of vehicle and vessel tax for energy-saving new energy vehicles and vessels. MOF&STA [2018] No.74 | Positive (Exemption of Vehicle and Vessel Tax for New Energy Vehicles and Vessels) | 10/07/2018 | |
Announcement on the relevant policy of exempting new energy vehicles from vehicle purchase tax. MOF&STA [2020] No.21 | Pure electric vehicles, plug-in hybrid (including extended-range) vehicles, fuel cell vehicles | 16/04/2020 | |
Announcement on the continuation of the vehicle purchase tax exemption policy for new energy vehicles. MOF&STA [2022] No.27 | Prelong the tax preferences | 18/09/2022 |
The study uses a sample of 117 companies in the A-share through a two-step process. It firstly identified the top 100 companies from Hithink RoyalFlush Information Network (Tonghuashun) based on correlation with NEVs, then integrating these with the 50 companies included in the CSI New Energy Index. After removing duplicates from the combined set, a final sample of 117 companies was obtained. The historical data included in this sample are downloaded from CSMAR, a leading financial data provider in China.
4. Empirical Results
The research adopts event-study methodology, analyzing each individual announcements and three types of subsidies integrally (direct subsidy, government procurement, and tax preferences).
4.1. Direct Subsidy
This paper defines direct subsidy as financial transfers from government to enterprises or consumers aimed at reducing the cost of production or consumption of specific goods [13]. In China, the selling price of EVs equal to the retail price reduced by the per-vehicle purchase subsidy amount, with the seller then receiving direct subsidy payments from the central and local governments [14,15].
There are 11 direct subsidy events included. The results are summarized in Figure 1.
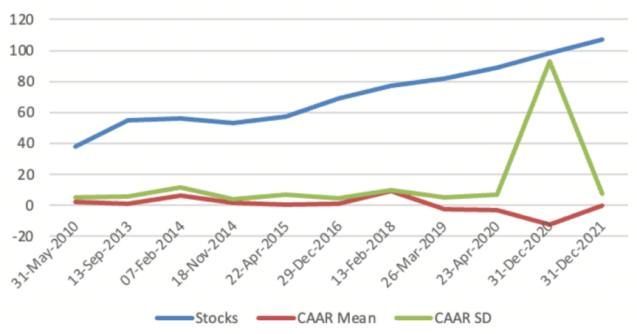
Figure 1: Direct subsidy
The mean CAAR for direct subsidy across all events is 0.2423, and the cross-event standard deviation reached 5.52, indicating strong heterogeneity in market responses. A conventional t-test is performed to examine whether the average CAAR significantly differs from zero or not. The obtained p-value is 0.8872, which is statistically insignificant at the 5% level of significance. The lack of overall significance suggests that, while individual policies may have impacted specific events, the aggregate market reaction does not exhibit a strong, systematic pattern. This can be explained that the positive and negative direct subsidies have counteract with each other, leading to a mild mean CAAR, which is possibly related to policy intensity, market expectations and industry cycles. This result aligns with the expectation that investors might have already priced in policy effects before the announcements, or that heterogeneity in firm responses diluted any strong market-wide impact.
Though the overall result is insignificant, the trend is still informative. Among the 11 direct subsidy events, 6 of them show significant CAAR, suggesting that direct subsidy initially had impacts on investor sentiments. In early policy implementations, policies were perceived to be positive, as four of the CAARs are significantly positive. 2014-2018is identified as a buffer period with gradual reductions. For example, the policy issued on 08 Feb 2014 is significant despite announcing a subsidy reduction (a CAAR of 6.2249 and a p-value of 0.002). Such market confidence could be attributed to many factors. Firstly, the extent of reduction was lower than the expectations. The previous announcement in 2013 suggested that the decline would be 10% in 2014 and 20% in 2015, while the revised document in 2014 only reduced subsidies by 5% in 2014 and 10% in 2015. Investors have interpreted this adjustment as positive. Secondly, the document promised long-term support beyond 2015, which eased the market's concern that the direct subsidy might end in 2015. 2019 to 2020 was a period for accelerated phase-out and market repricing. The biggest uncertainty at this stage came from the changes in the wording: the original positive language, such as "continuous optimization" was removed, and instead the emphasis was placed on controls, such as "no local protection" and preventing low-quality EVs projects. The document issued in 2020 marked an important turning point as the text mentioned “irreversible exist”, marking a systematic abandonment of direct subsidy.
Out of all the direct subsidy events, only two of them had significantly negative CAARs, signaling a shift in market sentiments. One anomaly is the event on December 31, 2020, which showed a highly negative CAAR (-12.76) with an extremely large standard deviation (92.9). This could be owed to the disruptions to the supply chain and market confidence brought by Covid-19 rather than the policy announcement itself.
Over time, CAARs evolved from predominantly positive to negative, reflecting investor concerns to the gradual phase-out of direct subsidies.
4.2. Government Procurement
Based on the definition of Organizations for Economic Cooperation and Development (OECD) [16], this paper defines government procurement as the government and other public institutions that use public funds, purchasing goods and services from organizations for themselves. It does not include procurement contracts made for public transportation.
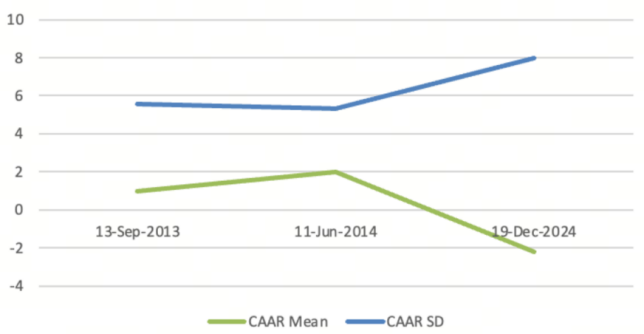
Figure 2: Government procurement
The mean CAAR for government procurement is 0.2522, which indicates that on average the government procurement could increase NEVs stock return for around 0.25% (Figure 2). Though the p-value is 0.8612, which indicates insignificance, this paper argues that the insignificance does not serve as a definite judgement on the overall effect of direct subsidy. The number of government procurement events is merely 3, leading to a tremendously high confidence interval, which means it would be statistically difficult to prove significance.
The event, announced on June 11th, 2014, was the first document that forcibly regulated a minimum proportion of a 30% government procurement ratio for public agencies, and explicitly required the proportion of matched charging facilities. It generated a significantly positive CAAR (1.99%) as it introduced a significantly large demand. By contrast, the government procurement document in 2024 resulted in a significantly negative CAAR (-2.2272), and the main reason could be concluded as the public was concerned about the continuation of government procurement. In the 2024 document, it mentioned again about the 30% proportion of NEVs in the civil service fleet, which had already been mentioned several times in the previous announcements since 2014. Besides that, there was no other substantial news mentioned in the document, which led to a market concern that the government procurement had already reached the limit.
4.3. Tax Preferences
Tax preferences refer to the use of the tax system to adjust relative prices to encourage producers and consumers to choose a specific type of goods. They function as subsidies by reducing government tax revenues and transferring to specific beneficiaries [17].
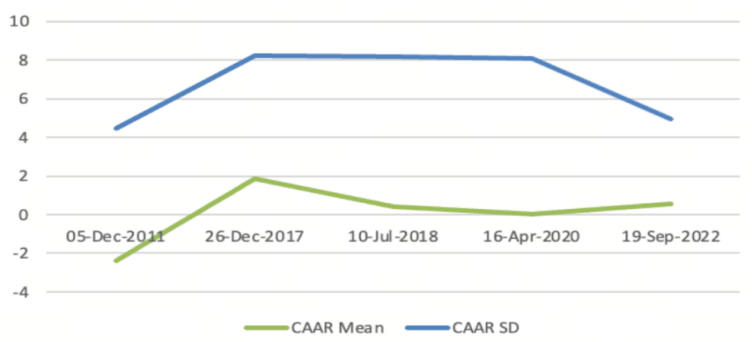
Figure 3: Tax preferences
The p-value for CAAR is 0.9029, showing the overall impact is insignificant (Figure 3). Some even showed a significantly negative effect on the market sentiment (2011’s announcement triggered a -2.397 CAAR). One possible reason is the offset of compliance costs against tax benefits. Though the announcements provided items including the exemption of vehicle and vessel tax, and purchase tax, they also bounded tax incentives to strict technical standards and corporates’ obligations to form a “conditional reduction” mechanism, blunting the stock market reactions. For instance, document No.172 issued in 2017, regulated that in order to enjoy the tax exemptions, corporations should pass specific tests for their products. Since 2017, the Chinese government has begun filing the “New Energy Vehicle Promotion and Application Recommended Models Catalog”, and the index dynamically adjusts each year. In 2021, there were only 99 newly included NEVs firms [18], while there were 150 thousand newly registered NEVs across China [19]. The limited number of eligible manufacturers included in the catalog could trigger market concerns that only a few companies enjoy competitive advantages, leaving others at a disadvantage. Secondly, the investors could have already digested the impact of tax preferences prior to the announcement; when the actual issuance aligned with the market expectations, it led to an insignificant CAAR; when the 2011 document was issued, it had led to a significant negative CAAR, which could be explained as the preference amount was below the market expectation. The clause recorded “Vehicles and vessels that save energy or use new energy may be exempted from vehicle and vessel tax or be halved” [20], which was a blurry and indefinite expression, and could potentially weaken market confidence towards the official support.
5. Conclusion
China’s subsidy policy has played a pivotal role in establishing its global leadership in New Energy Vehicles (NEVs). Existing studies have verified the effectiveness of these subsidies in promoting market adoption and the development of China’s NEV industry. Intuitively, one might expect that the announcement of subsidy policies would bring significantly positive impact to the stock market reactions; however, our study reveals that the interplay between policy announcements and stock returns is complicated. This study identifies these major findings: The subsidy policies, including direct subsidies, government procurement, and tax preferences, have had divergent impacts on the stock market. Direct subsidies initially boosted investor confidence, but this effect became volatile as phase-outs were announced, which ultimately led to insignificant overall impacts on market reactions. Interestingly, not all phase-out announcements triggered negative market reactions; some were less intense than expected, leading to positive market sentiment.
The empirical results for government procurement events are inconclusive due to the limited sample size. While individual results suggest that government procurement may increase market confidence by anchoring demand, repetitive mentions of the same targets could be interpreted as negative signals. A limitation in studying government procurement is the identification of events. The use of official guiding documents that set targets for government procurement as the sample set is proved to be inadequate. Future studies could improve by directly searching for government procurement contracts, which could more directly impact demand and increase the sample size. The stock market showed no significant reactions to announcements of tax preferences, primarily because technical compliance requirements diluted the perceived benefits, and the advanced market digestions.
This study’s limitations include heterogeneity in the stock samples. Classifying stocks into groups based on different capitalizations and positions in the industry chain could enhance the testing of significance. Additionally, the methodology for significance testing could be refined, given the small size of the event samples. Future studies could incorporate non-parametric methods as supplements to t-tests to improve robustness [21]. Adjusting the event window could also help test heterogeneity and strengthen the study’s robustness.
References
[1]. Zahoor, A., Yu, Y., et al. (2023). Can the new energy vehicles (NEVs) and power battery industry help China to meet the carbon neutrality goal before 2060? Journal of environmental management, 336, 117663.
[2]. Yuan, X., Liu, X., & Zuo, J. (2015). The development of new energy vehicles for a sustainable future: A review. Renewable and Sustainable Energy Reviews, 42, 298-305.
[3]. Hao, H., Geng, Y., et al. (2019). Impact of transport electrification on critical metal sustainability with a focus on the heavy-duty segment. Nat. Commun. 10, 1-7.
[4]. IEA (2024), Global EV Outlook 2024, IEA, Paris, https://www.iea.org/reports/global-ev-outlook-2024, Licence: CC BY 4.0
[5]. Ou, S., Hao, X., Lin, Z., Wang, H., Bouchard, J., He, X., ... & LaClair, T. J. (2019). Light-duty plug-in electric vehicles in China: An overview on the market and its comparisons to the United States. Renewable and Sustainable Energy Reviews, 112, 747-761.
[6]. Xu, Y. (2023). Research on the impact of government subsidies on R&D investment of new energy vehicle enterprises. Operational Research and Fuzzy Mathematics, 13(5), 4359–4368.
[7]. Guo, Z. (2023). The impact of government subsidies on the financial performance of new energy vehicle enterprises: A case study of BYD. Finance and Taxation Journal, 8, 86–88.
[8]. Hardman, S., Chandan, A., Tal, G., & Turrentine, T. (2017). The effectiveness of financial purchase incentives for battery electric vehicles–A review of the evidence. Renewable and Sustainable Energy Reviews, 80, 1100-1111.
[9]. Zeng, S., Ji, M., & Huang, X. (2025). An empirical study on the impact of tax incentives on the development of new energy vehicles: Case of China. Energy Policy, 198, 114452.
[10]. Liu, C., Liu, Y., Zhang, D., & Xie, C. (2022). The capital market responses to new energy vehicle (NEV) subsidies: An event study on China. Energy Economics, 105, 105677.
[11]. Cao, J., Wang, Y., & Liu, H. (2024). Stock market reaction to new energy vehicle industry development plan: an event study in China. Climate Policy, 24(7), 934–948.
[12]. MacKinlay, A. C. (1997). Event studies in economics and finance. Journal of Economic Literature, 35(1), 13–39.
[13]. International Monetary Fund, Organisation for Economic Co-operation and Development, World Bank, & World Trade Organization. (2021). Subsidies, Trade, and International Cooperation.
[14]. Zhang, T., Burke, P. J., & Wang, Q. (2024). Effectiveness of electric vehicle subsidies in China: A three-dimensional panel study. Resource and Energy Economics, 76, 101424.
[15]. Ministry of Finance, National Development and Reform Commission, Ministry of Science and Technology, & Ministry of Industry and Information Technology of the People's Republic of China. (2010). Interim measures for the administration of financial subsidy funds for private purchase of new energy vehicles pilot program Policy document [(2010) No.147]. http://jjs.mof.gov.cn/zhengcefagui/201008/t20100816_336519.htm
[16]. OECD. (2022). Public procurement. OECD. April 22, 2022, https://www.oecd.org
[17]. Greene, J., & Braathen, N. A. (2014). Tax preferences for environmental goals: Use, limitations, and preferred practices (OECD Working Paper No. ENV/WKP. Organisation for Economic Co-operation and Development.
[18]. Ministry of Industry and Information Technology of the People’s Republic of China. (2021). Catalog of recommended models for the promotion and application of new energy vehicles (12th batch). https://www.gov.cn/zhengce/zhengceku/2021-12/12/content_5660257.htm
[19]. Qichacha. (2021). China’s new energy vehicle enterprise registration statistics report [Database/Report; original work in Chinese]. Retrieved from https://www.qcc.com
[20]. State Council of the People’s Republic of China. (2011). Regulations for the Implementation of the Vehicle and Vessel Tax Law of the People’s Republic of China [State Council Order No. 611]. Official Website of the Central People’s Government of China. https://www.gov.cn/gongbao/content/2011/content_2020912.htm
[21]. Ludbrook, J., & Dudley, H. (1998). Why Permutation Tests are Superior to t and F Tests in Biomedical Research. The American Statistician, 52(2), 127–132.
Cite this article
Liu,X. (2025). Policy Shocks and Market Reactions: An Event-Study Analysis on China’s NEV Subsidy. Advances in Economics, Management and Political Sciences,179,14-23.
Data availability
The datasets used and/or analyzed during the current study will be available from the authors upon reasonable request.
Disclaimer/Publisher's Note
The statements, opinions and data contained in all publications are solely those of the individual author(s) and contributor(s) and not of EWA Publishing and/or the editor(s). EWA Publishing and/or the editor(s) disclaim responsibility for any injury to people or property resulting from any ideas, methods, instructions or products referred to in the content.
About volume
Volume title: Proceedings of the 9th International Conference on Economic Management and Green Development
© 2024 by the author(s). Licensee EWA Publishing, Oxford, UK. This article is an open access article distributed under the terms and
conditions of the Creative Commons Attribution (CC BY) license. Authors who
publish this series agree to the following terms:
1. Authors retain copyright and grant the series right of first publication with the work simultaneously licensed under a Creative Commons
Attribution License that allows others to share the work with an acknowledgment of the work's authorship and initial publication in this
series.
2. Authors are able to enter into separate, additional contractual arrangements for the non-exclusive distribution of the series's published
version of the work (e.g., post it to an institutional repository or publish it in a book), with an acknowledgment of its initial
publication in this series.
3. Authors are permitted and encouraged to post their work online (e.g., in institutional repositories or on their website) prior to and
during the submission process, as it can lead to productive exchanges, as well as earlier and greater citation of published work (See
Open access policy for details).
References
[1]. Zahoor, A., Yu, Y., et al. (2023). Can the new energy vehicles (NEVs) and power battery industry help China to meet the carbon neutrality goal before 2060? Journal of environmental management, 336, 117663.
[2]. Yuan, X., Liu, X., & Zuo, J. (2015). The development of new energy vehicles for a sustainable future: A review. Renewable and Sustainable Energy Reviews, 42, 298-305.
[3]. Hao, H., Geng, Y., et al. (2019). Impact of transport electrification on critical metal sustainability with a focus on the heavy-duty segment. Nat. Commun. 10, 1-7.
[4]. IEA (2024), Global EV Outlook 2024, IEA, Paris, https://www.iea.org/reports/global-ev-outlook-2024, Licence: CC BY 4.0
[5]. Ou, S., Hao, X., Lin, Z., Wang, H., Bouchard, J., He, X., ... & LaClair, T. J. (2019). Light-duty plug-in electric vehicles in China: An overview on the market and its comparisons to the United States. Renewable and Sustainable Energy Reviews, 112, 747-761.
[6]. Xu, Y. (2023). Research on the impact of government subsidies on R&D investment of new energy vehicle enterprises. Operational Research and Fuzzy Mathematics, 13(5), 4359–4368.
[7]. Guo, Z. (2023). The impact of government subsidies on the financial performance of new energy vehicle enterprises: A case study of BYD. Finance and Taxation Journal, 8, 86–88.
[8]. Hardman, S., Chandan, A., Tal, G., & Turrentine, T. (2017). The effectiveness of financial purchase incentives for battery electric vehicles–A review of the evidence. Renewable and Sustainable Energy Reviews, 80, 1100-1111.
[9]. Zeng, S., Ji, M., & Huang, X. (2025). An empirical study on the impact of tax incentives on the development of new energy vehicles: Case of China. Energy Policy, 198, 114452.
[10]. Liu, C., Liu, Y., Zhang, D., & Xie, C. (2022). The capital market responses to new energy vehicle (NEV) subsidies: An event study on China. Energy Economics, 105, 105677.
[11]. Cao, J., Wang, Y., & Liu, H. (2024). Stock market reaction to new energy vehicle industry development plan: an event study in China. Climate Policy, 24(7), 934–948.
[12]. MacKinlay, A. C. (1997). Event studies in economics and finance. Journal of Economic Literature, 35(1), 13–39.
[13]. International Monetary Fund, Organisation for Economic Co-operation and Development, World Bank, & World Trade Organization. (2021). Subsidies, Trade, and International Cooperation.
[14]. Zhang, T., Burke, P. J., & Wang, Q. (2024). Effectiveness of electric vehicle subsidies in China: A three-dimensional panel study. Resource and Energy Economics, 76, 101424.
[15]. Ministry of Finance, National Development and Reform Commission, Ministry of Science and Technology, & Ministry of Industry and Information Technology of the People's Republic of China. (2010). Interim measures for the administration of financial subsidy funds for private purchase of new energy vehicles pilot program Policy document [(2010) No.147]. http://jjs.mof.gov.cn/zhengcefagui/201008/t20100816_336519.htm
[16]. OECD. (2022). Public procurement. OECD. April 22, 2022, https://www.oecd.org
[17]. Greene, J., & Braathen, N. A. (2014). Tax preferences for environmental goals: Use, limitations, and preferred practices (OECD Working Paper No. ENV/WKP. Organisation for Economic Co-operation and Development.
[18]. Ministry of Industry and Information Technology of the People’s Republic of China. (2021). Catalog of recommended models for the promotion and application of new energy vehicles (12th batch). https://www.gov.cn/zhengce/zhengceku/2021-12/12/content_5660257.htm
[19]. Qichacha. (2021). China’s new energy vehicle enterprise registration statistics report [Database/Report; original work in Chinese]. Retrieved from https://www.qcc.com
[20]. State Council of the People’s Republic of China. (2011). Regulations for the Implementation of the Vehicle and Vessel Tax Law of the People’s Republic of China [State Council Order No. 611]. Official Website of the Central People’s Government of China. https://www.gov.cn/gongbao/content/2011/content_2020912.htm
[21]. Ludbrook, J., & Dudley, H. (1998). Why Permutation Tests are Superior to t and F Tests in Biomedical Research. The American Statistician, 52(2), 127–132.