


1. Introduction
Against the dual challenges of global climate change and energy security, the NEV industry, as a strategic fulcrum for achieving the "dual carbon" goals, has become a core area for countries to compete for industrial dominance. However, issues such as regional differentiation in industrial competitiveness, structural imbalances in technological innovation, and urban-rural gaps in market promotion restrict high-quality industrial development. Existing studies primarily focus on government-led technological innovation paths [1] and regional competitiveness evaluations [2], but the lack of a national-scale data system and theoretical framework limitations have resulted in insufficient systematic understanding of the mechanisms driving industrial competitiveness.
Scholarly research on NEV industries at home and abroad exhibits differentiated characteristics. Domestic studies emphasize macro-policy effects and technological innovation mechanisms. For example, Bai Mei pointed out that during the "13th Five-Year Plan" period, China's industrial competitive advantages were concentrated in market scale and policy-driven factors, and the "14th Five-Year Plan" period requires a shift toward deep technological innovation [3]. Jiang Wei and Huo Guoqing found significant differences in new energy module innovation capabilities between Beijing and Shenzhen through regional comparisons [4]. Foreign studies focus more on micro-driving factors for market promotion. Austmann confirmed the positive role of environmental awareness in electric vehicle development through consumer psychology analysis [5], while Jain revealed that government support reduces consumer perceived risk using the UTAUT model [6].
This study introduces the PSR (Pressure-State-Response) model proposed by Canadian statistician David to construct a national-scale evaluation system for NEV industrial competitiveness. Based on panel data from 30 provinces (regions/municipalities) across China from 2011 to 2021, this research constructs an evaluation system with 17 indicators to address the following key scientific questions: (1) The spatio-temporal evolution characteristics of China's NEV industrial competitiveness; (2) The synergistic mechanism between technological innovation and market response; (3) The internal causes of regional development imbalances. The research results will provide theoretical support for optimizing technological innovation layouts, promoting energy structure transformation, and improving market promotion systems, helping China transition from a "manufacturing powerhouse" to an "innovation powerhouse" in the NEV sector.
2. PSR model for new energy vehicle industry competitiveness
2.1. Definitions and relationships of elements
Pressure is the primary factor driving the development of the NEV industry. Pollutant emissions from traditional vehicles impose environmental pressures, while increasing electricity demand and continuous consumption of non-renewable energy generate carbon emissions, exacerbating environmental pollution. State refers to the competitive dynamic environment faced by the automotive industry ecosystem. Response represents the market vitality of the NEV industry, including infrastructure construction, market promotion, and utilization of NEVs, which improve the energy generation structure. The interaction mechanism under each element system is shown in Figure 1.
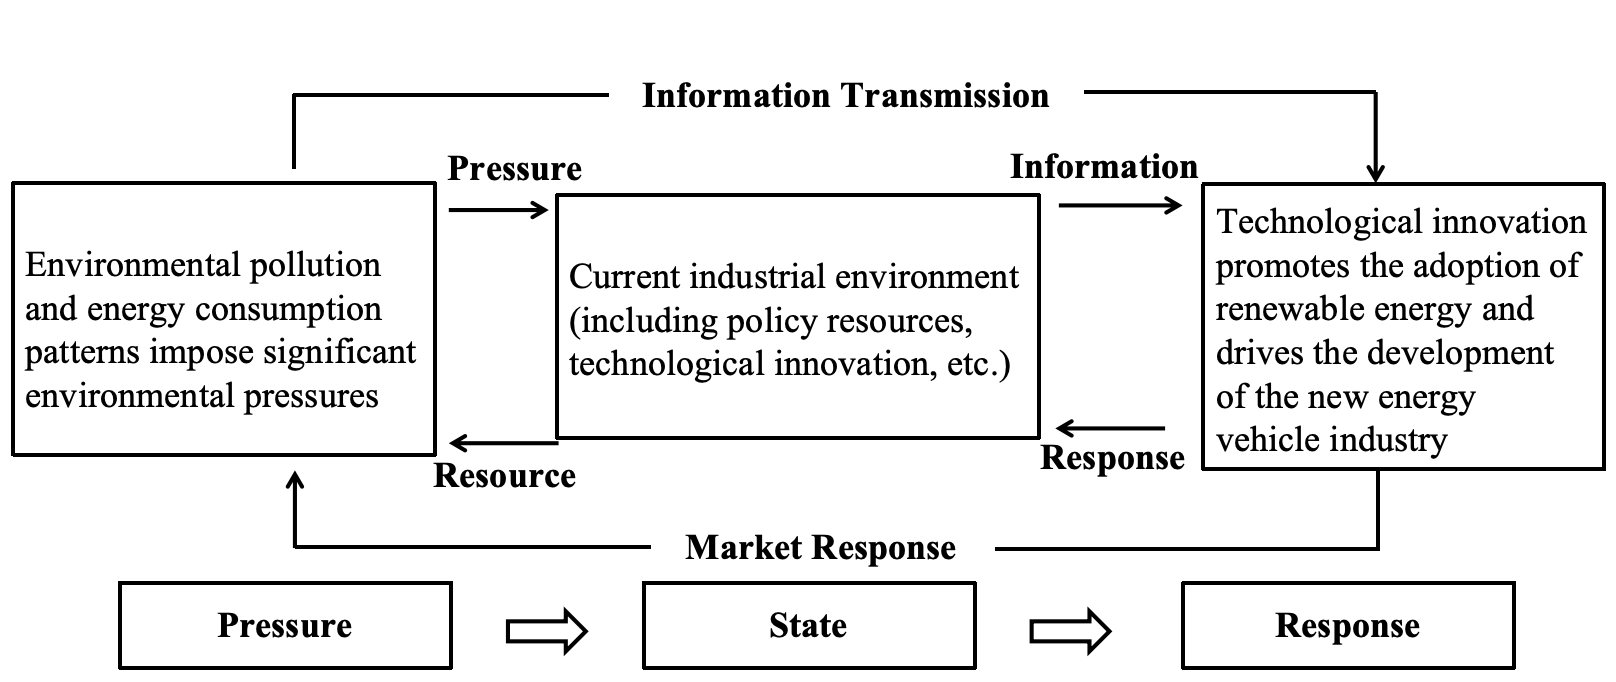
Figure 1: PSR model for the competitiveness of the new energy vehicle industry
2.2. Indicator selection for each element
Based on the mechanism of PSR model elements in the NEV industry, 17 evaluation indicators reflecting the characteristics of each PSR element are selected, considering the systematic features of the NEV industry and internal/external environmental influences. The evaluation index system for NEV industry development competitiveness is constructed as shown in Table 1.
Table 1: Evaluation index system for the development competitiveness of the new energy vehicle industry [7]
Primary Elements | Secondary Elements | Tertiary Indicators | Indicator Direction |
Pressure | Industrial Competition Pressure Environment | A1 Nitrogen Oxide Emissions of Motor Vehicles (ton) | - |
A2 Proportion of Thermal Power Generation (%) | - | ||
A3 Coal Consumption (10,000 tons) | - | ||
A4 Petroleum Consumption (10,000 tons) | + | ||
A5 Natural Gas Consumption (100 million cubic meters) | + | ||
State | Industrial Competition Dynamic Environment | B1 Investment in Waste Gas Treatment (10,000 yuan) | + |
B2 Patents for Carbon Reduction Technologies in Fossil Energy (unit) | + | ||
B3 Patents for Energy-Saving and Energy Recovery Utilization Technologies (unit) | + | ||
B4 Clean Energy Technology Patents (unit) | + | ||
B5 Green Low-Carbon Technological Innovation Patents (unit) | + | ||
B6 Number of Patents for Carbon Emission Trading Technologies (unit) | + | ||
B7 Energy Storage Technology Patents (unit) | + | ||
Response | Industrial Competition Vitality Environment | C1 Power Generation from Wind, Solar, and Nuclear Energy (100 million kWh) | + |
C2 Hydropower Generation (100 million kWh) | + | ||
C3 Sales Volume of New Energy Vehicles (unit) | + | ||
C4 Number of Public Electric Vehicles in Operation (unit) | + | ||
C5 Passenger Volume of Public Electric Vehicles (10,000 person-times) | + | ||
C6 Distribution of Charging Piles in Various Regions (unit) | + |
3. Data sources and evaluation model
Due to incomplete data for Hong Kong, Macao, Taiwan, and Tibet, this study focuses on data from 30 provinces (regions/municipalities). Raw data are sourced from the National Bureau of Statistics online database, the China Society of Automotive Engineers, China Energy Statistical Yearbook, and China Environmental Statistical Yearbook, spanning 2011–2021. Missing data for individual years are imputed using interpolation [8].
4. Research results
4.1. Spatio-temporal evolution of NEV industry competitiveness
Using the fixed-base range entropy method on 2011–2021 panel data, the comprehensive competitiveness index of the NEV industry shows significant spatio-temporal differentiation (Table 2).
Table 2: Comprehensive competitiveness index of the new energy vehicle industry (2011, 2015, 2020, 2021)
Year | National average | Maximum value(Province) | Minimum value (Province) | Coefficient of regional variation |
2011 | 0.212 | Guangdong(0.717) | Ningxia(0.034) | 0.89 |
2015 | 1.248 | Guangdong(4.558) | Ningxia(0.065) | 1.02 |
2020 | 3.267 | Guangdong(15.619) | Ningxia(0.212) | 1.18 |
2021 | 4.176 | Guangdong(27.389) | Ningxia(0.353) | 1.24 |
In the temporal dimension, nationally, the competitiveness index increased from 0.212 in 2011 to 4.176 in 2021, with an annual growth rate of 17.8%, though regional disparities widened. During 2011–2015, eastern provinces took the lead with an annual growth rate exceeding 25%.In 2016–2019, central-western provinces such as Anhui and Henan caught up via industrial transfer, and in 2020–2021, the Yangtze River Delta and Pearl River Delta regions maintained growth despite policy adjustments.
In the spatial dimension, the pattern of “strong east, weak west” is prominent. Among the top 10 provinces in terms of competitiveness in 2021, eastern provinces accounted for 70%, central provinces accounted for 20%, and only Shaanxi in the western region made the list, as shown in Table 3. The regional variation coefficient expanded from 0.89 in 2011 to 1.24 in 2021, indicating the intensification of the Matthew Effect.
Table 3: Competitiveness rankings of Top 10 provinces and key indicators in 2021
Province | Competitiveness Index | Technology Patents (units) | Charging Pile Density (units per 10,000 people) | Charging Pile Density (units per 10,000 people) |
Guangdong | 27.389 | 14,334 | 45.56 | 2.78 |
Jiangsu | 16.996 | 19,389 | 25.42 | 3.82 |
Zhejiang | 17.499 | 10,685 | 32.16 | 4.35 |
Shanghai | 15.793 | 5,603 | 25.27 | 5.14 |
Shandong | 11.830 | 6,575 | 19.54 | 1.74 |
Henan | 12.593 | 2,902 | 24.55 | 0.84 |
Anhui | 6.014 | 4,702 | 7.85 | 1.05 |
Fujian | 5.443 | 2,506 | 8.25 | 0.73 |
Beijing | 11.571 | 7,574 | 13.21 | 3.38 |
Shanxi | 4.345 | 3,747 | 6.51 | 0.79 |
4.2. Synergistic mechanism between technological innovation and market response
In terms of technological innovation, Guangdong Province held 14,334 technical patents in 2021, with both clean energy and energy storage technology patents ranking first nationally, driving its response element score to stay top in China for five consecutive years. Regarding market response, a strong positive correlation exists between charging pile density and new energy vehicle sales—Zhejiang’s charging pile number in 2021 grew 113-fold from 2011, directly boosting its sales to rank second nationwide. Concerning synergistic effects, provinces like Jiangsu and Zhejiang achieved sustained competitiveness enhancement via the "technological R&D—policy subsidies—market promotion" closed loop. For instance, Jiangsu’s technical patents and new energy vehicle sales in 2021 accounted for 12.5% and 9.3% of the national total respectively, with a synergy index reaching 0.91.
4.3. Internal causes of regional imbalances
First, there are disparities in policies and resource endowments: eastern provinces such as Guangdong and Shanghai have R&D investment intensity exceeding 2.5%, with government subsidies accounting for over 30% of industrial investment; in contrast, western provinces like Gansu and Qinghai have R&D investment of less than 1%, with weaker policy support. Second, the western region faces infrastructure shortcomings, in 2021, charging pile density in western provinces was less than 8% of the eastern average, and public transport electrification rates were only one-third of those in the east, constraining market penetration. Third, central-western provinces lag in technology transfer efficiency, their technology patent conversion rates are significantly lower than those in the east.
5. Conclusion
The evaluation of China’s new energy vehicle (NEV) industry competitiveness from 2011 to 2021 based on the PSR model reveals that while the overall industrial competitiveness has grown rapidly, regional differentiation remains pronounced. Eastern provinces continue to lead through the synergistic effects of technological innovation and market response, while only Anhui, Henan, and Shaanxi from central-western regions ranked among the top 10. The study finds that technological innovation and market response are closely linked and are the main reasons for competitiveness, while uneven distribution of policy resources, poor infrastructure, and gaps in technology transfer efficiency are key reasons for differences between regions. Thus, it’s important to implement differentiated policies to focus on technological upgrading and industrial cluster development in the east. Establish cross-regional industry-university-research platforms to enhance technology conversion rates; Improve charging network layouts, and explore mechanisms for carbon emission trading and inter-provincial technology transfer. These measures aim to achieve balanced industrial development through a "technological innovation-policy guidance-market-driven" triple-engine approach, contributing to the realization of "dual carbon" goals.
References
[1]. Dong F, Liu Y. Policy evolution and effect evaluation of new-energy vehicle industry in China[J]. Resources Policy, 2020, 67: 101655.
[2]. Xie W H, Zeng D C. Empirical study on the competitiveness evaluation of Guangdong’s new energy vehicle industry based on the new diamond model[J]. Science and Technology Management Research, 2019, 39(9): 56-61.
[3]. Bai M. Research on the global competition pattern of the new energy vehicle industry[J]. Price Theory and Practice, 2020(1): 25-31.
[4]. Jiang W, Huo G Q. Research on regional electric vehicle industry competitiveness based on industrial chain transformation: A case study of Beijing and Shenzhen[J]. Management Modernization, 2016, 36(4): 48-51.
[5]. Austmann L M. Drivers of the electric vehicle market: A systematic literature review of empirical studies[J]. Finance Research Letters, 2021, 41: 101846.
[6]. Jain N K, Bhaskar K, Jain S. What drives adoption intention of electric vehicles in India? An integrated UTAUT model with environmental concerns, perceived risk and government support[J]. Research in Transportation Business & Management, 2022, 42: 100730.
[7]. Rapport D, Friend A. Towards a comprehensive framework for environmental statistics:Astress—response approach[M]. Ottawa:Statistics Canada, 1979.
[8]. National Bureau of Statistics of China. (2023). China Statistical Yearbook Database. https://www.stats.gov.cn/sj/
Cite this article
Wang,Q. (2025). Evaluation of New Energy Vehicle Industry Competitiveness Based on the PSR Model. Advances in Economics, Management and Political Sciences,179,40-44.
Data availability
The datasets used and/or analyzed during the current study will be available from the authors upon reasonable request.
Disclaimer/Publisher's Note
The statements, opinions and data contained in all publications are solely those of the individual author(s) and contributor(s) and not of EWA Publishing and/or the editor(s). EWA Publishing and/or the editor(s) disclaim responsibility for any injury to people or property resulting from any ideas, methods, instructions or products referred to in the content.
About volume
Volume title: Proceedings of the 9th International Conference on Economic Management and Green Development
© 2024 by the author(s). Licensee EWA Publishing, Oxford, UK. This article is an open access article distributed under the terms and
conditions of the Creative Commons Attribution (CC BY) license. Authors who
publish this series agree to the following terms:
1. Authors retain copyright and grant the series right of first publication with the work simultaneously licensed under a Creative Commons
Attribution License that allows others to share the work with an acknowledgment of the work's authorship and initial publication in this
series.
2. Authors are able to enter into separate, additional contractual arrangements for the non-exclusive distribution of the series's published
version of the work (e.g., post it to an institutional repository or publish it in a book), with an acknowledgment of its initial
publication in this series.
3. Authors are permitted and encouraged to post their work online (e.g., in institutional repositories or on their website) prior to and
during the submission process, as it can lead to productive exchanges, as well as earlier and greater citation of published work (See
Open access policy for details).
References
[1]. Dong F, Liu Y. Policy evolution and effect evaluation of new-energy vehicle industry in China[J]. Resources Policy, 2020, 67: 101655.
[2]. Xie W H, Zeng D C. Empirical study on the competitiveness evaluation of Guangdong’s new energy vehicle industry based on the new diamond model[J]. Science and Technology Management Research, 2019, 39(9): 56-61.
[3]. Bai M. Research on the global competition pattern of the new energy vehicle industry[J]. Price Theory and Practice, 2020(1): 25-31.
[4]. Jiang W, Huo G Q. Research on regional electric vehicle industry competitiveness based on industrial chain transformation: A case study of Beijing and Shenzhen[J]. Management Modernization, 2016, 36(4): 48-51.
[5]. Austmann L M. Drivers of the electric vehicle market: A systematic literature review of empirical studies[J]. Finance Research Letters, 2021, 41: 101846.
[6]. Jain N K, Bhaskar K, Jain S. What drives adoption intention of electric vehicles in India? An integrated UTAUT model with environmental concerns, perceived risk and government support[J]. Research in Transportation Business & Management, 2022, 42: 100730.
[7]. Rapport D, Friend A. Towards a comprehensive framework for environmental statistics:Astress—response approach[M]. Ottawa:Statistics Canada, 1979.
[8]. National Bureau of Statistics of China. (2023). China Statistical Yearbook Database. https://www.stats.gov.cn/sj/