


1. Introduction
1.1. Research background
The pharmaceutical industry continues to develop rapidly because of global health emergencies and expanding biotech developments. The medical need for chronic disease management services, including long-term care, has increased due to population aging, primarily in developed countries. The development of biotechnology brings increased innovation speed, which creates new treatment opportunities while transforming how pharmaceuticals are made [1]. The COVID-19 pandemic's consequences reinforced healthcare sector dominance, making governments and investors rethink their focus on healthcare resistance and biomedical research [2]. The pharmaceutical industry emerged as both a defensive sector and a growth-oriented investment opportunity that attracts investors at a high rate. Advanced evaluation tools are needed because pharmaceutical business models present complex features, prolonged development timelines, and strict regulatory requirements. The present study develops a complex assessment method to guide pharmaceutical investments through financial stability, innovative capacity, and marketplace competencies.
1.2. Research objectives and significance
This research aims to provide investors with a comprehensive investment decision framework. This study compares four substantial pharmaceutical companies: Johnson & Johnson, Amgen, Gilead Sciences, and Regeneron Pharmaceuticals. It evaluates industry leaders alongside emerging players based on financial health, innovation strategies, market characteristics, and future strategic planning to guide their growth and help overcome challenges.
1.3. Paper structure
The second section analyzes the financial standing of these companies by comparing their profitability data with their solvency metrics, operational efficiency rates, growth prospects, and return on investment levels. The third section evaluates market performance alongside operational management models by assessing brand reputation, consumer sentiment, and organizational structure. The fourth section will determine future strategic direction, forecasting market share, and competitive positioning. The final section of the analysis combines significant results from the report with investment recommendations.
2. Financial performance comparison
2.1. Profitability metrics
Profitability is central to evaluating financial performance. Net profit margin, which reflects how much profit a company makes for every dollar of revenue, demonstrates key differences among the companies over the last four years [3]. As shown in Figure 1, Regeneron consistently leads with the highest net profit margin, growing from 36.5% in 2021 to 38% in 2024. This indicates strong cost control and revenue management. In contrast, Gilead’s margin declined from 22.7% to 17%, suggesting rising operational costs or declining pricing power.
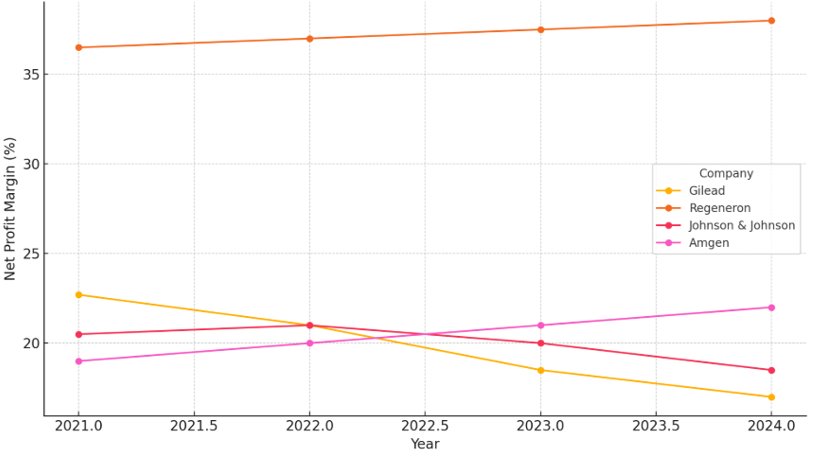
Figure 1: Net profit margin from 2021 to 2024
Photo credit: original
Amgen displayed a steady rise, reflecting its effective pricing strategies and potential synergies from acquisitions. Johnson & Johnson, although a diversified healthcare giant, showed a slight downward trend, possibly due to post-COVID market normalization and increasing R&D costs. According to Table 1, Return on Equity (ROE) trends reflect management efficiency. Gilead’s ROE sharply declined from 45% to 30%, possibly due to lower profitability and a stable equity base. In contrast, Amgen and Regeneron maintained high ROEs, around 35%, signaling strong returns for shareholders [4].
Table 1: Return on equity (ROE) (2021–2024)
Year | Gilead (GILD) | Regeneron (REGN) | Amgen (AMGN) | Johnson & Johnson (JNJ) |
2021 | 45 | 33 | 34 | 25 |
2022 | 41 | 35 | 35 | 26 |
2023 | 36 | 36 | 36 | 24 |
2024 | 30 | 36 | 35 | 25 |
Figure 2 reveals that Regeneron and Amgen maintain gross margins above 70%, suggesting cost-effective production and premium pricing models. J&J’s stable but lower margins indicate higher manufacturing costs from consumer health and device segments.
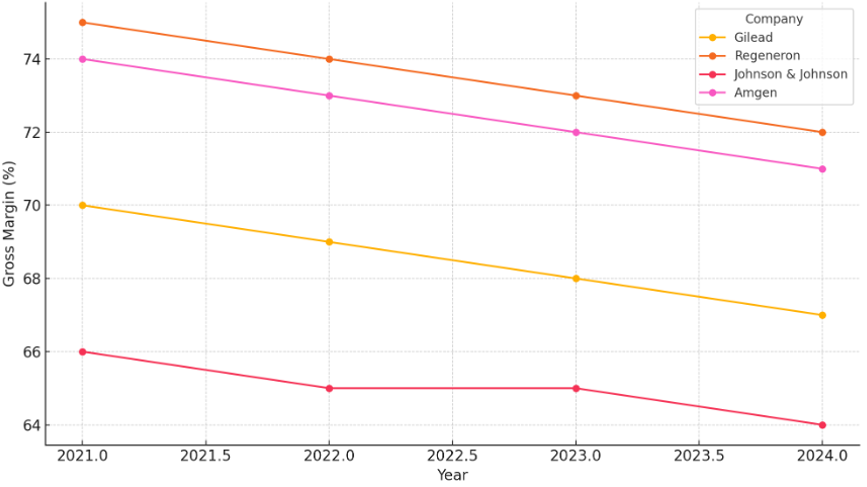
Figure 2: Gross margin from 2021 to 2024
Photo credit: original
These trends highlight cost structure differences—Regeneron and Amgen rely heavily on biologics with high margins, while Gilead and J&J manage broader product portfolios with varying cost bases.
2.2. Solvency and financial risk
Solvency metrics reveal a company's capacity to meet its short-term obligations. According to Figure 3, Amgen and J&J have strong current ratios, consistently above 1.3, indicating solid liquidity. Regeneron showed a moderate ratio around 1.2, while Gilead's declining ratio—dropping from 1.4 in 2021 to below 1.1 in 2024—signals increasing reliance on short-term liabilities [5].
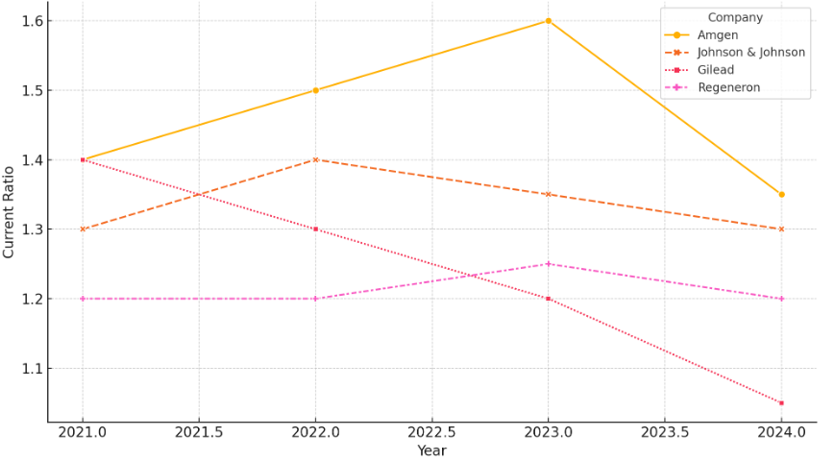
Figure 3: Current ratio from 2021 to 2024
Photo credit: original
According to Figure 4, Quick ratio trends closely mirrored the current ratios, though slightly lower due to inventory adjustments. Amgen’s high quick ratio reflects strong cash reserves, supporting its acquisition of Horizon Therapeutics in 2023.
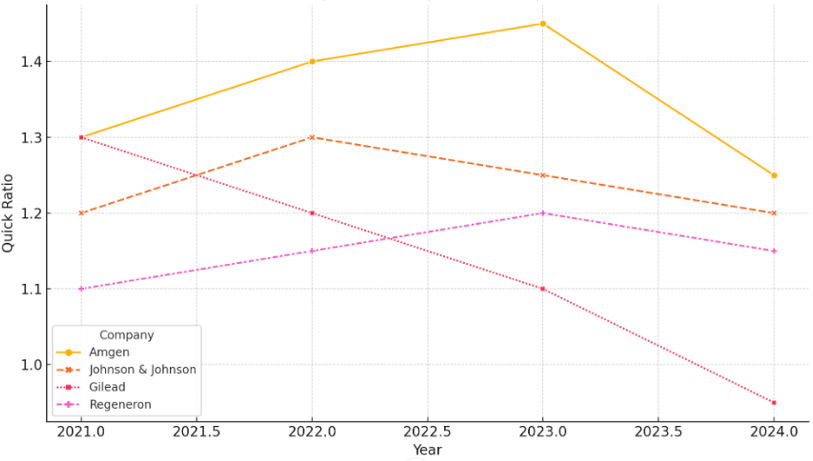
Figure 4: Quick ratio from 2021 to 2024
Photo credit: original
According to Figure 5, Interest coverage—a measure of the ability to pay interest on the debt—remained strong for J&J and Regeneron. Gilead’s declining interest coverage, falling below 5 in 2024, suggests rising debt levels, possibly linked to its capital expenditure.
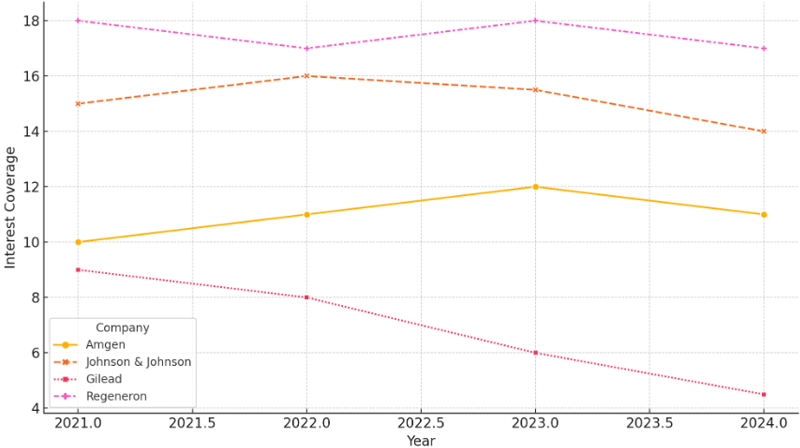
Figure 5: Interest coverage ratio from 2021 to 2024
Photo credit: original
2.3. Growth indicators
According to Figure 6, Tobin’s Q, a forward-looking indicator, was highest for Regeneron and Amgen, averaging above 1.5 from 2021 to 2024, implying strong investor confidence in their future growth. Gilead’s Tobin’s Q declined below 1.2 by 2024, reflecting market skepticism on its growth trajectory [6].
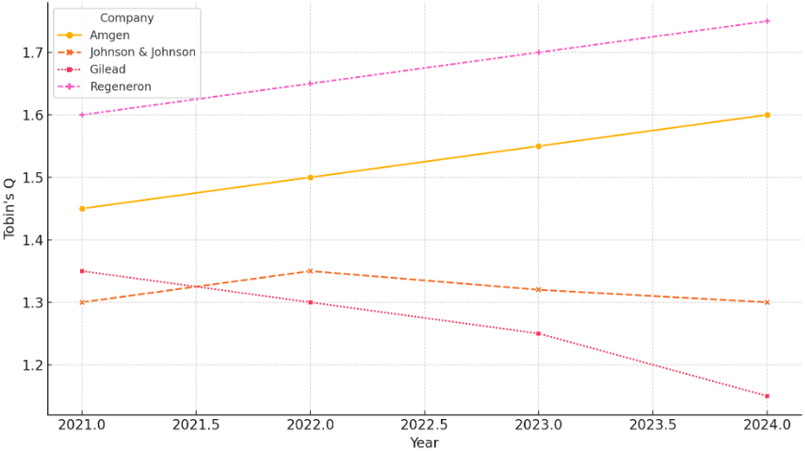
Figure 6: Tobin’s Q from 2021 to 2024
Photo credit: original
Shareholder equity growth is robust in Amgen and Regeneron, rising steadily due to retained earnings and successful innovation. J&J’s equity growth remained moderate, reflecting its stable, diversified operations. A key growth highlight is Amgen’s strategic acquisition of Horizon Therapeutics for $27.8 billion in 2023. This move expanded its rare disease portfolio, reflecting strategic (inorganic) growth. In contrast, Regeneron’s growth was more organic, driven by strong R&D pipelines and innovative product launches. Distinguishing between organic and strategic growth, Regeneron leads in innovation-driven expansion, while Amgen leverages acquisitions. Gilead’s growth appears mixed, relying on new drugs and past acquisitions like Immunomedics. J&J’s mature structure implies slower organic growth with strategic divestments like its consumer health spinoff.
3. Market positioning and operational capabilities
3.1. Global market share and growth
Johnson & Johnson (J&J) generates 50% of its revenue from the U.S. market, whereas 25% comes from Europe, and the remaining 25% takes place in Asia Pacific and other worldwide emerging markets. Johnson & Johnson has rapidly grown in Asia-Pacific territories through local factory expansion projects and local alliance developments in China and India. J&J showed pandemic-responsive behavior through its single-dose vaccine development and emergency distribution, which improved market expansion in developing regions with limited infrastructure capabilities [7]. Amgen derives almost all its revenue (roughly 75%) from operations within North America, thus restricting its worldwide market expansion. The company has directed its attention to market expansion in European and Latin American regions by launching bio-similar products. The company seeks to boost its international business expansion activities by acquiring Horizon Therapeutics.
The international business of Gilead Sciences maintains balanced operations by deriving more than 60 percent of its income from U.S. sales and pulling in 30 percent from the combined regions of the EU and Asia. The company received substantial global recognition during pandemic times with the release of Remdesivir, which temporarily delivered revenue growth as well as international market demand [8]. Regeneron is now starting to penetrate European and Asian markets yet derives most revenue from U.S. operations. Through its distribution partnership with Roche, the company entered new European and Asian markets to battle COVID-19 during the pandemic.
3.2. Operational management structure
J&J implements decentralized governance, providing separate decision-making power to its consumer health, medical device, and pharmaceutical divisions. The decentralized organizational design promotes entrepreneurial responses and innovative activity, although it might reduce centralized strategic unity. The pandemic demonstrated the strength of J&J's supply chain because it used dual sourcing along with distributed manufacturing plants, which spanned multiple continents. Amgen operates under a centralized organizational model that provides efficient decision-making along with quick global strategy implementation [8].
The company effectively accomplished Horizon Therapeutics' merger through this model, highlighting solid mergers and acquisitions abilities. Although centralized control provides strategic direction, it constrains the speed of adapting to individual market conditions in different regions. Gilead integrates strategic control from headquarters with operational flexibility in the specific areas of business operations. The company rapidly delivered its Remdesivir products worldwide because headquarters operated successfully with regional offices.
The company complies strongly with Good Manufacturing Practice (GMP), which upholds regulatory and product quality standards. Regeneron organizes its research and development functions within centralized areas while maintaining a compact organizational structure that facilitates fast development periods. The partnership between Roche and the company during the COVID-19 crisis illustrated outstanding operational flexibility even though their international infrastructure was minimal [9]. Quality assurance at the company stands strong through excellent GMP ratings, which makes its clinical benefits clear.
3.3. Operational efficiency indicators
According to Table 2, In 2024, Johnson & Johnson (J&J) maintained the most stable operational efficiency among the four firms, driven by its robust global distribution model and extensive product portfolio. J&J reported an inventory turnover ratio of 2.56 times and an asset turnover ratio of 0.49 times, highlighting its strong but moderately paced supply chain cycle typical for a diversified pharmaceutical and consumer health business. Amgen recorded an inventory turnover ratio of 1.69 times and an asset turnover ratio of 0.36 times in 2024, reflecting its biologics-heavy portfolio and centralized operational structure prioritizing stability over speed. Gilead Sciences showed an inventory turnover of 2.20 times and an asset turnover ratio of 0.38 times for 2024, reflecting its hybrid operating structure and strong global distribution capabilities, especially evident through its early COVID-19 therapeutic Remdesivir launch [10].
In contrast, Regeneron Pharmaceuticals reported the highest asset turnover ratio at 0.37 times in 2024 despite its lower revenue base. This reflects Regeneron's lean asset profile and high revenue efficiency relative to its assets, partly driven by its agile R&D model, which enabled it to develop and commercialize its COVID-19 antibody treatment in record time — outpacing J&J's vaccine rollout. Regeneron’s inventory turnover was 1.57 times in 2024, indicating a balance between stockpiling for antibody therapies and a responsive supply chain, particularly in biologics.
Table 2: Market positioning and operational capabilities comparison
Company | Global Revenue Distribution | Pandemic Response | Operational Structure | Supply Chain Resilience | Inventory Turnover (2024) | Asset Turnover (2024) | Responsiveness Speed |
J&J | 50% US, 25% EU, 25% Asia | Single-dose COVID-19 vaccine (Global) | Decentralized | Strong dual-sourcing strategy | 2.56 times | 0.49 times | Vaccine released within 10 months (2021) |
Amgen | ~75% North America | Limited COVID-19 direct role | Centralized | Resilient post-M&A integration | 1.69 times | 0.36 times | N/A |
Gilead | 60% US, 30% EU & Asia | Remdesivir antiviral (early COVID treatment) | Hybrid (central + regional) | Moderate with global rollout | 2.20 times | 0.38 times | Early EUA approval for Remdesivir (2020) |
Regeneron | 85% US, emerging globally | COVID-19 antibody cocktail with Roche | Centralized & R&D-focused | Lean, agile R&D model | 1.57 times | 0.37 times | Fast antibody development within months (2020-2021) |
4. Integrated comparative evaluation
4.1. SWOT-style synthesis by company
J&J operates as an international healthcare organization that derives dependable earnings from manufacturing pharmaceuticals, medical equipment, and personal health product lines. Through its balanced business structure, this company protects itself from market fluctuations affecting individual business areas, making it an attractive investment opportunity [11]. The recovery potential is strengthened because of the company's regular profits, excellent inventory turnover, and broad worldwide distribution capabilities. Amgen continues demonstrating robust innovation and aggressive acquisition methods because it recently purchased Horizon Therapeutics for $27.8 billion to increase its offerings in rare diseases and autoimmune conditions. The higher financial advantage at Amgen enables strong control centralization to execute M&A acquisitions and push international business growth [12].
The antiviral HIV and hepatitis C prescription medications drive Gilead Sciences' strength through a substantial legacy product section. The business confronts a pipeline sustainability challenge because its main drugs earn declining revenue, and the pipeline of forthcoming products appears meager. After the fast response to the pandemic through Remdesivir, the company needs to refresh its pipeline and broaden its business strategy for sustainable long-term growth. Regeneron is an innovative research and development company that exhibits quick clinical advancement and sturdy asset conversion. Eylea is the primary blockbuster drug on which the company heavily relies, creating an undesirable concentration of risk [13]. The company maintains limited global influence due to its small size and primarily serving the U.S. market, but the Roche partnership offers potential expansion opportunities worldwide.
4.2. Cross-company comparison framework
According to Table 3, Assessing risk against growth prospects from a decision matrix identifies J&J as the safe and reliable option, but Amgen is an enterprise showing potential growth with moderate dangers. At the same time, Gilead comes across as a mature company with a constrained pipeline. Regeneron shows upper-level growth at high risk because its foundation combines research and development with minimal revenue streams [14].
Table 3: Strategic positioning matrix
Company | Risk Profile | Growth Potential | Portfolio Balance |
J&J | Low | Moderate | Highly Diversified |
Amgen | Medium | High | Innovation-Driven |
Gilead | Medium | Low-Moderate | Legacy-Focused |
Regeneron | High | High | R&D-Centric, Narrow |
5. Conclusion
Due to its stable dividend payouts, together with strong free cash flow and diverse healthcare segment revenue streams, Johnson & Johnson (J&J) offers conservative investors their top selection. The risk-averse model of this company makes it the perfect choice for preserving capital over the long term. Investors motivated by capital growth will probably choose Amgen and Regeneron since these companies present considerable market potential. Amgen's acquisition of Horizon Therapeutics indicates tactical growth in immunology and rare disease sectors, yet Regeneron demonstrates its potential for fast growth with elevated risk levels. Investors could balance their portfolios by uniting Johnson & Johnson with Amgen or Gilead. At the same time, Johnson & Johnson's stability would help reduce volatility, and the pipeline growth of Amgen or Gilead would lead to potential upward trends. To assess pharma stock value properly, one must view the entire picture, combining corporate research capabilities, operational flexibility, and fundamental financial performance metrics. Investors obtain better knowledge about healthcare transformations through this assessment method. This financial analysis serves investors as a multiple-dimensional evaluation instrument to measure pharmaceutical business success through profitability and solvency rates, growth metrics, and operational performance outputs. The study presents J&J, Amgen, Gilead, and Regeneron as companies with different risk-return profiles, where J&J demonstrates safe stabilities while Regeneron takes high risks for innovative play. This financial and strategic assessment method enables investors to select investments that align with their comfort levels and market conditions. A thorough evaluation method is necessary during market instability to help pharmaceutical players make effective decisions about their emerging opportunities and obstacles.
References
[1]. Bhandari, S., Showers, V., & Johnson-Snyder, A. (2019). A comparison: Accrual versus cash flow-based financial measures' performance in predicting business failure. Journal of Accounting & Finance, 19(6).
[2]. Caraballo, C., Valero-Elizondo, J., Khera, R., Mahajan, S., Grandhi, G. R., Virani, S. S., & Nasir, K. (2020). Burden and consequences of financial hardship from medical bills among nonelderly adults with diabetes mellitus in the United States. Circulation: Cardiovascular Quality and Outcomes, 13(2), e006139.
[3]. Dalton, D. R., Daily, C. M., Ellstrand, A. E., & Johnson, J. L. (1998). Meta‐analytic reviews of board composition, leadership structure, and financial performance. Strategic Management Journal, 19(3), 269–290.
[4]. Dixon-Fowler, H. R., Slater, D. J., Johnson, J. L., Ellstrand, A. E., & Romi, A. M. (2013). Beyond “does it pay to be green?” A meta-analysis of moderators of the CEP–CFP relationship. Journal of Business Ethics, 112, 353–366.
[5]. Dong, Y., Skowronski, K., Song, S., Venkataraman, S., & Zou, F. (2020). Supply base innovation and firm financial performance. Journal of Operations Management, 66(7–8), 768–796.
[6]. Gray, J. V., Skowronski, K., Esenduran, G., & Rungtusanatham, M. J. (2013). The reshoring phenomenon: What supply chain academics ought to know and should do. Journal of Supply Chain Management, 49(2), 27–33.
[7]. Herman, D., Kańduła, M. M., Freitas, L. G. A., van Dongen, C., Le Van, T., & Marchal, K. (2023). Leveraging Cell Painting images to expand the applicability domain and actively improve deep learning quantitative structure–activity relationship models. Chemical Research in Toxicology, 36(7), 1028–1036.
[8]. Johnson, S. A. (1997). An empirical analysis of the determinants of corporate debt ownership structure. Journal of Financial and Quantitative Analysis, 32(1), 47–69.
[9]. Katz-Navon, T., Naveh, E., & Stern, Z. (2009). Active learning: When is more better? The case of resident physicians’ medical errors. Journal of Applied Psychology, 94(5), 1200.
[10]. Katz-Navon, T., Naveh, E., & Stern, Z. (2009). Active learning: When is more better? The case of resident physicians’ medical errors. Journal of Applied Psychology, 94(5), 1200.
[11]. Padgett, J. L., & Sheng, Q. (2018). Numerical solution of degenerate stochastic Kawarada equations via a semi-discretized approach. Applied Mathematics and Computation, 325, 210–226.
[12]. Shaw, J. D., Duffy, M. K., Johnson, J. L., & Lockhart, D. E. (2005). Turnover, social capital losses, and performance. Academy of Management Journal, 48(4), 594–606.
[13]. Sisaye, S., & Turcsanyi, J. (2023). Corporate social responsibility and its link to financial performance: Application to Johnson & Johnson, a pharmaceutical company. Journal of Business Ethics, 180(1), 123–140.
[14]. Song, S., Lian, J., Skowronski, K., & Yan, T. (2024). Customer base environmental disclosure and supplier greenhouse gas emissions: A signaling theory perspective. Journal of Operations Management, 70(3), 355–380.
Cite this article
Xu,J. (2025). Strategic Investment Decisions in the Post-Pandemic Pharmaceutical Market: A Case Study of Johnson & Johnson, Amgen, Gilead Sciences, and Regeneron Pharmaceuticals. Advances in Economics, Management and Political Sciences,185,151-159.
Data availability
The datasets used and/or analyzed during the current study will be available from the authors upon reasonable request.
Disclaimer/Publisher's Note
The statements, opinions and data contained in all publications are solely those of the individual author(s) and contributor(s) and not of EWA Publishing and/or the editor(s). EWA Publishing and/or the editor(s) disclaim responsibility for any injury to people or property resulting from any ideas, methods, instructions or products referred to in the content.
About volume
Volume title: Proceedings of ICEMGD 2025 Symposium: Innovating in Management and Economic Development
© 2024 by the author(s). Licensee EWA Publishing, Oxford, UK. This article is an open access article distributed under the terms and
conditions of the Creative Commons Attribution (CC BY) license. Authors who
publish this series agree to the following terms:
1. Authors retain copyright and grant the series right of first publication with the work simultaneously licensed under a Creative Commons
Attribution License that allows others to share the work with an acknowledgment of the work's authorship and initial publication in this
series.
2. Authors are able to enter into separate, additional contractual arrangements for the non-exclusive distribution of the series's published
version of the work (e.g., post it to an institutional repository or publish it in a book), with an acknowledgment of its initial
publication in this series.
3. Authors are permitted and encouraged to post their work online (e.g., in institutional repositories or on their website) prior to and
during the submission process, as it can lead to productive exchanges, as well as earlier and greater citation of published work (See
Open access policy for details).
References
[1]. Bhandari, S., Showers, V., & Johnson-Snyder, A. (2019). A comparison: Accrual versus cash flow-based financial measures' performance in predicting business failure. Journal of Accounting & Finance, 19(6).
[2]. Caraballo, C., Valero-Elizondo, J., Khera, R., Mahajan, S., Grandhi, G. R., Virani, S. S., & Nasir, K. (2020). Burden and consequences of financial hardship from medical bills among nonelderly adults with diabetes mellitus in the United States. Circulation: Cardiovascular Quality and Outcomes, 13(2), e006139.
[3]. Dalton, D. R., Daily, C. M., Ellstrand, A. E., & Johnson, J. L. (1998). Meta‐analytic reviews of board composition, leadership structure, and financial performance. Strategic Management Journal, 19(3), 269–290.
[4]. Dixon-Fowler, H. R., Slater, D. J., Johnson, J. L., Ellstrand, A. E., & Romi, A. M. (2013). Beyond “does it pay to be green?” A meta-analysis of moderators of the CEP–CFP relationship. Journal of Business Ethics, 112, 353–366.
[5]. Dong, Y., Skowronski, K., Song, S., Venkataraman, S., & Zou, F. (2020). Supply base innovation and firm financial performance. Journal of Operations Management, 66(7–8), 768–796.
[6]. Gray, J. V., Skowronski, K., Esenduran, G., & Rungtusanatham, M. J. (2013). The reshoring phenomenon: What supply chain academics ought to know and should do. Journal of Supply Chain Management, 49(2), 27–33.
[7]. Herman, D., Kańduła, M. M., Freitas, L. G. A., van Dongen, C., Le Van, T., & Marchal, K. (2023). Leveraging Cell Painting images to expand the applicability domain and actively improve deep learning quantitative structure–activity relationship models. Chemical Research in Toxicology, 36(7), 1028–1036.
[8]. Johnson, S. A. (1997). An empirical analysis of the determinants of corporate debt ownership structure. Journal of Financial and Quantitative Analysis, 32(1), 47–69.
[9]. Katz-Navon, T., Naveh, E., & Stern, Z. (2009). Active learning: When is more better? The case of resident physicians’ medical errors. Journal of Applied Psychology, 94(5), 1200.
[10]. Katz-Navon, T., Naveh, E., & Stern, Z. (2009). Active learning: When is more better? The case of resident physicians’ medical errors. Journal of Applied Psychology, 94(5), 1200.
[11]. Padgett, J. L., & Sheng, Q. (2018). Numerical solution of degenerate stochastic Kawarada equations via a semi-discretized approach. Applied Mathematics and Computation, 325, 210–226.
[12]. Shaw, J. D., Duffy, M. K., Johnson, J. L., & Lockhart, D. E. (2005). Turnover, social capital losses, and performance. Academy of Management Journal, 48(4), 594–606.
[13]. Sisaye, S., & Turcsanyi, J. (2023). Corporate social responsibility and its link to financial performance: Application to Johnson & Johnson, a pharmaceutical company. Journal of Business Ethics, 180(1), 123–140.
[14]. Song, S., Lian, J., Skowronski, K., & Yan, T. (2024). Customer base environmental disclosure and supplier greenhouse gas emissions: A signaling theory perspective. Journal of Operations Management, 70(3), 355–380.