


1. Introduction
1.1. Background
With the growth of the global economy and the aggravation of population aging, the demand in the medical production and health-care service is constantly increasing, which has driven the rapid expansion of the pharmaceutical market. However, the pharmaceutical industry also faces various challenges, especially the patent expiration and fierce competition from generic drugs. After their core products’ patents expire, the market share of these companies may be seized by generic drugs soon, which poses a severe test to their ability of profitability. In this situation, the four pharmaceutical giants, AbbVie, Johnson & Johnson, Pfizer and Merck have occupied a significant position in the industry due to their profound technological accumulation, strong R&D capabilities, and extensive market layout. These firms not only pay attention to regular areas but also actively look into new tech which will guide the industry's development.
1.2. Research purpose
This paper looks into the differences and traits of the four big drug companies, AbbVie, Johnson & Johnson, Pfizer and Merck and analyzes their financial status, market performance and future strategies. By analyzing financial data, market trends and strategic plans of these companies over recent years, this paper shows their different strategies and advantages in dealing with industry challenges [1]. The result may give investors a basis of decision making which helps to know the drug industry's competition and chances. It also offers ideas to industry rivals for strategy improvement. Plus, it gives trendy insights for the industry's growth.
1.3. Research content
This article is mainly composed of five parts. First, the introduction part provides an overview of the research background and purpose, laying the foundation for the subsequent content.The second part conducts an in-depth analysis of the financial conditions of the four companies, including key indicators such as balance sheets, income statements and cash flows which reveals the financial health and development potential of each company. The third part focuses on market performance, the competitive landscape, and the market influence of each company and their target customer groups to analyze their positions and competitive advantages in the industry. The fourth part further focuses on future strategies, elaborating in detail on the specific plans and implementation paths of each company in terms of R&D investment and innovation, market expansion, and strategic cooperation, and looks forward to their future development directions. Finally, the fifth part summarizes the entire text, draws conclusions by integrating the contents of each part, and offers suggestions for possible future research directions.
2. Financial position comparative analysis
2.1. Profitability
The effectiveness of business operation and the profitability of capital are usually reflected through the ability of profitability [2]. This study takes net margin, gross margin and ROA as core indicators to conduct a comparative analysis of the profit conditions of AbbVie, Johnson & Johnson, Pfizer and Merck from 2019 to 2023.
Table 1: Comparison of the four companies’ profitability indicators (average value from 2019 to 2023)
Company Name | Net Margin(%) | Gross Margin(%) | ROA(%) |
AbbVie | 8.97 | 62.42 | 3.56 |
Johnson & Johnson | 18.3 | 66.8 | 9.2 |
Pfizer | 27.5 | 70.2 | 8.7 |
Merck | 19.8 | 71.3 | 7.8 |
According to Table 1, the four companies each have their own characteristics in terms of profitability. Pfizer had the highest net profit margin at 27.5%, mainly due to the outstanding performance of its best-selling drugs and effective cost control. Johnson & Johnson's net profit margin is relatively low, but its ROE is only slightly lower than that of Roche, indicating that it has certain advantages in asset utilization. AbbVie’s gross profit margin and return on assets are particularly outstanding, reaching 62.42% and 3.56% respectively, reflecting the optimization of product structure and the improvement of asset utilization efficiency. Although Merck's various indicators do not have obvious highlights, its overall performance is stable.
As Figure 1 shows, the profitability of these companies has changed differently over the past five years. Pfizer’s net margin began to decline after reaching a peak in 2022, mainly due to fluctuations in sales of COVID-19 vaccines and treatment drugs. Johnson & Johnson divested its healthcare business, to concentrate its resources on the development of the pharmaceutical and medical device sectors, which gradually makes its profit level rise. Despite the challenge of patent expiration for its core products, AbbVie has maintained a certain level of profitability and market competitiveness by continuously investing in research and strategically expanding business. Merck has maintained a relatively stable profit status by relying on continuous product innovation and market expansion.
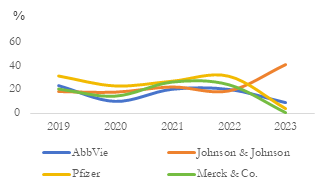
Figure 1: Dynamic changes in net margin
Photo credit: original
2.2. Solvency indicators
The ability of an enterprise to fulfill its debt obligations reflects its debt-paying capacity, which is a key indicator for measuring financial risks [3]. This study focuses on the solvency of four companies by taking the debt-to-asset ratio, current ratio and interest coverage ratio as core indicators [4].
Table 2: Comparison of the four companies’ solvency indicators (average value from 2019 to 2023)
Company Name | D/A(%) | CR | ICR |
AbbVie | 92.28 | 1.10 | 3.87 |
Johnson & Johnson | 49.2 | 1.78 | 22.6 |
Pfizer | 58.7 | 1.42 | 15.3 |
Merck | 45.6 | 1.29 | 18.7 |
The data in Table 2 indicates that the four companies generally have strong debt-paying capabilities, but there are some differences. Johnson & Johnson has a current ratio of 1.78, the strongest short-term solvency ability, a D/A ratio of 49.2%, and an interest coverage ratio of 22.6 times, which means it has certain advantages in asset utilization and profit coverage of interest expenses [5]. Pfizer’s D/A ratio is 58.7%, which is relatively high. However, its interest coverage ratio still remains at a high level, indicating that despite having a significant amount of debt, the company has sufficient profits to cover its interest expenses [6].AbbVie has the highest D/A ratio, reaching 92.28%, but its interest coverage ratio is 3.87 times, indicating that it still has a certain ability to cover its interest expenses [6]. Merck's various indicators are relatively balanced, demonstrating a stable financial strategy.
The solvency indicators of these companies have shown different trends of change over the past five years. Pfizer's D/A ratio has increased due to its increased investment in acquisition and R&D. However, by adjusting its debt structure, it still maintains a strong solvency. Johnson & Johnson has been continuously improving its financial structure through business restructuring and asset optimization, and its solvency has gradually strengthened. Despite the challenge of patent expiration for its core products, AbbVie has maintained a certain debt paying capacity by continuously investing in R&D and strategically acquiring new fields. Merck, on the other hand, has sustained a relatively stable debt-paying capacity by relying on continuous product innovation and market expansion.
2.3. Operational efficiency
The operational efficiency of an enterprise reflects its ability in asset management and operation [7]. This study takes inventory turnover rate, accounts receivable turnover rate and total asset turnover rate as key indicators [8] to analyze the operational efficiency of the four companies.
Table 3: Comparison of the four companies’ operational efficiency indicators (average value from 2019 to 2023)
Company Name | ITO | ART | TAT |
AbbVie | 1.8 | 5.5 | 0.35 |
Johnson & Johnson | 3.2 | 5.9 | 0.51 |
Pfizer | 2.8 | 6.7 | 0.42 |
Merck | 2.5 | 6.2 | 0.40 |
The data in Table 3 indicates that the four companies have different operational efficiencies. Johnson & Johnson performs the best, with the highest inventory turnover rate, accounts receivable turnover rate, and total asset turnover rate, reaching 3.2 times, 5.9 times, and 0.51 times respectively. This reflects its significant advantages in supply chain management, sales collection and asset utilization [9]. Pfizer's accounts receivable turnover ratio reached 6.7 times, demonstrating a certain advantage in sales collection management. AbbVie and Merck's various indicators are relatively lower, suggesting that there is still room for improvement in operational efficiency.
These companies have shown different changes in their operational efficiency over the past five years. Pfizer has made its supply chain and inventory better, so its inventory turnover rate has gone up each year. Johnson & Johnson has improved its sales and customer credit management, causing its accounts receivable turnover rate to rise. AbbVie and Merck have kept their operational efficiency pretty stable through ongoing improvements.
All four companies have maintained a high level of operational efficiency, which matches their top positions in the industry. But differences in specific indicators show the companies have different operational strategies and management priorities. In the future, these companies could boost their operational efficiency by using digital transformation, improving their supply chain, and applying lean management. This would help them deal with the growing competition in the market. [10].
3. Market performance
3.1. Pattern of market competition
Competition in the global medical and pharmaceutical market is becoming increasingly complex. AbbVie, Johnson & Johnson, Pfizer and Merck are the giants in the industry and play significant roles in the market. Data shows that the global pharmaceutical market size reached 1.5 trillion US dollars in 2022 and is expected to reach 1.9 trillion US dollars by 2027, with a compound annual growth rate of approximately 4.8%. The market performance of these four companies each has its own characteristics.
Table 4: Comparison of the four companies’ market shares (average value from 2019 to 2023)
Company Name | Global market share(%) | advantageous field |
AbbVie | 3.5 | Immunology |
Johnson & Johnson | 4.7 | Medical Equipment, Pharmaceuticals |
Pfizer | 5.8 | Vaccine, Angiocarpy, Anti-infective drugs |
Merck | 3.9 | Oncology, Immunity |
Table 4 shows that Pfizer has the largest market share among the four companies, at 5.8%, a result mainly attributed to its outstanding performance in COVID-19 vaccines and therapeutic drugs. Despite having recently sold its consumer health business department, Johnson & Johnson still maintained a 4.7% market share by relying on its strengths in the medical device and pharmaceutical sectors. AbbVie has performed outstandingly in the field of immunology, with its revenue in this area far ahead of others. Humira still topped the global immunology product list with sales of 14.404 billion US dollars. Merck has strong competitiveness in the fields of oncology and immunology, which is related to its innovative products and market expansion strategies.
The market share trends of these four companies are different. Pfizer's market share has gone up a lot over the past two years because of its COVID-19 related products. But it might grow more slowly in the future. Johnson & Johnson has adjusted its business. It has focused on high growth areas like drugs and medical devices. So it is expected to expand its market share in the coming years. AbbVie has faced the challenge of patent expiration for its core products. But it has kept a certain level of market competitiveness. It has done this by investing in R&D and making strategic acquisitions to move into new areas. Merck, on the other hand, has kept a stable market position. It has relied on continuous product innovation and market expansion to do this [11].
3.2. Market onfluence
The comprehensive strength of medical and pharmaceutical companies can be measured by their market influence, which not only demonstrates the brand value of the enterprise but also reflects its position in the industry [12]. This study conducted an assessment and analysis of AbbVie, Johnson & Johnson, Pfizer and Merck from multiple aspects including brand value, innovation capability and social responsibility performance.
Table 5: Comparison of the four companies’ market influence indicators (2022)
Company Name | Brand value ranking | R&D Ratio (%) | Social responsibility score |
AbbVie | 5 | 22.7 | 84 |
Johnson & Johnson | 1 | 14.7 | 89 |
Pfizer | 2 | 21.3 | 85 |
Merck | 6 | 18.5 | 86 |
The brand value ranking is from Brand Finance's Global Pharmaceutical Brand 500, while the social responsibility score is from MSCI ESG Ratings.
The data in Table 5 indicates that the four companies each have distinct characteristics in terms of market influence. Johnson & Johnson ranks first on the brand value list due to its diversified business structure and long-accumulated brand advantages, and its performance in social responsibility is also very impressive. Pfizer stands out for its high investment in research and development, with its R&D ratio accounting for 21.3% of its sales revenue, demonstrating its strong emphasis on innovation. Merck, on the other hand, has strong competitiveness in the fields of oncology and immunology, which is related to its innovative products and market expansion strategies.
Johnson & Johnson has achieved remarkable innovation results in the fields of medical technology and pharmaceuticals. For instance, it has launched the MONARCH® Transcatheter Robotic System and other products, which have advanced the progress in areas such as surgical operations.Pfizer has performed strongly in vaccine and innovative drug research and development, especially driven by the success of its COVID-19 vaccine, further consolidating its leading position in the specialty drug market. Merck has demonstrated its influence on social responsibility through commonweal activities and environmental protection measures.
3.3. Consumer group
The customer base of medical and pharmaceutical companies includes medical institutions, doctors, patients, as well as government and insurance agencies, etc. Understanding the characteristics of the customer base is of great significance for judging the company's performance in the market [13]. This study compares the characteristics of the customer groups of four companies by analyzing aspects such as their product composition, sales channels and customer satisfaction.
Table 6: Comparison of the four companies’ market influence indicators
Company Name | Main customer groups | Diversity of sales channels | Customer satisfaction score |
AbbVie | Hospitals and specialized clinics | 8 | 84 |
Johnson & Johnson | Hospitals, customers, and clinics | 9 | 88 |
Pfizer | Hospital and drug stores | 8 | 86 |
Merck | Hospitals and specialized clinics | 7 | 85 |
Table 6 shows that the customer group characteristics of the four companies are different from each other. Johnson & Johnson stands out for its business diversification and the broadest customer base, encompassing hospitals, consumers, and clinics, etc. It also excels in the diversity of its sales channels. Pfizer’s major clients are mainly concentrated in hospitals and retail pharmacies, which is related to the dominance of its prescription drug business. AbbVie and Merck, on the other hand, have a strong client base in specialized clinics, which is associated with their focus on specific therapeutic areas.
All four companies performed well in terms of customer satisfaction, but there were some minor differences. Johnson & Johnson ranked first with a score of 88, which might be attributed to its rich product variety and comprehensive customer service. Pfizer ranked second with a customer satisfaction score of 86 points, demonstrating its service strength in the professional field. AbbVie and Merck scored slightly lower but still remained at a relatively high level.
4. Strategic planning
4.1. R&D and innovation strategy
Pfizer focuses its R&D efforts on areas such as oncology, immunology and inflammation, and rare diseases. The company combines internal R&D with external collaborations to accelerate the development of innovative drugs. Johnson & Johnson adopts a diversified R&D approach, covering multiple directions such as medical devices, pharmaceuticals and consumer goods, in order to reduce risks and seize more opportunities. AbbVie continues to make efforts in fields such as immunology and hematological oncology, and expands its R&D field through cooperation and acquisition. Merck is concentrating its efforts on developing cutting-edge technologies such as cell and gene therapies, while also actively exploring the application of digital healthcare.
Table 7: Comparison of the four companies’ R&D investment (2023)
Company Name | R&D investment (in billions of US dollars) | R&D ratio | numbers of ongoing research projects |
AbbVie | 140 | 23.3% | 200 |
Johnson & Johnson | 172.32 | 14.4% | 250 |
Pfizer | 108.22 | 17.0% | 95 |
Merck | 100.22 | 19.9% | 160 |
Table 7 shows that R&D ratio of the four companies all exceeds 14%, maintaining a relatively high level of investment. AbbVie has the highest total R&D investment, but due to its diversified business, the proportion is relatively low. Merck has the highest R&D investment intensity, indicating that it attaches great importance to innovation. Pfizer and Johnson & Johnson have similar R&D investments, but the number of ongoing projects varies, reflecting the difference in their R&D strategy.
4.2. Market expansion strategy
Pfizer focuses on expanding its market in emerging markets and digital transformation. The company has strengthened its layout in emerging markets such as China and India by building local production and sales networks. At the same time, it has signed strategic cooperation agreements with partners such as Sinopharm Group Co., Ltd. and China Resources Guangdong Pharmaceutical Co., Ltd. to explore innovative access and payment models and accelerate the introduction of innovative drugs.Johnson & Johnson, taking the advantage of its diversified business, expands its market coverage through cross selling and brand synergy.Meanwhile,it meets the evolving needs of patients and the public health system through accelerating the implementation of its digital strategy [14]. AbbVie is deepening its cooperative relationship with China's biopharmaceutical industry chain to promote more products to be launched simultaneously in China and globally and meet the medical needs of Chinese patients in a faster and more efficient way. Merck choose to enter new therapeutic areas and geographical markets through strategic cooperation and M&A approaches
Table 8: Comparison of the four companies’ key points for market expansion (2023)
Company Name | Proportion of sales in EM | DM investment | Numbers of strategic cooperation / M&A |
AbbVie | 25% | High | 5 |
Johnson & Johnson | 23% | Medium | 3 |
Pfizer | 28% | High | 6 |
Merck | 20% | Medium to high | 4 |
Table 8 shows that all four companies are striving to expand into emerging markets, with Pfizer and AbbVie having a more prominent sales share in these markets.Pfizer and AbbVie have invested far more in digital marketing than other companies, indicating their high attention for digital transformation. Johnson & Johnson and Merck frequently engage in strategic partnerships and M&A, indicating their strategic intention to achieve rapid expansion by using external resources.
4.3. Financial strategy
Pfizer focuses on improving ROA ratio to enhance its profitability by strictly controlling costs and optimizing assets. Johnson & Johnson has adopted a diversified investment strategy through business portfolio management to mitigate risks and achieve stable growth. AbbVie has strengthened its capital structure and increased EPS through continuous stock share repurchases and stable dividend payments. Merck has expanded its product line and entered new markets through active mergers and acquisitions, relying on external growth.
Table 9: Comparison of the four companies’ financial strategy (2023)
Company Name | Net Profit Margin | D/A Ratio | Return on R&A investment |
AbbVie | 7.6% | 92% | 13% |
Johnson & Johnson | 20% | 55% | 13% |
Pfizer | 22% | 58% | 15% |
Merck | 21% | 50% | 16% |
Table 9 shows that the financial indicators of the four companies are all performing well. Pfizer has the highest net profit margin at 22%, mainly due to the outstanding performance of its best-selling drugs and effective cost control. Johnson & Johnson have a relatively low D/A ratio of 55%, indicating a relatively stable financial position. AbbVie has the highest D/A ratio, reaching 92.28%, but it has strengthened its capital structure and increased earnings per share through share repurchases and stable dividend payments. Merck has the highest return on R&D investment at 16%, demonstrating its efficient investment and innovative achievements in research and development.
The four companies have formulated corresponding strategies in terms of R&D innovation, market expansion and financial management based on their own characteristics, which provide a solid foundation for their sustainable development in the future.
5. Conclusion
This paper looks at the financial conditions, market performance, and strategic plans of AbbVie, Johnson & Johnson, Pfizer, and Merck. It compares their strengths and weaknesses.
These four companies are all big and have their own unique advantages in the global drug industry. But each also has its own challenges and opportunities. In the future, they need to make more precise strategic plans based on their own traits and market trends. At the same time, strengthening R&A innovation, market expansion, and financial management is also significant for achieving sustainable development, enhancing competitiveness, and creating more value for investors and industry.
The medical and drug industry is changing fast. New technologies like artificial intelligence and gene editing are being used more and more. Also, global health events and the policy environment are changing. These things force the four companies to adjust and optimize their own strategies to deal with future challenges and opportunities. The ability to keep innovating, the flexibility of market strategies, and the stability of financial management will directly affect whether these giants can stay competitive in the long-term race.
This research gives a systematic analytical framework for assessing the overall capabilities of large medical and drug companies. This framework not only helps related companies make strategic decisions and do competitive analysis but also offers important references for investors and policymakers. Future research can further explore how emerging technologies shape the industry and focus on how leading companies balance globalization and localization to better understand the direction of the medical and drug industry.
References
[1]. Deng Y., Liu J., & Chen Z. (2024). Analysis and Countermeasures of Profitability of Company G. Marketing World, (24), 158-160.
[2]. Chen D. (2024). Analysis of Corporate Profitability—A Case Study of Company A. Marketing of Long-Standing Brand, (16), 72-74.
[3]. Zhang J.(2024). Debt-Paying Ability Analysis of Huaguan Technology Company. Hebei Enterprise, (07), 116-118.
[4]. Yan Y. (2024). Debt-Paying Ability Analysis of Joyoung Co., Ltd. Investment and Cooperation, (04), 140-142.
[5]. Zhu Y. (2024). Comparative Analysis of Financial Statements of Listed Companies—A Case Study of Company JN. China Management Informationization, 27(04), 7-9.
[6]. Shi Y., & Li S. (2024). Financial Capability Analysis of Listed Companies—A Case Study of Company G. Management and Technology of Small and Medium Enterprises, (03), 187-189.
[7]. Wang Q., & Chen Y. (2024). Financial Statement Analysis. Chemical Industry Press.
[8]. Wei Z., & Yang C. (2024). Research on Operational Efficiency and Its Influencing Factors of Chinese Airlines. Productivity Research, (01), 115-120.
[9]. Zhang J., & Ma C. (2019). Financial Indicator Analysis of Company ZK. Modern Business, (30), 144-145.
[10]. Gong L., & Jiang W. (2023). Evaluation of Operational Efficiency of Listed Companies in Consumer Electronics Industry. Journal of Langfang Normal University (Natural Science Edition), 23(04), 87-94.
[11]. Hu Y., He X., Fan H. , Gao Z. , & Wang D. (2022). Financial Capability Analysis of Company Y. Marketing World, (11), 98-100.
[12]. Ahuja V. (2012). Market Influence Analytics in a Digital Ecosystem.International Journal of Online Marketing (IJOM),2(4),42-53.
[13]. Wang Q., & Yin Z. (2018). Research on Comprehensive Capability Analysis of Enterprises—A Case Study of Auto Parts Listed Companies. Industry and Technology Forum, 17(21), 79-80.
[14]. Wireless News. (2025). Pfizer Invites Public to View and Listen to Webcast of Pfizer Discussion at Healthcare Conference.
Cite this article
Yong,Y. (2025). A Comprehensive Capability Analysis of Four Medical and Pharmaceutical Companies. Advances in Economics, Management and Political Sciences,185,52-60.
Data availability
The datasets used and/or analyzed during the current study will be available from the authors upon reasonable request.
Disclaimer/Publisher's Note
The statements, opinions and data contained in all publications are solely those of the individual author(s) and contributor(s) and not of EWA Publishing and/or the editor(s). EWA Publishing and/or the editor(s) disclaim responsibility for any injury to people or property resulting from any ideas, methods, instructions or products referred to in the content.
About volume
Volume title: Proceedings of ICEMGD 2025 Symposium: Innovating in Management and Economic Development
© 2024 by the author(s). Licensee EWA Publishing, Oxford, UK. This article is an open access article distributed under the terms and
conditions of the Creative Commons Attribution (CC BY) license. Authors who
publish this series agree to the following terms:
1. Authors retain copyright and grant the series right of first publication with the work simultaneously licensed under a Creative Commons
Attribution License that allows others to share the work with an acknowledgment of the work's authorship and initial publication in this
series.
2. Authors are able to enter into separate, additional contractual arrangements for the non-exclusive distribution of the series's published
version of the work (e.g., post it to an institutional repository or publish it in a book), with an acknowledgment of its initial
publication in this series.
3. Authors are permitted and encouraged to post their work online (e.g., in institutional repositories or on their website) prior to and
during the submission process, as it can lead to productive exchanges, as well as earlier and greater citation of published work (See
Open access policy for details).
References
[1]. Deng Y., Liu J., & Chen Z. (2024). Analysis and Countermeasures of Profitability of Company G. Marketing World, (24), 158-160.
[2]. Chen D. (2024). Analysis of Corporate Profitability—A Case Study of Company A. Marketing of Long-Standing Brand, (16), 72-74.
[3]. Zhang J.(2024). Debt-Paying Ability Analysis of Huaguan Technology Company. Hebei Enterprise, (07), 116-118.
[4]. Yan Y. (2024). Debt-Paying Ability Analysis of Joyoung Co., Ltd. Investment and Cooperation, (04), 140-142.
[5]. Zhu Y. (2024). Comparative Analysis of Financial Statements of Listed Companies—A Case Study of Company JN. China Management Informationization, 27(04), 7-9.
[6]. Shi Y., & Li S. (2024). Financial Capability Analysis of Listed Companies—A Case Study of Company G. Management and Technology of Small and Medium Enterprises, (03), 187-189.
[7]. Wang Q., & Chen Y. (2024). Financial Statement Analysis. Chemical Industry Press.
[8]. Wei Z., & Yang C. (2024). Research on Operational Efficiency and Its Influencing Factors of Chinese Airlines. Productivity Research, (01), 115-120.
[9]. Zhang J., & Ma C. (2019). Financial Indicator Analysis of Company ZK. Modern Business, (30), 144-145.
[10]. Gong L., & Jiang W. (2023). Evaluation of Operational Efficiency of Listed Companies in Consumer Electronics Industry. Journal of Langfang Normal University (Natural Science Edition), 23(04), 87-94.
[11]. Hu Y., He X., Fan H. , Gao Z. , & Wang D. (2022). Financial Capability Analysis of Company Y. Marketing World, (11), 98-100.
[12]. Ahuja V. (2012). Market Influence Analytics in a Digital Ecosystem.International Journal of Online Marketing (IJOM),2(4),42-53.
[13]. Wang Q., & Yin Z. (2018). Research on Comprehensive Capability Analysis of Enterprises—A Case Study of Auto Parts Listed Companies. Industry and Technology Forum, 17(21), 79-80.
[14]. Wireless News. (2025). Pfizer Invites Public to View and Listen to Webcast of Pfizer Discussion at Healthcare Conference.