


1. Introduction
In the digital economy era, social media platforms such as Weibo, Facebook, and X have emerged as essential channels for both the public and investors to express emotions and disseminate market information. Investors frequently share their market insights and sentiments on these platforms, and such emotional expressions can rapidly spark media buzz and create massive waves online. Negative rumors, in particular, can swiftly and significantly impact stock market returns. Consequently, social media sentiment has increasingly attracted attention [1].
Existing studies have explored the relationship between social media content and stock market performance. For example, some researches noted that under the influence of social media, investors are more likely to be affected by others' opinions and emotions, leading to a herd effect that can cause abnormal price fluctuations [2]. Some studies found that investor sentiment can help predict short-term market movements [3]. While others further analyzed the predictive power of sentiment on market returns [4]. However, most of these studies focus on the indirect impact of social media content on stock prices through investor sentiment, lacking analysis of the direct relationship between social media sentiment and stock prices. In addition, some of the literature is outdated and does not reflect recent changes in the online environment; for instance, the study on the relationship between social media sentiment and stock returns may not apply to the current digital landscape [5].
This study aims to fill that gap by systematically examining the direct impact of social media sentiment on stock price changes in the context of the past five years and conducting quantitative analysis using machine learning models.
2. Methods
2.1. Dataset introduction and merged data example
This study uses an open-source dataset from Kaggle titled “Stock Tweets for Sentiment Analysis and Prediction.” The dataset contains a total of 81,331 tweets related to the 25 most followed stocks on Yahoo Finance from September 30, 2021 to September 30, 2022. It also includes 6,301 records of stock market price and trading volume data for corresponding dates and stocks [6].
The data used in this study comes from two files within the dataset: the social media tweets data (stock_tweets.csv) and the stock market data (stock_yfinance_data.csv).
To analyze the impact of social media sentiment on stock price fluctuations, these two datasets needed to be merged so that each tweet could be matched to the corresponding stock trading data at the relevant time.
The merge was ultimately completed using the merge_asof method (see Table 1).
Table 1: Merged data example
Date | Open | High | Low | Close | AdjClose | Volume | Sentiment |
2021-09-30 10:19:31 | 143.66 | 144.38 | 141.28 | 141.50 | 140.478485 | 89056700 | 0.250000 |
2021-09-30 10:22:53 | 143.66 | 144.38 | 141.28 | 141.50 | 140.478485 | 89056700 | -0.065043 |
2021-09-30 13:36:10 | 143.66 | 144.38 | 141.28 | 141.50 | 140.478485 | 89056700 | 0.000000 |
2021-09-30 15:30:03 | 143.66 | 144.38 | 141.28 | 141.50 | 140.478485 | 89056700 | 0.020833 |
2021-09-30 15:37:52 | 143.66 | 144.38 | 141.28 | 141.50 | 140.478485 | 89056700 | 0.000000 |
2021-09-30 18:01:19 | 143.66 | 144.38 | 141.28 | 141.50 | 140.478485 | 89056700 | -0.500000 |
2021-09-30 23:54:13 | 143.66 | 144.38 | 141.28 | 141.50 | 140.478485 | 89056700 | 0.000000 |
2021-10-01 00:15:01 | 141.90 | 142.92 | 139.11 | 142.65 | 141.620163 | 94639600 | -0.125000 |
2021-10-01 00:42:25 | 141.90 | 142.92 | 139.11 | 142.65 | 141.620163 | 94639600 | 0.261667 |
2021-10-01 02:01:00 | 141.90 | 142.92 | 139.11 | 142.65 | 141.620163 | 94639600 | 0.350000 |
2.2. Data preprocessing
To prepare the data for analysis, all date formats were standardized to ensure accurate matching and comparison across different time points. Time zone information was omitted to prevent misalignment issues arising from regional differences, thereby maintaining a uniform reference frame for all timestamps. For text preprocessing, spaCy was used to clean the tweet content by removing stop words, punctuation, special characters, and extra spaces. Lemmatization and named entity recognition (NER) were also applied to extract more valuable information. These steps helped reduce noise and improve data quality. During data parsing, invalid date entries were automatically converted to NaT (Not a Time) to prevent errors in time series analysis. Additionally, after generating the “Next_Close” field, rows without next-day stock price data were removed to maintain the completeness and consistency of the dataset.
2.3. Feature extraction
A review of relevant literature reveals that the LDA (Latent Dirichlet Allocation) model is effective for mining insights from online text data. This study applies the LDA model from the Gensim library to perform topic extraction on preprocessed tweet data [7]. Gensim, an open-source Python library specializing in natural language processing and topic modeling, provides efficient algorithmic implementations for automatically extracting latent topics and semantic structures from large text corpora. In this study, Gensim is utilized to model the topics of the processed tweets, helping to identify the main themes of discussion on social media. This approach aids in understanding the distribution of tweet content and offers valuable semantic features that contribute to further analysis of how social media sentiment influences stock prices.
Drawing on Aljedaani’s work on tweet sentiment analysis with TextBlob, this study adopts TextBlob to calculate the sentiment polarity of tweets and quantify their emotional tone [8]. TextBlob is a natural language processing library designed for text analysis tasks, offering built-in sentiment analysis functions that efficiently compute sentiment polarity (ranging from -1 to 1) and subjectivity scores. In this study, TextBlob is used to automatically assess the sentiment of tweets, providing quantitative metrics and data that support the analysis of the relationship between social media sentiment and fluctuations in the stock market.
2.4. Data analysis
2.4.1. Distribution of tweet counts for each stock
First, the number of tweets for each stock was counted using value_counts, and the proportion of each stock was calculated. Then, stocks with a proportion lower than a defined threshold (5%) were grouped into an "Others" category. This process resulted in Figure 1.
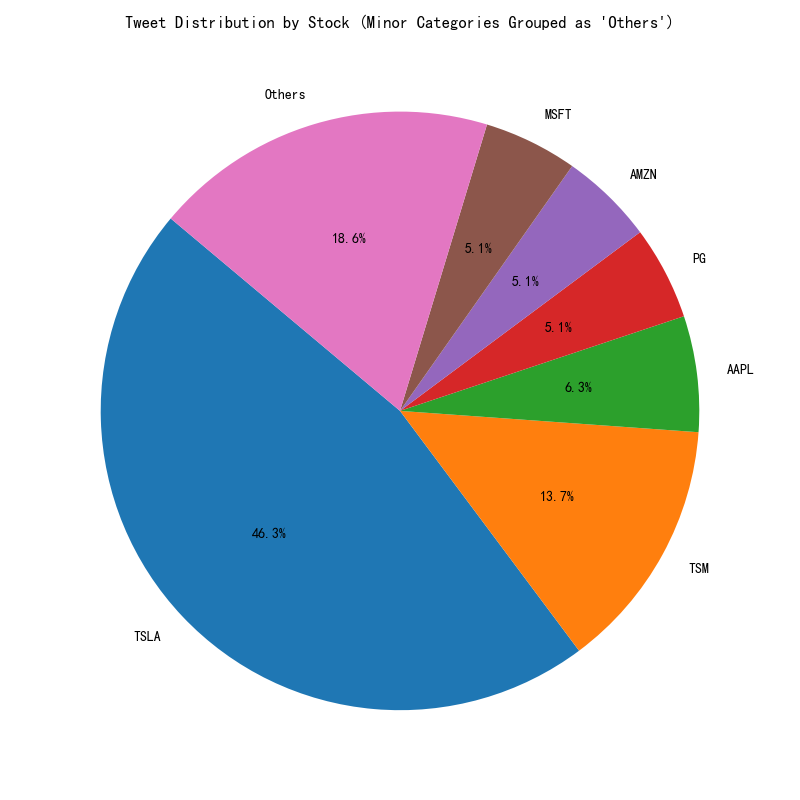
Figure 1: Tweet distribution by stock (minor categories grouped as 'others')
The Figure 1 indicates that TSLA stocks constitute the majority of the database, providing a robust and representative sample. Therefore, this study focuses on an in-depth analysis of TSLA stocks.
2.4.2. Stock data for each company
A function, plot_company_stock, was written to filter the corresponding stock data based on the stock name and calculate the 7-day moving average (7-day MA) to smooth the price fluctuations. Two curves were then plotted: a line chart to show the 7-day moving average, making it easier to observe the overall trend, and a scatter plot to display the actual Adj Close data, reflecting the daily stock prices. This process resulted in Figure 2.
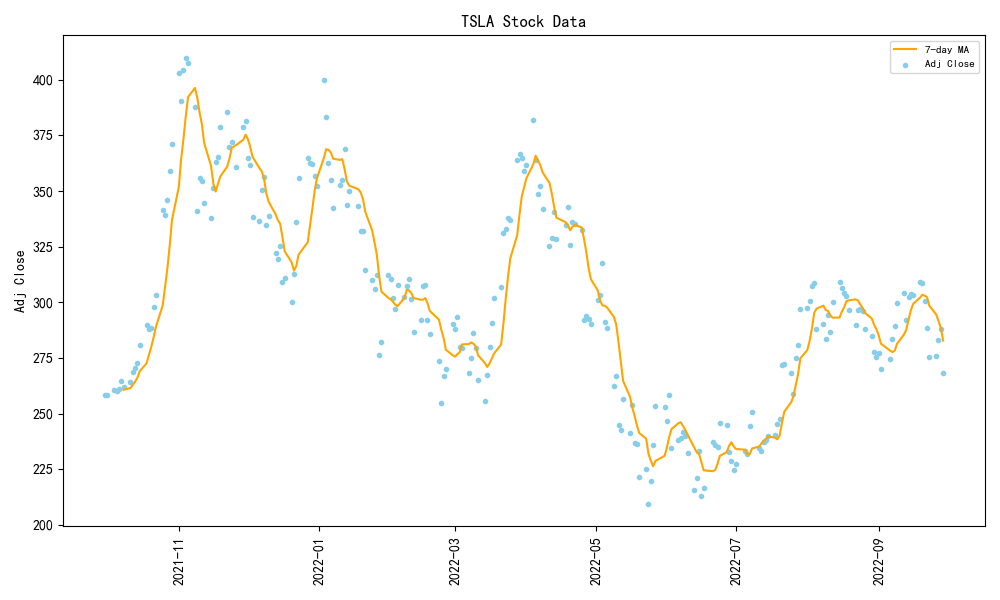
Figure 2: TSLA stock data
The Figure 2 displays the daily stock closing price trends for the involved company stocks from November 2021 to September 2022, including the yellow line representing the 7-day moving average. It can be seen that the yellow line closely follows the trend of the daily closing prices. By extracting the TSLA stock data, it can be observed that TSLA experienced significant fluctuations in stock price during this period, particularly a sharp decline from April to May 2022.
2.4.3. Statistics on the number of tweets from related companies
The dataset was organized by stock name and date to compute the daily tweet counts for each stock, resulting in a DataFrame with columns for stock name, date, and tweet count. A function named plot_company_tweets was then created to visualize this data,The data related to TSLA was extracted in the same way.leading to the generation of Figure 3.
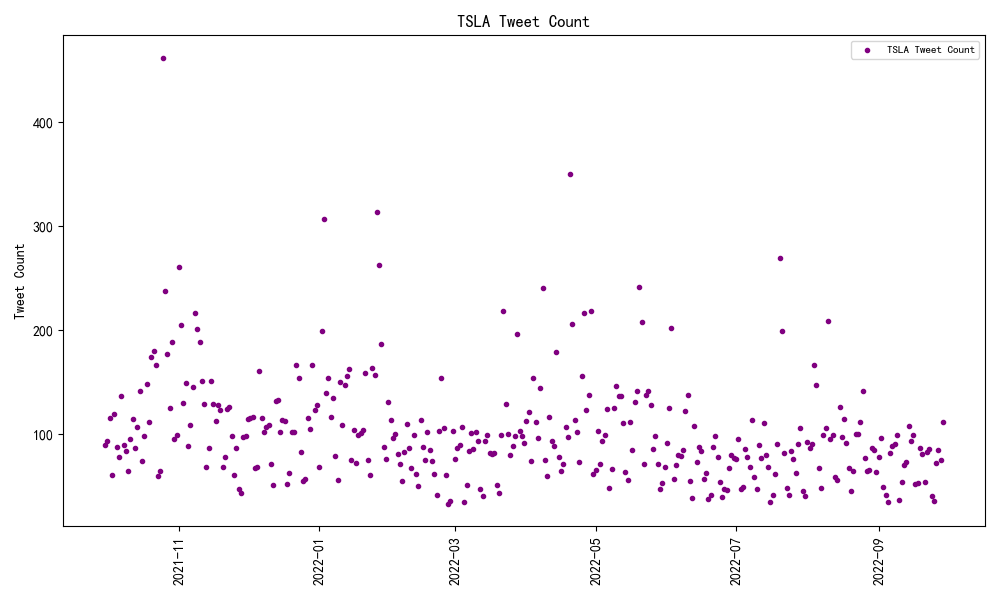
Figure 3: Number of tweets about TSLA
The Figure 3 shows the number of tweets related to the company stocks on social media from November 2021 to September 2022, with each purple dot representing the tweet count for the corresponding stock on a given day.
2.4.4. Data comparison
The top 5 points with the highest tweet counts were selected. Then, these points were compared and analyzed in relation to the TSLA stock data during this period (see Figure 4 and 5).

Figure 4: TSLA stock data
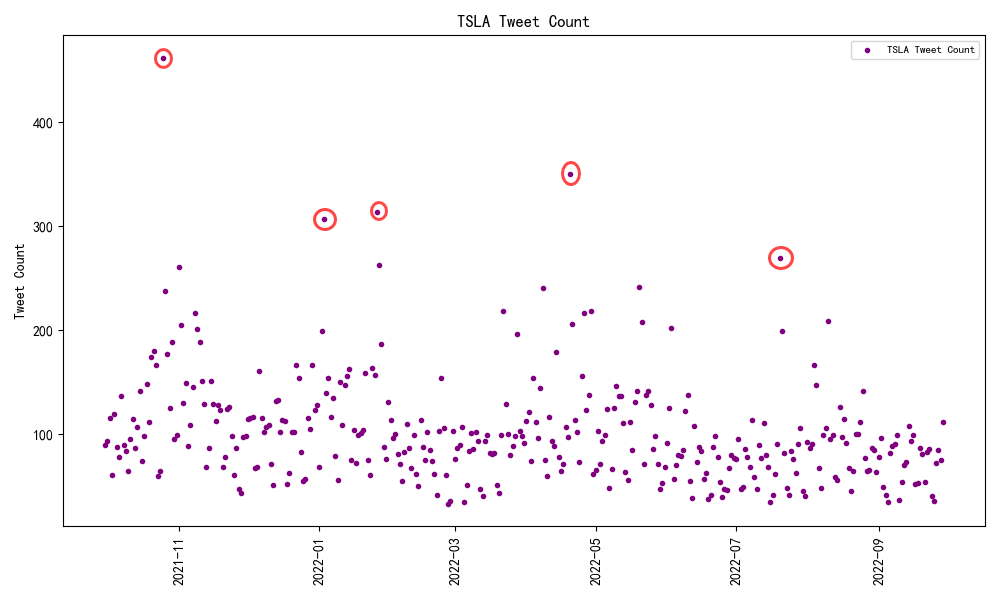
Figure 5: Tweet volume
The peaks in tweet count show a significant correlation with the large fluctuations in TSLA stock. For example, from October to November 2021, the tweet count reached its highest point, corresponding to the largest price increase in TSLA during this period, with the closing price rising from around $250 to over $400. Additionally, from April to May 2022, the tweet count reached its second-highest peak, while TSLA experienced the largest decline in stock price during the period covered by the data, with the closing price falling from around $375 to $200.
These time periods may correspond to key events influencing market fluctuations. The following are related reports:Between October and November 2021, Tesla's third-quarter deliveries exceeded 240,000 vehicles, significantly surpassing analyst expectations. This strong performance demonstrated Tesla's enhanced production and delivery capabilities, boosting investor confidence and contributing to a notable rise in the company's stock price.
In April 2022, Elon Musk announced plans to acquire Twitter for $44 billion. This move raised concerns among investors that Musk might need to sell Tesla shares to finance the acquisition, potentially diverting his attention from Tesla's operations. Consequently, Tesla's stock experienced a significant decline, with a 12.2% drop wiping $126 billion off its market value [9]. These instances illustrate how events disseminated through social media can influence investor sentiment, leading to substantial fluctuations in stock prices.
2.4.5. Correlation analysis
To associate the tweet content with stock price movements, this study conducted sentiment analysis on the tweets using the TextBlob library to obtain sentiment scores. The get_sentiment function was defined to analyze the sentiment polarity of each tweet using TextBlob. The function converts the text to a string and returns a neutral sentiment score (0.0) for any exceptions. The sentiment polarity scores were stored in a new column, "Sentiment," and labels ("positive," "negative," "neutral") were assigned based on the scores. For each stock, the "Close" prices were grouped, and the .shift(-1) method was used to obtain the next day's closing price ("Next_Close"). A binary label, "Price_Change" (1 for an increase, 0 for a decrease), was generated by comparing the current "Close" price with "Next_Close."The data was then integrated to generate Figure 6.
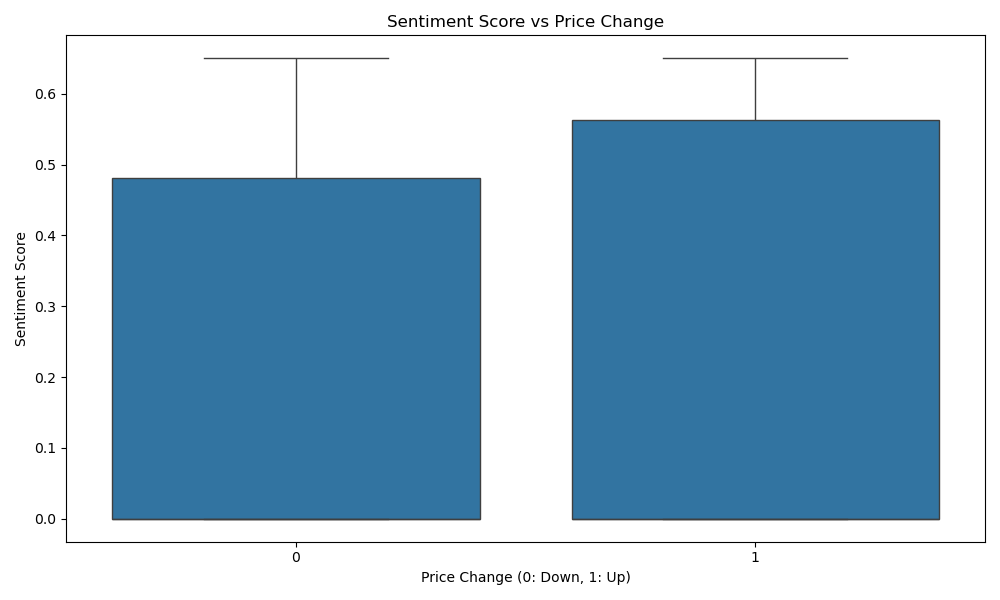
Figure 6: Correlation between tweet sentiment scores and stock price changes
By comparing the median values of the two sets of data, it can be observed that the sentiment scores for price increases (1) are higher, indicating more positive sentiment in tweets when the stock price rises. In contrast, the sentiment scores for price decreases (0) are relatively lower, suggesting more negative sentiment on social media when the stock price falls. Based on this, it can be concluded that social media sentiment may have a certain correlation with stock price movements: when the price rises, the median sentiment score is higher, reflecting a positive market sentiment, while during price declines, the sentiment score is lower, indicating a more negative market sentiment. The shapes of the two box plots are similar, but the difference in the medians suggests that positive sentiment is more likely to drive stock prices upward.
2.4.6. Exploration of the strength of correlation
Based on the previous research, there is a certain relationship between sentiment and stock price movements. Next, the strength of the correlation between social media sentiment and stock price trends will be analyzed.
First, the merged data was grouped by "Sentiment Label," and the probability of stock price changes (the average value of Price_Change) was calculated for each sentiment category (negative, neutral, positive). A bar chart was then created using Seaborn's barplot, resulting in Figure 7.
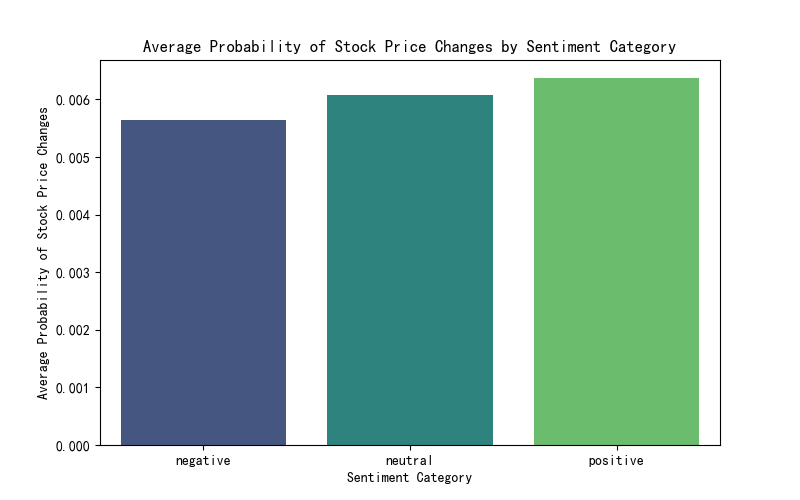
Figure 7: Average probability of stock price changes by sentiment category
The bar chart shows the average probability of stock price increases under negative, neutral, and positive sentiments. It can be observed that the probability of a price increase is highest under positive sentiment, followed by neutral sentiment, and lowest under negative sentiment, which aligns with general expectations. However, the differences are not significant, suggesting that the market's sensitivity to sentiment might be low. Combining this with Figure 4, it is found that the median sentiment scores for price increases are indeed higher than those for price decreases, but the distribution ranges of both are highly overlapping, indicating that while sentiment does influence stock prices, its impact is relatively weak.
Next, two stocks, TSLA and AMZN, were selected as samples for analysis. The data for these stocks was aggregated by week, and the weekly average sentiment scores and average stock prices were calculated. A dual Y-axis line chart was created. By comprehensive study on correlation coefficients, the Pearson correlation coefficient was chosen to examine the relationship between sentiment scores and stock price trends, resulting in Figure 8.
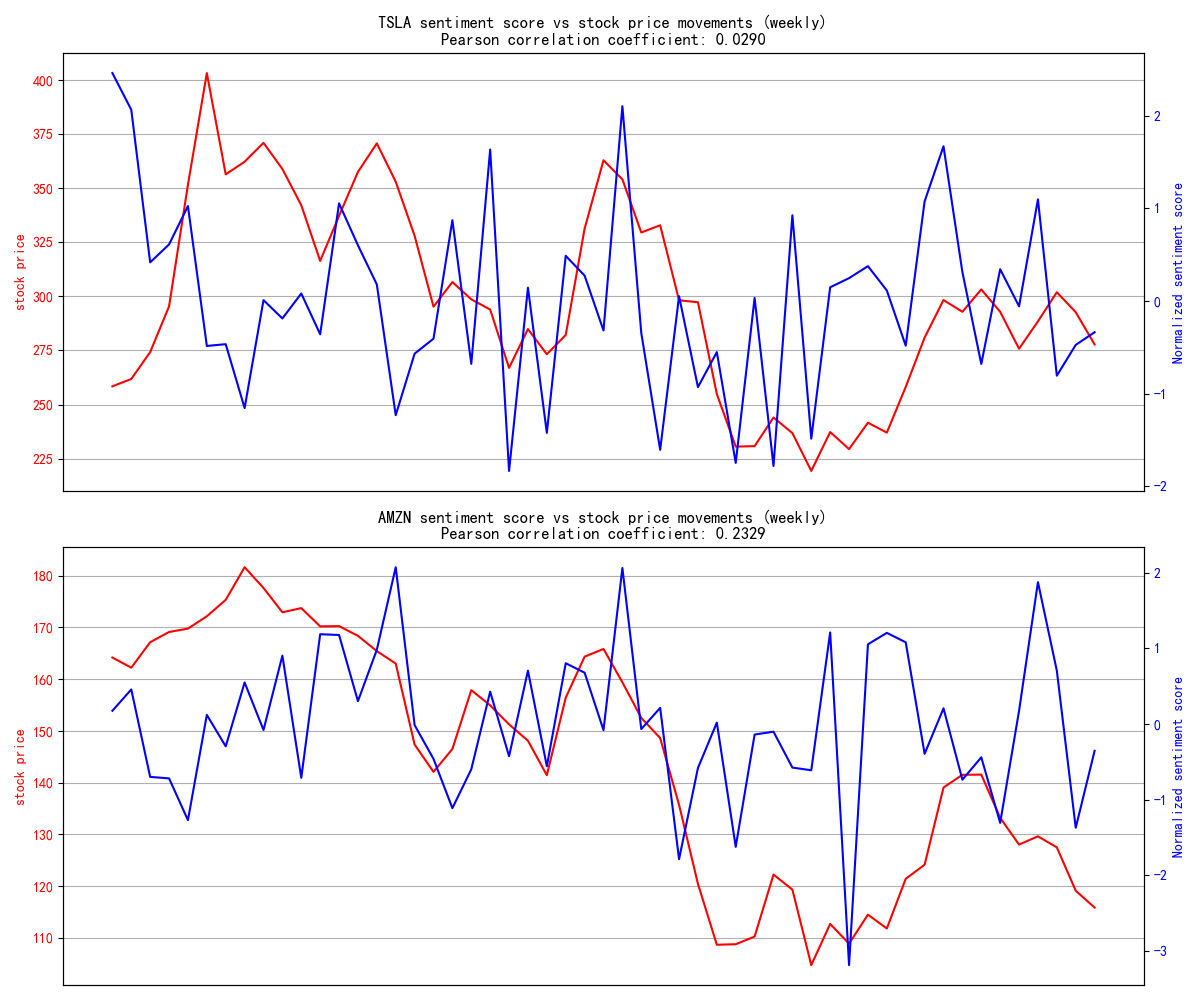
Figure 8: Relationship between sentiment scores and stock price movements for TSLA and AMZN
This chart shows the relationship between the weekly sentiment scores (blue) and stock price trends (red) for TSLA and AMZN, and the Pearson correlation coefficients were calculated: TSLA correlation coefficient: 0.0290; AMZN correlation coefficient: 0.2329
It can be seen that there is some correlation between sentiment scores and stock price trends for both TSLA and AMZN, but it remains relatively weak, indicating that social media sentiment does not significantly impact stock price movements. This chart illustrates that market sentiment has different effects on different stocks, but the overall correlation is low, making it difficult to predict stock prices based solely on sentiment. The impact of sentiment scores on stock price changes is vague, and it cannot provide clear signals for price increases or decreases.
Next, to analyze the distribution of different sentiment scores (negative, neutral, positive) under stock price increases and decreases, the data for TSLA and AMZN were filtered and grouped by "Price_Change" (0: decrease, 1: increase) and "Sentiment Label" to count the number of tweets. A dual Y-axis bar chart was then created, resulting in Figure 9.
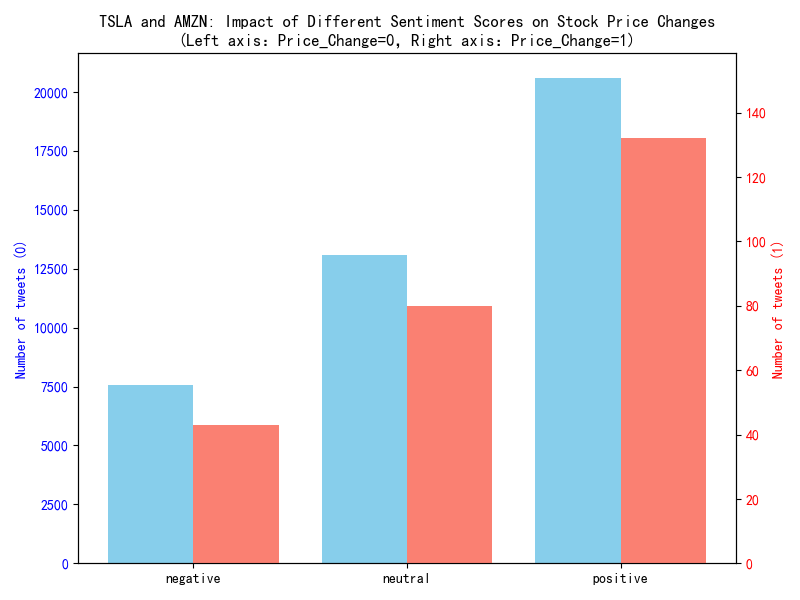
Figure 9: TSLA and AMZN: impact of different sentiment scores on stock price changes
This chart is a countplot that shows the distribution of stock price increases (1) and decreases (0) under different sentiment categories (negative, neutral, positive). It can be observed that the number of stocks with positive sentiment is the highest, followed by neutral sentiment, and negative sentiment is the least. The number of price increases (1) is far lower than the number of price decreases (0), indicating an extreme imbalance in the sample (the ratio of increases to decreases is disproportionate). This suggests that, in most cases, the relationship between sentiment and stock price movements is unstable, and the market's reaction to positive and negative sentiment can be more complex. Negative sentiment does not necessarily lead to stock price declines, nor does positive sentiment guarantee price increases. This further illustrates that stock price movements are influenced not only by social media sentiment but also by many other factors.
Overall, these charts indicate that market sentiment does have some influence on stock price movements and shows a certain level of correlation. However, the predictive ability of a single sentiment indicator is limited. Stock price fluctuations are influenced by various factors, and social media sentiment alone cannot fully explain stock price trends [10].
2.5. Comparison of model performance and selection of predictive model
This study compares the performance of five machine learning models in predicting stock price movements, including Logistic Regression (LR), Decision Tree (DT), Random Forest (RF), Gradient Boosting Decision Tree (GBDT), and XGBoost. The following are the performance metrics of each model on the test set.
In the initial model performance comparison, it was found that some data contained anomalies. In the preliminary model evaluation, traditional evaluation metrics, including precision, recall, and F1 score for each class, were used, and AUC and accuracy were also calculated. The initial results showed that some models (e.g., LR) had precision_1 and recall_1 both equal to 0, while other models had very low F1 scores for class 1. These anomalous results indicate that due to the severe imbalance in data classes, traditional metrics are easily affected by the failure to predict the minority class, leading to misleading evaluation results.
Therefore, the results were modified to retain only reasonable metrics, reduce misleading data caused by class imbalance, and add macro_f1 to provide a more comprehensive assessment of model performance. The modified results are as follows in Table 2:
Table 2: Model performance comparison
auc | accuracy | macro_f1 | |
LR | 0.6972 | 0.9742 | 0.4935 |
DT | 0.5167 | 0.9329 | 0.5154 |
RF | 0.7165 | 0.9351 | 0.5025 |
GBDT | 0.8285 | 0.7373 | 0.4880 |
XGBoost | 0.7700 | 0.8494 | 0.5308 |
The comparison shows that under the original evaluation scheme, some models had abnormally low metrics for class 1, failing to reflect the model's predictive ability on the overall data. The improved scheme focuses solely on AUC, Accuracy, and Macro_F1, which more comprehensively assess the model's overall performance.Among the models, XGBoost achieved the highest macro-average F1 score (0.5308), indicating better performance when considering all classes together. And then, the GBDT model performed excellently in terms of AUC (0.8285), demonstrating its strong ranking ability.
Overall, due to the data imbalance issue, LR (Logistic Regression) has a relatively low macro_f1 but the highest accuracy (0.9742). DT (Decision Tree) and RF (Random Forest) perform similarly in accuracy, but their AUC values differ significantly, with RF being more stable.GBDT (Gradient Boosting Decision Tree) has the highest AUC (0.8285), indicating stronger class distinction ability. XGBoost maintains a good balance across all metrics and could potentially be the best model overall.
3. Analysis of experimental results
By comparing the medians of the two data sets, this study conducted a comprehensive evaluation of five models: Logistic Regression (LR), Decision Tree (DT), Random Forest (RF), Gradient Boosting Decision Tree (GBDT), and XGBoost, on the task of predicting stock price changes. The results show that although LR and RF perform well in accuracy, due to the severe data imbalance, LR’s macro_f1 is significantly low, indicating weak performance in predicting the minority class. Although DT and RF have similar accuracy, RF has a notably higher AUC, suggesting it can more reliably distinguish between categories across different thresholds. The GBDT model achieves the highest AUC (0.8285), demonstrating strong ability to differentiate between positive and negative class samples. Considering all metrics, XGBoost maintains a good balance across accuracy, AUC, and macro average F1 score, exhibiting strong overall predictive performance. Therefore, this study concludes that XGBoost is likely the best model choice, as it balances overall accuracy while effectively handling the class imbalance issue.
Additionally, data analysis reveals that periods with significant stock price fluctuations correspond to a much higher number of tweets compared to other periods. Positive sentiment scores are strongly associated with stock price increases (Price Change = 1), while negative sentiment scores may relate to stock price declines (Price Change = 0). Overall, social media sentiment has some influence on stock price changes. However, further analysis of the strength of correlation shows that the impact of sentiment on stock prices is limited. While there is a certain positive correlation, the volatility is large, making sentiment alone an unreliable predictor. To predict stock price changes through sentiment, other factors such as market trends, trading volume, and industry news should be combined, and more complex models should be used to analyze from multiple factors.
4. Conclusion
This study aims to investigate the impact of social media sentiment on stock price fluctuations. Social media data containing tweet content, publication date, and stock names, along with corresponding stock price data, were collected. After data cleaning and preprocessing, the quality and consistency of the data were ensured, laying a foundation for further analysis. Valuable features were extracted from the tweets using text preprocessing and sentiment analysis methods, helping to better understand the content and support model training. Relevant data were visualized to clearly show the relationship between tweet sentiment and stock price changes. Several machine learning models, including Logistic Regression, Decision Tree, Random Forest, Gradient Boosted Decision Tree, and XGBoost, were built to predict stock price movements. Model performance was evaluated using metrics such as accuracy, AUC, and macro-average F1 score. The comparison showed that XGBoost maintained a good balance across all metrics and demonstrated strong overall predictive capability, especially under imbalanced data conditions.
As social media increasingly influences information dissemination and public opinion formation, studying its effect on stock price fluctuations has become critically important. This research quantifies the relationship between social media sentiment and stock prices, providing valuable insights for investors, businesses, and policymakers. It aids in understanding market dynamics and shifts in public sentiment, offering investors guidance in making more informed investment decisions. The findings suggest that while there is a relationship between social media sentiment and stock prices, the correlation is weak overall, and the linear relationship between sentiment scores and stock trends remains unclear. This implies that stock price fluctuations are driven by multiple factors, and relying solely on social media sentiment is insufficient for accurately predicting stock movements. Future research could investigate integrating additional factors such as market conditions, trading volume, and industry news, and apply more sophisticated models for multi-factor analysis. Furthermore, exploring deep learning techniques (e.g., CNN, LSTM) in sentiment analysis and stock price prediction could capture non-linear and time-lag effects, providing a deeper understanding of the connection between sentiment and stock prices. This study contributes to the literature on the relationship between social media and stock market returns in the past five years, addressing a gap in recent research.
References
[1]. Lü, Y. (2018). An empirical study on the impact of online public opinion on stock market returns: From the perspective of investor sentiment. Finance and Accounting Communication, (4), 5.
[2]. Kong, X. (2022). Analysis of the positive feedback mechanism of herding behavior in the stock market caused by social media [Master’s thesis, Dongbei University of Finance and Economics].
[3]. Xu, T. (2018). A study on the impact of investor sentiment in social media on the stock market. Shanghai Management Science, 40(3), 67–74. https://doi.org/10.3969/j.issn.1005-9679.2018.03.012
[4]. Luo, W. (2018). Can investor sentiment predict stock market returns? A study based on online big data [Master’s thesis, Southwest University of Political Science and Law].
[5]. Zhang, S., & Others. (2015). Big data analysis of the impact of investor sentiment based on social media on stock market returns. China Market, (25), 4.
[6]. Zhang, P., & Song, L. (2012). A review of topic modeling methods for Weibo text based on LDA. Library and Information Service, 56(24), 7. [in Chinese]
[7]. Aljedaani, Wajdi, et al., (2022) Sentiment analysis on Twitter data integrating TextBlob and deep learning models: The case of US airline industry. Knowledge-Based Systems, 255, 109780.
[8]. Jia, J.H., Hao P., and Junming Su., (2023) Analysis of motivations, process, and implications of Elon Musk’s acquisition of twitter." BCP Business & Management, 47, 145-153.
[9]. Xu, W. (2012). A review of research on correlation coefficients. Journal of Guangdong University of Technology, 29(3), 12–17.
[10]. Coelho, J., D'almeida, D., Coyne, S., Gilkerson, N., Mills, K., & Madiraju, P., (2019) Social media and forecasting stock price change. In 2019 IEEE 43rd annual computer software and applications conference (COMPSAC) (Vol. 2, pp. 195-200). IEEE.
Cite this article
Li,Z. (2025). The Impact of Social Media Sentiment on Stock Price Changes. Advances in Economics, Management and Political Sciences,170,49-59.
Data availability
The datasets used and/or analyzed during the current study will be available from the authors upon reasonable request.
Disclaimer/Publisher's Note
The statements, opinions and data contained in all publications are solely those of the individual author(s) and contributor(s) and not of EWA Publishing and/or the editor(s). EWA Publishing and/or the editor(s) disclaim responsibility for any injury to people or property resulting from any ideas, methods, instructions or products referred to in the content.
About volume
Volume title: Proceedings of the 9th International Conference on Economic Management and Green Development
© 2024 by the author(s). Licensee EWA Publishing, Oxford, UK. This article is an open access article distributed under the terms and
conditions of the Creative Commons Attribution (CC BY) license. Authors who
publish this series agree to the following terms:
1. Authors retain copyright and grant the series right of first publication with the work simultaneously licensed under a Creative Commons
Attribution License that allows others to share the work with an acknowledgment of the work's authorship and initial publication in this
series.
2. Authors are able to enter into separate, additional contractual arrangements for the non-exclusive distribution of the series's published
version of the work (e.g., post it to an institutional repository or publish it in a book), with an acknowledgment of its initial
publication in this series.
3. Authors are permitted and encouraged to post their work online (e.g., in institutional repositories or on their website) prior to and
during the submission process, as it can lead to productive exchanges, as well as earlier and greater citation of published work (See
Open access policy for details).
References
[1]. Lü, Y. (2018). An empirical study on the impact of online public opinion on stock market returns: From the perspective of investor sentiment. Finance and Accounting Communication, (4), 5.
[2]. Kong, X. (2022). Analysis of the positive feedback mechanism of herding behavior in the stock market caused by social media [Master’s thesis, Dongbei University of Finance and Economics].
[3]. Xu, T. (2018). A study on the impact of investor sentiment in social media on the stock market. Shanghai Management Science, 40(3), 67–74. https://doi.org/10.3969/j.issn.1005-9679.2018.03.012
[4]. Luo, W. (2018). Can investor sentiment predict stock market returns? A study based on online big data [Master’s thesis, Southwest University of Political Science and Law].
[5]. Zhang, S., & Others. (2015). Big data analysis of the impact of investor sentiment based on social media on stock market returns. China Market, (25), 4.
[6]. Zhang, P., & Song, L. (2012). A review of topic modeling methods for Weibo text based on LDA. Library and Information Service, 56(24), 7. [in Chinese]
[7]. Aljedaani, Wajdi, et al., (2022) Sentiment analysis on Twitter data integrating TextBlob and deep learning models: The case of US airline industry. Knowledge-Based Systems, 255, 109780.
[8]. Jia, J.H., Hao P., and Junming Su., (2023) Analysis of motivations, process, and implications of Elon Musk’s acquisition of twitter." BCP Business & Management, 47, 145-153.
[9]. Xu, W. (2012). A review of research on correlation coefficients. Journal of Guangdong University of Technology, 29(3), 12–17.
[10]. Coelho, J., D'almeida, D., Coyne, S., Gilkerson, N., Mills, K., & Madiraju, P., (2019) Social media and forecasting stock price change. In 2019 IEEE 43rd annual computer software and applications conference (COMPSAC) (Vol. 2, pp. 195-200). IEEE.