


1. Introduction
The COVID-19 pandemic has brought unprecedented external shocks to businesses worldwide. Many previously thriving companies faced severe disruptions, causing a significant downturn in their operations. Among firms, owners of small and medium-sized enterprises (SMEs) face the most significant challenges as they need the financial backing of large corporations to help them weather the storm. Data shows France's bankrupted SEMs reached 62,300 [1]. In America, by 2023, 452,990 businesses filed for bankruptcy, which increased 16.8% compared to 2022.
Previous studies about a firm's financial contraction suggest that various cost-saving methods can solve problems. The report of the ECB suggests that firms view reducing costs as a vital solution to recover from financial distress, as 84.38% of the sample considers reducing costs a vital strategy. Despite reducing costs, dismissing employees is another familiar strategy companies use during periods of economic contraction [2]. This clearly shows that in difficult situations, the most common strategy for human resources management is downsizing. However, studies show such decisions may be counterproductive [3,4]. This is not only because dismissing employees is inefficient, but in certain countries, dismissing employees requires a vast severance payment. Thus, such behavior will not be recommended, especially for small and medium-sized firms.
Meanwhile, dismissing employees because of a recession has ethical concerns. In addition, due to the stricter employment situation during the economic downturn, retrenched employees were prone to impulsive behavior, which triggered mass public security incidents and criminal cases. Reducing output and lowering prices will prolong the firm's economic recovery.
We intend to research another strategy that can substitute the standard methods applied—cooperating with peers in the same industry. Through a controlled experiment, this study investigates the relationship between economic contraction and individuals' willingness to cooperate with their competitors by forming bipartite general partnerships. There is a lack of literature on this topic. This study only examines people's willingness to partner with their competitors. A general partnership refers to a partnership with no business entity, while (in this case) two stakeholders have total liability and relatively equal power status [5].
The experiment involves an objective method to evaluate one's willingness to cooperate in a general partnership, which is to measure the respondent's lowest acceptable profit split (LAPS). By quantifying a vague concept (willingness to collaborate) to an actual number, respondents can provide a more measurable answer with the same standard for every individual. Also, self-cognitive biases can be effectively reduced in this method so the data can be more valid. A lower LAPS indicates a higher willingness to collaborate and vice versa. This is the relevant measure to consider since, in a general partnership, partners split profit and ownership. The experiment took place using an online survey we created. The survey includes two scenario-based questions to examine the respondent’s willingness to collaborate during and out of economic downturns.
The results we collected show that the respondents are choosing lower LAPS when they are in economic downturns. The number of individuals who choose a LAPS between 0%-40% increases by about 31% in an economic downturn. Since a lower LAPS represents a higher willingness to collaborate, such a result suggests a strong positive tendency between collaboration willingness and economic downturn. To investigate such tendencies deeper, we interviewed several respondents and testified their mindset of presenting such behavior. The respondents who choose a lower LAPS in economic downturns are lowering their profit split to further ensure the collaboration can work. They are ore afraid of the failure of the partnership and are willing to give up more now so the company can recover.
We did a further robust check by separating every individual who had company managing experiences or had been an entrepreneur into one group and repeated the same analysis. We found that the general tendency between normal individuals and managers and entrepreneurs is similar. Both groups show a strong increase of willingness to collaborate. Furthermore, fewer managers and entrepreneurs are choosing a higher LAPS, which symbolizes that, as a group, managers and entrepreneurs are more rational than normal individuals. Such a result also indicates that the data we collected from normal individuals are valid and can be used as an indication of inexperienced managers and entrepreneurs of SMEs.
Such a result suggests that companies and firms should actively find opportunities to collaborate with other companies during economic downturns. The possibility of forming a partnership increases during this period. Companies generally gain from collaborating with each other [6]; adding on with a higher collaborating willingness, collaborating with other companies could be a potential method that can effectively help SMEs overcome economic downturns.
The remainder of the paper is structured as follows. Section 2 is the literature review. Section 3 presents the experiment and data collected. Section 4 analyzes the data. Section 6 concludes.
2. Literature review
Our paper contributes to several fields of research. First, we contribute to the literature studying the response of individuals as a company to financial crises. Kunc and Bhandari [7] show that firms tend to adopt a reactive business strategy. A reactive business strategy, however, can only be used to run a business for a short time as it does not implement plans for future growth and instead focuses on ensuring control over current things.
Therefore, we suggest a new method of overcoming financial crises, as this may not be the most effective. Our paper differs from Kunc and Bhandari [7] because we consider economic downturns specific to the individual instead of focusing on an economy-wide financial crisis. While this may differ, we still believe collaboration remains a better option for firms. This differs from most papers and offers a new perspective on firms experiencing crises. In normal recognition, some companies are not willing to cooperate with others because ownership and control are dispersed among multiple individuals rather than concentrated among a single agent and principal. It’s worth to attention that an approach that optimizes profit sharing and task allocation in partnerships can help reduce slacking in monitoring and production tasks, ultimately increasing organizational efficiency. So, asking LSAP as a standard to measure their contribution is really reliable [8]. Second, we focus on the role of collaboration between competitive firms instead of strategy development processes followed by firms during economic and financial crises. Collaborating with competitors can encourage firms to try new and better methods to overcome downturns. In another paper, Vafin [9] finds out that despite wanting to save money, buyers still tend to make decisions on purchases based on other variables and that slashing prices to overcome difficulties in a recession is rarely a proven strategy to boost profits. While our paper does not disagree with the idea that slashing prices is not a suitable method for overcoming difficulties, our paper further adds that a better alternative to overcoming challenges in economic downturns in the company would be collaborating with competitors.
Lastly, our paper contributes to the literature studying collaboration between firms. Hanna and Walsh [10] show how to collaborate successfully with other firms. This gives more evidence to support our view that collaborating with competitive firms during financial problems benefits firms. Their paper differs from ours since it mainly focuses on how successful collaborations are achieved and shows the use of brokers by showing the difference between having and not having them. Our paper focuses on using collaboration as a whole during economic downturns instead.
3. Methodology
The experiment took place using an online survey we created. We wrote the questionnaire using a second-person narrative approach, creating a real-life scenario for the respondents to bring them into the entrepreneur's shoes to answer the survey. Studies show that second-person narration effectively increases the reader's identification [11], thus maximizing the novelty and relevance of this study for entrepreneurs.
We tried to ask the individuals with working experience to understand better the situation we created because the questionnaire contains some prerequisites that help make the situation more rigorous and easy to understand without guiding suggestions. In addition, the survey will not be sent out as a research survey but somewhat under the exciting title "Test Your Potential to Become a Boss" to ensure that the participants do not deliberately adjust their way of thinking to make decisions to give the most realistic answers [12]. Also, we put the control group (Q1) and treatment group (Q2) in front of other questions to avoid the impact on respondents.
The sample number we collected is 187, which includes 62 entrepreneurs. To observe the changes between the situations, they participated in both the control group (Question 1) and the treatment group (Question 2). So, our observation number is 374. This makes the changes between the situations clear; their basic information is the same.
We aimed to use the lowest acceptable profit split to determine the willingness of each participant to cooperate, such as the lower the profit they receive, the higher the individuals' willingness to cooperate. This could help to avoid self-cognitive bias that people might avoid misvaluing their willingness to collaborate because this method quantifies it into the profit rate they receive [13]. So, the dependent variable is the LASP, which was shown as 5 options with percentages that indicate the collaboration willingness, and the independent variable is whether the company is in a downturn or not; the control variable is the participants' age, income, education level, years of working, and gender.
We conducted a survey based on two questions. The scenario is one in which the participant is asked to run a game company and to cooperate with other firms. The amount of collaboration allowed ranges from 0% (no collaboration) to 100% (maximum collaboration), with brackets of 20 percentage points (e.g., 0%-20%; 20%-40%, etc.). We asked the participants to decide on a collaboration amount for both parts of the survey. In the first part, the company is assumed to be going through a period of regular economic activity, while in the second part, the company is going through a period of economic distress. The survey also asked about demographics (age, income, education level, etc.). What is worth mentioning is that we asked the question, "Have you ever been an entrepreneur?" If they selected "YES," the questionnaire would jump into the year they worked in management or skip the question. This is done to find the differences between entrepreneurs and other respondents when making decisions in such a situation.
In the questionnaire, 14 people chose 0%-20%, 45 people chose 21%-40%,112 people chose 41%-60%, 15 people chose 61%-80%, and 1 person chose 81%-100% on question one. A simple graph we made shows that it is an unimodal distribution, and the graph is nearly symmetrical. In question two, 39 people chose 0%-20%, 79 people chose 21%-30%, 49 people chose 41%-60%, 16 people chose 61%-80%, and 4 people chose 81%-100%. It is also unimodal, and the graph is skewed to the right.
To summarize our data collection, the mean age is about 40, with a maximum of 71 and a minimum of 15. The 45% of participants are male. The data shows that most participants had a high school education or above. About 33% had experience in management roles in a company or are entrepreneurs. Most participants' annual incomes are higher than 100-300 thousand. Compared with question one, About 48% of respondents increased, 36% had no significant change, and 16% had significant decreases in their willingness to cooperate.
The summary statistic is reported in Table 1.
Table 1: Summary statistics
Mean | St. Dev. | Min | Max | Obs | |
(1) | (2) | (3) | (4) | (5) | |
Age | 39.813 | 15.12 | 15 | 71 | 384 |
Gender | 0.449 | 0.499 | 0 | 1 | 384 |
Education | 2.914 | 0.863 | 1 | 5 | 384 |
Management Experience | 0.332 | 0.472 | 0 | 1 | 384 |
Annual Income | 3.807 | 1.749 | 1 | 7 | 384 |
Willingness of Collaboration Increase | 0.476 | 0.501 | 0 | 1 | 384 |
Willingness of Collaboration Decrease | 0.160 | 0.368 | 0 | 1 | 384 |
Willingness of Collaboration Unchanged | 0.364 | 0.482 | 0 | 1 | 384 |
Notes: Gender: male=1. Education: junior high school=1, senior high school=2, college or university=3, master degree=4, doctor degree=5. Annual Income (thousands, ¥): 0-30=1, 30-50=2, 50-100=3, 100-300=4, 300-500=5, 500-1000=6, above 1000=7. Willingness of Collaboration Increase=1 if people's willingness to cooperate during an economic downturn increases. Willingness of Collaboration Decreases=1 if people's willingness to cooperate during an economic downturn decreases. Willingness of Collaboration Unchanged=1 if people's willingness to cooperate during an economic downturn does not change.
4. Data analysis
We summarize an overall comparison of people's willingness to change during the economic downturn. Notice that this is a group comparison, which does not reflect each individual's change. Results of the holistic LASP are presented in Figure 1.
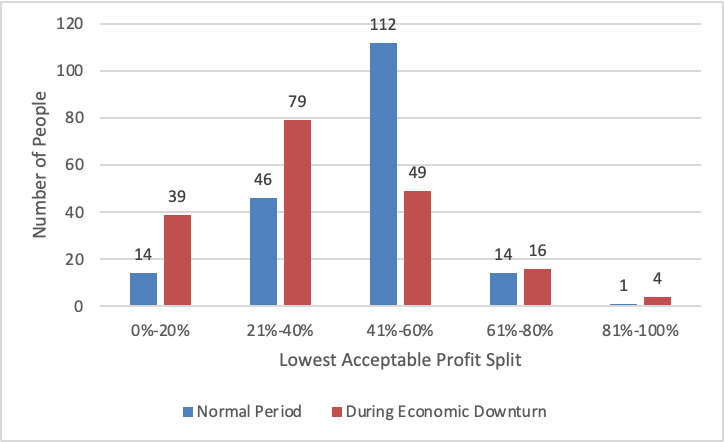
Figure 1: Number of respondents accepting each profit split range
The chart presents the number of people who chose each range of LASP during two periods. The distribution of data in both periods shows a tendency for normal distribution. The peak of the distribution in a regular period is 41%-60%, a relatively fair range of profit split. People tend to split profits fairly because of reciprocity and the assumption that both parties contribute equally to the game. However, in an economic downturn, more people are willing to receive less profit but make the collaboration work; the peak switches from 41%-60% to 21%-40%. The overall normal distribution also tends to shift to the left. This shows that with collegiality, people tend to be more willing to cooperate during the economic downturn.
However, this chart and analysis cannot accurately reflect an individual's willingness to change. In this test, we must include demographic considerations in the model since all individuals' characteristics may vary, leading to unique initial acceptance and business style. To accurately analyze an individual's willingness to change, we compared the LAPS of each individual in a regular period and economic downturn. During economic downturns, 48% of individuals have a significant increase in their willingness to collaborate, 36% of individuals have no significant change in their willingness to collaborate, and 16% of individuals have a significant decrease in their willingness to collaborate.
Willingness to cooperate significantly increases, meaning the respondent's LAPS2 is lower than LAPS1 by 20 percentage points or more. Willingness to cooperate has no significant change, meaning the respondent's change between LAPS1 and LAPS2 is within 20%. Willingness to cooperate decreases, meaning the respondent's LAPS2 is higher than LAPS1 by 20 percentage points or more.
The results suggest that nearly half of the respondents have a significant increase in willingness to cooperate when facing an economic downturn, 36% have no significant change in their willingness, and only 16% selected a higher LAPS during the downturn. In this situation, lowering the LAPS is a rational decision. As the question discussed, they might face a severe financial crisis or bankruptcy if the collaboration fails. Thus, it is a rational choice to reduce profits moderately to ensure the success of the collaboration to a greater extent. This is a classic trade-off action in which one loses something (in this case, profit) in return for other aspects [14]. The results suggest that respondents give up profit in return for economic stability. In addition, such trade-off action can help maximize the firm's economic stability and help to compact future reciprocity relationships [15], which could be another consideration when respondents are making the decision.
We further study the change in different ranges of LAPS2. Table 2 and 3 present how the number of individuals in each LAPS range changes during the economic downturn. In both tables, the first row is the direct relationship between facing an economic downturn and an individual's willingness to change. The rows below are the control variables that need to be considered and might be effective for the results.
Table 2: Willingness to accept higher profit split
Willingness to Accept | ||||
High Profit Split (41%-100%) | 41%-60% | 61%-80% | 81%-100% | |
(1) | (2) | (3) | (4) | |
Economic Turndown | -0.310*** | -0.336*** | 0.0108 | 0.016 |
(0.049) | (0.048) | (0.028) | (0.012) | |
Age | -0.012 | -0.011 | -0.004 | 0.002 |
(0.015) | (0.015) | (0.009) | (0.004) | |
Education | -0.049 | -0.051** | 0.008 | -0.007 |
(0.026) | (0.026) | (0.015) | (0.006) | |
Management Experience | -0.142** | -0.089 | -0.027 | -0.025* |
(0.059) | (0.055) | (0.0323) | (0.014) | |
R-square | 0.123 | 0.132 | 0.006 | 0.018 |
Observation | 384 | 384 | 384 | 384 |
Notes: Standard errors are in parentheses under coefficients; *, **, *** represent 10%, 5%, and 1% significant levels, respectively.
The first column of Table 2 presents how economic downturn affects individuals who choose a relatively higher profit split (40%-100%), considering other control variables. When facing an economic downturn, the number of individuals choosing a higher LAPS decreases by 31 percentage points. The second, third, and fourth columns split the range into three small groups, 41%-60%, 61%-80%, and 81%-100%, and reflect the specific changes among the small groups. The number of individuals with LAPS of 40%-60% at the beginning significantly decreases by 33.6 percentage points. The 61-80% change and 80%-100% have no statistically significant relationship with facing an economic downturn. Such a trend supports an increasing willingness to cooperate when individuals face an economic downturn.
Table 3 analyzes the relationship between multiple factors and the number of individuals with a relatively lower LAPS.
Table 3: Willingness to accept lower profit split
Willingness to Accept | |||
Low Profit Split (0%-40%) | 0%-20% | 21%-40% | |
(1) | (2) | (3) | |
Economic Turndown | 0.310*** | 0.132*** | 0.177*** |
(0.049) | (0.035) | (0.048) | |
Age | 0.012 | 0.034*** | -0.021 |
(0.015) | (0.011) | (0.015) | |
Education | 0.049* | 0.043** | 0.006 |
(0.026) | (0.019) | (0.026) | |
Management Experience | 0.142** | 0.064 | 0.077 |
(0.056) | (0.040) | (0.055) | |
R-square | 0.123 | 0.083 | 0.044 |
Observation | 384 | 384 | 384 |
Notes: Standard errors are in parentheses under coefficients; *, **, *** represent 10%, 5%, and 1% significant levels, respectively.
The first column of Table 2 presents how economic downturn affects individuals who choose a relatively lower profit split (0%-40%), considering other control variables. A significant positive correlation exists between the number of individuals willing to take a lower LAPS and economic turndown. It shows that when facing an economic downturn, the increasing percentage points of lower LAPS of several individuals are symmetric to the decreasing percentage points of higher LAPS since the two general groups divide the whole range of profit split. Columns (2) and (3) divide the range into two smaller groups, 0%-20% and 21%-40%, with significantly increasing trends. This is evidence that willingness to cooperate increases during economic downturns.
To investigate the reason behind such trends, we interviewed several respondents about why they chose a higher/lower/unchanged LAPS to determine their genuine motivation to support the study. A typical answer for the respondents with a decreasing willingness to cooperate is, "If my company is in an economic downturn, I need more money to stop this negative tendency. Thus, I need a higher profit split." The respondents with a decreased willingness to cooperate generally disregard their partner's willingness. Most have not considered this situation when we ask whether they think their partner will accept this split. Another few respondents provided an interesting answer. They raise the point that it is more important to take more significant risks; it will be all or nothing. Such a gambler mindset is irrational; however, it exists. This mindset urges individuals to take higher risks in their decisions [16], which may lead to unwanted results. Respondents who insist on their LAPS during economic turndown explain that although they strongly desire to make the partnership work, they believe contribution should deserve equivalence profit. They tend to believe that their partner will accept this profit split. The respondents with a significant increase in willingness to cooperate explain their decision as extra insurance for the partnership. They are more worried about the firm's survival. They would rather receive lower profit but ensure the partnership can work, stabilizing the firm's economy, and the company will face an extreme financial crisis.
Since we intend to investigate how companies will react when facing an economic crisis, we are curious to consider whether the mindset and cast of entrepreneurs and company managers are similar to ordinary people. Thus, we separately analyze the LAPS of entrepreneurs and company managers and the LAPS of ordinary people (who are not entrepreneurs and have no experience managing firms).
Table 4: LAPS2 of entrepreneurs and company managers
Willing to Accept | ||||
0%-20% | 21%-40% | 41%-60% | 61%-80% | |
(1) | (2) | (3) | (4) | |
Economic Downturn | 0.192*** | 0.114 | -0.291*** | -0.016 |
(0.071) | (0.086) | (0.084) | (0.042) | |
Age | 0.033 | -0.029 | 0.005 | -0.009 |
(0.028) | (0.034) | (0.033) | (0.017) | |
Education | 0.078 | -0.066 | -0.018 | 0.006 |
(0.043) | (0.053) | (0.051) | (0.026) | |
Observation | 124 | 124 | 124 | 124 |
R-square | 0.089 | 0.031 | 0.092 | 0.004 |
Notes: Standard errors are in parentheses under coefficients; *, **, *** represent 10%, 5%, and 1% significant levels, respectively.
Table 4 presents how economic downturns affect individuals with management experiences or are entrepreneurs' LAPS2 considering other control variables. There is a significant increase in individuals willing to accept a 0%-20% profit split. However, economic turndown does not affect the relationship between the individuals willing to accept a 21%-40% profit split. Similar to the holistic regression analysis, there is a significant decrease in the number of individuals willing to accept a 41%-60% split, which reflects that entrepreneurs and company managers are likely to increase their willingness to cooperate during economic downturns. In addition, none has a LAPS of 80%-100%, meaning that an extreme gambler mindset rarely exists in this group.
Table 5: LAPS2 of normal individuals
Willing to Accept | |||||
0%-20% | 21%-40% | 41%-60% | 61%-80% | 81%-100% | |
(1) | (2) | (3) | (4) | (5) | |
Economic Downturn | 0.103*** | 0.209*** | -0.359*** | 0.024 | 0.024 |
(0.038) | (0.058) | (0.059) | (0.037) | (0.018) | |
Age | 0.031*** | -0.013 | -0.018 | -0.002 | 0.002 |
(0.011) | (0.017) | (0.017) | (0.011) | (0.005) | |
Education | 0.031 | 0.033 | -0.065** | 0.010 | -0.009 |
(0.020) | (0.030) | (0.030) | (0.019) | (0.009) | |
Observation | 250 | 250 | 250 | 250 | 250 |
R-square | 0.057 | 0.063 | 0.146 | 0.004 | 0.015 |
Notes: Standard errors are in parentheses under coefficients; *, **, *** represent 10%, 5%, and 1% significant levels, respectively.
Table 5 presents how economic downturns affect normal individuals (individuals with management experiences and are not entrepreneurs) LAPS2 considering other control variables. More individuals switched from 41%-60% to 21%-40%, which still represents a significant increase in collaboration willingness. The tendency of increase in the range of 41%-60% is steeper than the increase among 21%-60%.
There are two main differences between the two groups. First, entrepreneurs and company managers tend to give up more profit than normal individuals. The number of entrepreneurs and company managers with a LAPS of 0%-20% is nine percentage points higher than normal individuals, which is prominent, reflecting a much stronger desire to cooperate. The reason behind this phenomenon could be explained by loss aversion. Since company managers and entrepreneurs have a higher stake and responsibility, they tend to be more aversed by loss. Second, there are five normal individuals with a LAPS of 81%-100%, while none of the entrepreneurs and company managers have. This suggests that entrepreneurs and company managers are more rational when making such decisions. However, the two outcomes conflict since lost aversion is an irrational behavior.
Despite the two differences, the two data groups have the same tendency of increasing willingness to collaborate, suggesting that entrepreneurs and company managers have a similar mindset and cast with normal individuals. Thus, the data collected from normal individuals are valuable in analyzing the holistic tendency of willingness to collaborate with companies.
5. Conclusion
To explore an alternative method to help SMEs overcome economic downturns, we investigated the change in individuals' willingness to collaborate with others during an economic downturn. Studies show that commonly suggested methods to overcome economic downturns, like reducing prices, are efficient and have ethical considerations. Thus, finding a solution that allows companies to quickly overcome economic downturns and positively promote the whole market is essential.
We investigated the change in willingness to collaborate by surveying various individuals. We use LAPSs as an objective method to measure people's willingness to collaborate. This method reduces ego bias, allowing us to measure one's willingness to cooperate accurately. After analyzing the data using regression analysis and gathering qualitative data on one's reasoning for choosing a specific LAPS, we found that most people are more willing to collaborate during an economic downturn. We separated the respondents by company managing experience or entrepreneurs and found that the essential mindset of this group of individuals is similar to that of normal individuals. Therefore, the data collected can indicate how firms will behave in similar scenarios since SMEs' final decision on whether to collaborate with another firm will be made by an individual.
Collaborating with another company benefits firms, especially SMEs, since it helps firms innovate and develop***. Adding on to the increasing willingness to collaborate, firms should actively collaborate with others and overcome the economic downturn together. This approach ensures adequate profits and does not lead to price wars by lowering prices, which can lead to negative-sum games.
However, this research only includes some situations that may occur in a collaboration. We only investigate the general willingness to cooperate. In other scenarios, the data collected may be inaccurate but can still be implicated as a reference. Additionally, the survey's sample size is 192 individuals, which is relatively small and only represents the value of Chinese. Cultural differences may lead to different business styles, but the general tendency expected will be similar due to the common psychology of loss aversion.
Our findings discuss potential non-existing or rarely recommended strategies companies can use to overcome economic downturns. Our study suggests that most individuals are increasingly willing to collaborate with others when experiencing an economic downturn. Therefore, SMEs should be encouraged to actively collaborate with other companies, even competitors, to construct a favorable market environment while overcoming economic downturns.
Acknowledgement
Shun Yan Lai, and Zijia Xiong contributed equally to this work and should be considered co-first authors.
References
[1]. Mselmi, N., Lahiani, A., & Hamza, T. (2017). Financial distress prediction: The case of French small and medium-sized firms. International Review of Financial Analysis, 50, 67–80. https://doi.org/10.1016/j.irfa.2017.02.004
[2]. Diaz-Fernandez, M., Pasamar-Reyes, S., & Valle-Cabrera, R. (2017). Human capital and human resource management to achieve ambidextrous learning: A structural perspective. BRQ Business Research Quarterly, 20(1), 63–77. https://doi.org/10.1016/j.brq.2016.03.002
[3]. Luan, C., Tien, C., & Chi, Y. (2013). Downsizing to the wrong size? A study of the impact of downsizing on firm performance during an economic downturn. The International Journal of Human Resource Management, 24(7), 1519–1535. https://doi.org/10.1080/09585192.2012.725073
[4]. Muñoz-Bullón, F., & Sánchez-Bueno, M. J. (2011). Does downsizing improve organisational performance? An analysis of Spanish manufacturing firms. The International Journal of Human Resource Management, 22(14), 2924–2945. https://doi.org/10.1080/09585192.2011.599955
[5]. Swais, N. (1998). Understanding the Partnership Structure (Part 1): The General Partnership. LawNow, 23(42), https://heinonline.org/HOL/LandingPage?handle=hein.journals/lanow23&div=92&id=&page=
[6]. Petropoulos, G. (2017). An economic review of the collaborative economy. Www.econstor.eu. http://hdl.handle.net/10419/173101
[7]. Kunc, M., & Bhandari, R. (2011). Strategic development processes during economic and financial crisis. Management Decision, 49(8), 1343–1353. https://doi.org/10.1108/00251741111163151
[8]. Huddart, S., & Liang, P. J. (2005). Profit sharing and monitoring in partnerships. Journal of Accounting and Economics, 40(1–3), 153–187. https://doi.org/10.1016/j.jacceco.2005.04.008
[9]. Vafin, A. (2018). Should Firms Lower Product Price in Recession? A Review on Pricing Challenges for Firms in Economic Downturn. ResearchBerg Review of Science and Technology, 2(3), 1–24. Retrieved from https://researchberg.com/index.php/rrst/article/view/34
[10]. Hanna, V., & Walsh, K. (2008). Interfirm Cooperation among Small Manufacturing Firms. International Small Business Journal: Researching Entrepreneurship, 26(3), 299–321. https://doi.org/10.1177/0266242608088740
[11]. Fludernik, M. (1993). Second Person Fiction: Narrative “You” As Addressee And/Or Protagonist. AAA: Arbeiten Aus Anglistik Und Amerikanistik, 18(2), 217–247. https://www.jstor.org/stable/43023644
[12]. Krosnick, J. A. (2018). Questionnaire Design. The Palgrave Handbook of Survey Research, 439–455.
[13]. Sugimoto, C. R., & Cronin, B. (2012). Citation gamesmanship: testing for evidence of ego bias in peer review. Scientometrics, 95(3), 851–862. https://doi.org/10.1007/s11192-012-0845-z
[14]. ROFF, D. A., & FAIRBAIRN, D. J. (2007). The evolution of trade-offs: where are we? Journal of Evolutionary Biology, 20(2), 433–447. https://doi.org/10.1111/j.1420-9101.2006.01255.x
[15]. Falk, A., & Fischbacher, U. (2006). A theory of reciprocity. Games and Economic Behavior, 54(2), 293–315. https://doi.org/10.1016/j.geb.2005.03.001
[16]. Graham, L., Jordan, L., Hutchinson, A., & de Wet, N. (2017). Risky behaviour: a new framework for understanding why young people take risks. Journal of Youth Studies, 21(3), 324–339. https://doi.org/10.1080/13676261.2017.1380301
Cite this article
Lai,S.Y.;Liao,J.;Xiong,Z.;Mok,L. (2025). Collaborate or Stand Alone? New Survival Strategy Entrepreneurs Make for SMEs During Economic Downturns. Advances in Economics, Management and Political Sciences,182,146-155.
Data availability
The datasets used and/or analyzed during the current study will be available from the authors upon reasonable request.
Disclaimer/Publisher's Note
The statements, opinions and data contained in all publications are solely those of the individual author(s) and contributor(s) and not of EWA Publishing and/or the editor(s). EWA Publishing and/or the editor(s) disclaim responsibility for any injury to people or property resulting from any ideas, methods, instructions or products referred to in the content.
About volume
Volume title: Proceedings of the 3rd International Conference on Financial Technology and Business Analysis
© 2024 by the author(s). Licensee EWA Publishing, Oxford, UK. This article is an open access article distributed under the terms and
conditions of the Creative Commons Attribution (CC BY) license. Authors who
publish this series agree to the following terms:
1. Authors retain copyright and grant the series right of first publication with the work simultaneously licensed under a Creative Commons
Attribution License that allows others to share the work with an acknowledgment of the work's authorship and initial publication in this
series.
2. Authors are able to enter into separate, additional contractual arrangements for the non-exclusive distribution of the series's published
version of the work (e.g., post it to an institutional repository or publish it in a book), with an acknowledgment of its initial
publication in this series.
3. Authors are permitted and encouraged to post their work online (e.g., in institutional repositories or on their website) prior to and
during the submission process, as it can lead to productive exchanges, as well as earlier and greater citation of published work (See
Open access policy for details).
References
[1]. Mselmi, N., Lahiani, A., & Hamza, T. (2017). Financial distress prediction: The case of French small and medium-sized firms. International Review of Financial Analysis, 50, 67–80. https://doi.org/10.1016/j.irfa.2017.02.004
[2]. Diaz-Fernandez, M., Pasamar-Reyes, S., & Valle-Cabrera, R. (2017). Human capital and human resource management to achieve ambidextrous learning: A structural perspective. BRQ Business Research Quarterly, 20(1), 63–77. https://doi.org/10.1016/j.brq.2016.03.002
[3]. Luan, C., Tien, C., & Chi, Y. (2013). Downsizing to the wrong size? A study of the impact of downsizing on firm performance during an economic downturn. The International Journal of Human Resource Management, 24(7), 1519–1535. https://doi.org/10.1080/09585192.2012.725073
[4]. Muñoz-Bullón, F., & Sánchez-Bueno, M. J. (2011). Does downsizing improve organisational performance? An analysis of Spanish manufacturing firms. The International Journal of Human Resource Management, 22(14), 2924–2945. https://doi.org/10.1080/09585192.2011.599955
[5]. Swais, N. (1998). Understanding the Partnership Structure (Part 1): The General Partnership. LawNow, 23(42), https://heinonline.org/HOL/LandingPage?handle=hein.journals/lanow23&div=92&id=&page=
[6]. Petropoulos, G. (2017). An economic review of the collaborative economy. Www.econstor.eu. http://hdl.handle.net/10419/173101
[7]. Kunc, M., & Bhandari, R. (2011). Strategic development processes during economic and financial crisis. Management Decision, 49(8), 1343–1353. https://doi.org/10.1108/00251741111163151
[8]. Huddart, S., & Liang, P. J. (2005). Profit sharing and monitoring in partnerships. Journal of Accounting and Economics, 40(1–3), 153–187. https://doi.org/10.1016/j.jacceco.2005.04.008
[9]. Vafin, A. (2018). Should Firms Lower Product Price in Recession? A Review on Pricing Challenges for Firms in Economic Downturn. ResearchBerg Review of Science and Technology, 2(3), 1–24. Retrieved from https://researchberg.com/index.php/rrst/article/view/34
[10]. Hanna, V., & Walsh, K. (2008). Interfirm Cooperation among Small Manufacturing Firms. International Small Business Journal: Researching Entrepreneurship, 26(3), 299–321. https://doi.org/10.1177/0266242608088740
[11]. Fludernik, M. (1993). Second Person Fiction: Narrative “You” As Addressee And/Or Protagonist. AAA: Arbeiten Aus Anglistik Und Amerikanistik, 18(2), 217–247. https://www.jstor.org/stable/43023644
[12]. Krosnick, J. A. (2018). Questionnaire Design. The Palgrave Handbook of Survey Research, 439–455.
[13]. Sugimoto, C. R., & Cronin, B. (2012). Citation gamesmanship: testing for evidence of ego bias in peer review. Scientometrics, 95(3), 851–862. https://doi.org/10.1007/s11192-012-0845-z
[14]. ROFF, D. A., & FAIRBAIRN, D. J. (2007). The evolution of trade-offs: where are we? Journal of Evolutionary Biology, 20(2), 433–447. https://doi.org/10.1111/j.1420-9101.2006.01255.x
[15]. Falk, A., & Fischbacher, U. (2006). A theory of reciprocity. Games and Economic Behavior, 54(2), 293–315. https://doi.org/10.1016/j.geb.2005.03.001
[16]. Graham, L., Jordan, L., Hutchinson, A., & de Wet, N. (2017). Risky behaviour: a new framework for understanding why young people take risks. Journal of Youth Studies, 21(3), 324–339. https://doi.org/10.1080/13676261.2017.1380301