


1. Introduction
In the tech industry, M&A is a key growth strategy. Microsoft's 2016 acquisition of LinkedIn was significant, with Microsoft aiming to expand in enterprise social networking and LinkedIn seeking resource support. This deal drew industry-wide attention, sparking interest in its outcomes.
Previous studies had limitations, one of previous study concentrated on financial data analysis during the post-acquisition, but failed to consider factors like cultural integration and technological synergy [1]. The other study mainly focusing on accounting treatment, lacking in-depth exploration of overall financial performance, such as long-term profitability and market positioning [2].
This research evaluates Microsoft's acquisition of LinkedIn's financial performance, analyzing its short-term and long-term impacts on both firms' finances. It theoretically adds to the M&A financial performance literature. Practically, it offers insights for firms planning M&A, helping them improve deal success.
2. Microsoft and LinkedIn analysis before acquisition
2.1. Microsoft financial condition from 2013 to 2015
Established in 1975, Microsoft first gained fame with MS-DOS. The graphical user interface (GUI) of Windows 95 promoted PC adoption. SharePoint enhanced enterprise collaboration capability, while MSN faltered in the consumer social media-oriented field. Azure is driving growth in cloud computing.
Microsoft's 2013 - 2015 annual reports show a diverse revenue mix. The productivity and business processes segment, led by the Office suite, had a steady high share. In 2013, it accounted for approximately 34.4% of the total revenue. In 2014, it accounted for 30.95% of the total revenue; in 2015, it accounted for 28.32%. This showed the segment's stability and strong market position.
The Intelligent Cloud segment, powered by Azure, showed a steady growth trend. Its revenue grew from 21.74 billion in 2013 to $27.32 billion in 2015, with a compound annual growth rate (CAGR) of approximately 4.46%, indicating its potential as a future growth driver.
The more personal computing segment, which includes Windows and other consumer-related products, contributed a large but volatile portion of the revenue. Due to the saturation of the PC market, its revenue fluctuated, dropping from 38.46 billion in 2013 to $43.16 billion in 2015.
Factors such as cost control in research and development (R&D) and marketing and market trends influenced profitability. The digital transformation of enterprises drove the Intelligent Cloud segment's growth, while the PC market's saturation limited the expansion of the More Personal Computing segment. Microsoft's R&D expenses as a percentage of revenue remained around 13% during 2013-2015, indicating a continuous investment in innovation. However, this also added to the costs. In terms of profit, the net income in 2013 was 21.863 billion, which changed to $22.074 billion in 2014 and $12.193 billion in 2015. These fluctuations were due to various factors like changes in revenue mix, cost management, and impairment charges.
2.2. LinkedIn financial condition from 2013 to 2015
LinkedIn, a professional networking platform, connects users via career profiles. Revenue comes from Talent Solutions (recruitment tools), Marketing Solutions (targeted ads), and premium subscriptions.
From 2013 to 2015, annual reports show that Talent Solutions grew steadily, driven by the economic recovery and the increasing demand for talent in the corporate world. Its revenue grew from $910.257 million in 2013 to $1877.195 million in 2015, with a CAGR of approximately 44.5%. The Marketing Solutions segment grew relatively slowly due to intense competition in the online advertising market. It reached $581.328 million in 2015, with a lower growth rate than Talent Solutions. Premium subscriptions served as a supplementary source of income, reaching $532.388 million in 2015.
LinkedIn expanded and invested heavily in R&D, marketing, and user growth during this period, which led to high costs and a low net profit margin. In 2015, the net profit margin was -5.51%, much lower than that of other mature companies. However, its growing user base indicated significant profit potential. By 2015, it had accumulated over 400 million global users. The company's assets were mainly intangible assets, such as user data. Liabilities primarily consisted of accounts payable and deferred revenue, suggesting a stable financial position despite the challenges posed by competition and expansion. But its growing user base signaled profit potential. Assets focused on intangibles like user data. Liabilities were mainly accounts payable and deferred revenue, with a stable financial position despite competition and expansion challenges.
Financially, although LinkedIn had a relatively small net profit at that time, its business growth momentum was strong. The continuous growth of the user base provided a solid foundation for future profit growth. For example, the large-scale user data could be further monetized through more targeted advertising services and an enhanced recruitment solution. Moreover, the brand value of LinkedIn was increasing with the expansion of its user network, which could attract more corporate customers for Talent Solutions and more advertisers for Marketing Solutions. Despite the current low-profit situation, with effective cost control measurement and business model optimization in the future, LinkedIn has the potential to transform its scale advantage into a profit advantage.
3. Empirical analysis
The event occurred on June 13th, 2016, when Microsoft announced its acquisition of LinkedIn. In this research, the baseline will be the day of the acquisition announcement, which is set as t. Then, the event period is set as the previous five trading days (t-5) until the next five trading days (t+5), which can significantly reflect short-term market behavior. After that, the estimation period is set as 120 trading days (t-125) before the event period, which reflects the actual return rate (
3.1. AR and CAR calculation
3.1.1. Actual return rate and market return rate
The
where
3.1.2. Expected return rate
The
where
3.1.3. Abnormal return rate
The
3.1.4. Cumulative abnormal return rate
The
3.2. Result analysis
3.2.1. AR and CAR result for Microsoft
The calculation of AR and CAR for Microsoft is based on CAR analysis and all formulas above. The results are illustrated in Table 1 and Figure 1 below.
|
Day |
Actual Return |
Expected Return |
Abnormal Return |
Cumulative Abnormal Return |
|
t=-5 |
0.66% |
-0.35% |
1.00% |
1.00% |
|
t=-4 |
-0.06% |
0.37% |
-0.43% |
0.58% |
|
t=-3 |
-0.12% |
0.06% |
-0.18% |
0.40% |
|
t=-2 |
-0.81% |
-0.12% |
-0.68% |
-0.28% |
|
t=-1 |
-0.27% |
0.00% |
-0.27% |
-0.56% |
|
t=0 |
-2.60% |
-0.80% |
-1.80% |
-2.36% |
|
t=1 |
-0.62% |
-0.07% |
-0.55% |
-2.90% |
|
t=2 |
-0.28% |
-0.10% |
-0.18% |
-3.09% |
|
t=3 |
1.41% |
0.02% |
1.39% |
-1.70% |
|
t=4 |
-0.52% |
-0.33% |
-0.19% |
-1.89% |
|
t=5 |
-0.12% |
0.20% |
-0.32% |
-2.21% |
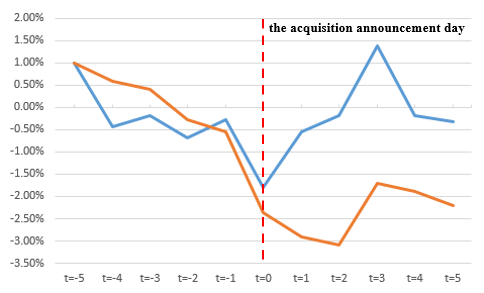
Table 1 and Figure 1 show a change in the return rate during Microsoft's acquisition of LinkedIn. At the start of the event period (t=-5), according to formula (1), the
Between t=-4 and t=-1, most of the
At the acquisition declaration day at t=0, the
After the declaration day, at t = 3, a significant positive
3.2.2. AR and CAR results for LinkedIn
Calculating AR and CAR for LinkedIn is the same as calculating for Microsoft, and the results are illustrated in Table 2 and Figure 2 below:
|
Day |
Actual Return |
Expected Return |
Abnormal Return |
Cumulative Abnormal Return |
|
t=-5 |
0.47% |
-2.10% |
2.57% |
2.57% |
|
t=-4 |
-1.47% |
2.07% |
-3.55% |
-0.98% |
|
t=-3 |
0.11% |
0.27% |
-0.16% |
-1.14% |
|
t=-2 |
2.00% |
-0.80% |
2.79% |
1.65% |
|
t=-1 |
-3.98% |
-0.07% |
-3.92% |
-2.27% |
|
t=0 |
46.6% |
-4.75% |
51.39% |
49.12% |
|
t=1 |
-0.30% |
-0.51% |
0.21% |
49.33% |
|
t=2 |
-0.18% |
-0.65% |
0.47% |
49.80% |
|
t=3 |
0.02% |
0.06% |
-0.03% |
49.77% |
|
t=4 |
-0.28% |
-2.01% |
1.73% |
51.50% |
|
t=5 |
0.00% |
1.08% |
-1.08% |
50.42% |
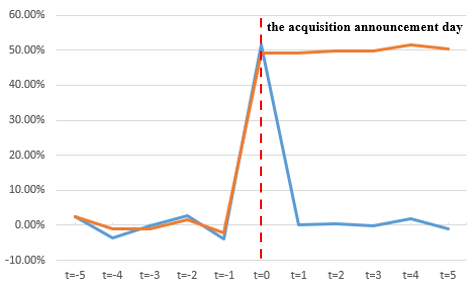
From Table 2 and Figure 2, the
Market sentiment also fluctuated. On t=-4,
On the acquisition declaration day, at t = 0, LinkedIn experienced a remarkable upsurge. The
After the declaration day, although there were days with negative
3.2.3. T-test for Microsoft and LinkedIn for AR
After conducting the T-test for AR for Microsoft, as shown in Table 3, calculation obtained -2.68 for the t-statistic and a 0.02 for the p-value. p value is under significant level (α = 0.05), which means reject null hypothesis. It indicates that Microsoft's market response before and after the acquisition of LinkedIn was statistically significant. Negative t-statistics and corresponding p-values show the market has a negative reaction toward this acquisition, but this reaction is not constant and stable. Then, the T-test was performed on
|
Microsoft AR |
LinkedIn AR |
|
|
Mean |
-0.01 |
0.27 |
|
Standard Deviation |
0.00 |
0.08 |
|
T-Statistics |
-2.68 |
3.45 |
|
P-value |
0.02 |
0.01 |
From the perspective of short-term market value, CAR before and after the Microsoft acquisition declaration shows a fluctuating state, and the overall value is negative until the end of the event period (-2.21%). This implies that, in the short term, the market has concerns and doubts about Microsoft's decision to acquire LinkedIn, which might not positively bring Microsoft value. Regarding short-term market value for LinkedIn, its
The contrasting market reactions of Microsoft and LinkedIn underscore the different perceptions of their roles in the acquisition. As the acquirer, Microsoft faced skepticism due to concerns about integration risks and financial implications. In contrast, LinkedIn was viewed as a growth-enhancing asset, with the market expecting significant benefits from Microsoft's resources. This divergence provides insights into how investors evaluate different entities in an acquisition scenario.
These divergent market reactions underscore the contrasting roles of Microsoft and LinkedIn in the acquisition. While Microsoft faced scrutiny over integration risks, LinkedIn was seen as a growth-potential asset, reflecting investors' differing expectations for each company.
4. Financial evaluation of acquisition
4.1. Short-term financial analysis
In terms of revenue, LinkedIn's Talent Solutions business made progress through Microsoft's channel expansion. From 2015 to 2017, the revenue of this business increased from approximately $1.6 billion to about $2.1 billion, with a growth rate of 31.25%. This was due to Microsoft's user base and Channel resources. For example, Office 365 users might be guided to use related services. However, the Marketing Solutions business faced sluggish revenue growth or decline due to fierce market competition and integration issues with Microsoft's advertising business. In the first year after the merger, Microsoft and LinkedIn's total revenue reached $89.95 billion, a 5.5% increase compared to before the acquisition. Nevertheless, the growth mainly relied on the Talent Solutions business, reflecting an unbalanced integration effect [9].
Regarding costs and profits, the integration costs had a significant impact. Although it's difficult to specify the expenses for personnel training and position adjustment, their influence on profits is specific. R&D investment increased to promote business synergy, and while there were cost savings in procurement and operation, overall cost control remained under pressure. The gross profit margin increased from 61.5% before the acquisition to 61.9% after, and the net profit margin rose from 19.7% to 23.5%. However, the growth in profit margins might not stem from improved operational efficiency and requires further analysis.
In terms of cash flow, the operating cash flow was affected in the initial stage of the acquisition. Delays in customer order delivery and contract renewals decreased cash inflow in the first quarter. Although there was an improvement in subsequent quarters, there is a lack of data support. The investment cash flow increased significantly due to LinkedIn's technology upgrade and market expansion, with an outflow of approximately $2.7 billion, which pressured capital liquidity.
4.2. Long-term financial analysis
Over time, the synergistic effects of the acquisition gradually emerged. The financial indicator trends were positive. The revenue growth rate rose to 14% in the third year after the acquisition. Microsoft combined LinkedIn's professional social data with its business intelligence tools to provide accurate enterprise market insights. It also promoted its products through LinkedIn, expanding its market coverage. The net profit margin reached 3.65% in the fifth year, which benefited from cost control optimization and business scale effects. For example, sharing technical facilities and optimizing the supply chain reduced costs, and expanding business scale brought about economies of scale in procurement and R&D. The return on assets increased from 8.6% before the acquisition to 10.5%, indicating improved asset utilization efficiency.
The synergistic effects deepened. In customer resource integration, Microsoft integrated the data from both sides and enhanced customer conversion and loyalty through precision marketing [10]. Taking Dynamics 365 as an example, although there is no accurate data on new customer growth in the fourth year after the acquisition, LinkedIn's data provided potential customer leads, helping to offer a targeted solution. In cross-selling, LinkedIn introduced many enterprise-level customers to Azure cloud services, increasing Azure's market share in LinkedIn's enterprises from 20% before the acquisition to 24% in the fifth year.
Compared with its industry peers, Salesforce's acquisition of MuleSoft, Microsoft performed better in terms of revenue growth rate and net profit margin improvement. In the fourth year after the acquisition, Microsoft's revenue growth rate was 10%, while that of Salesforce was 25%. In the fifth year, Microsoft's net profit margin reached 32.5%, exceeding Salesforce's 7.4%. Compared with Google, Microsoft's competitiveness in the enterprise service market was enhanced by the acquisition of LinkedIn. It gradually narrowed the gap in revenue growth and market share acquisition, and performed prominently in subfields such as enterprise social networking and recruitment services.
5. Conclusion
This paper employs a case study, an event study with CAR analysis, and a comparative analysis to explore Microsoft’s acquisition of LinkedIn. In terms of the short-term impact, although the growth in some business areas offset the integration costs, Microsoft’s stock presented a negative CAR of -2.21% around the acquisition announcement, suggesting that the market harbored concerns. In contrast, LinkedIn’s high CAR indicated that the market acknowledged its significant value growth potential. In the long term, the acquisition has demonstrated remarkable success. Positive synergies have enhanced key financial indicators, such as revenue, profit, and asset utilization. This has significantly improved Microsoft’s competitiveness in relevant markets and resulted in a notable increase in net profit compared to similar mergers and acquisitions, indicating that the acquisition has been a successful strategic move for both companies.
However, the study does have its limitations. The data sources were relatively limited, mainly relying on information from Investing.com, which may carry certain biases and fail to cover all aspects. Additionally, the event study method was based on the efficient market hypothesis. Yet, real-world markets do not continuously operate under such ideal conditions, potentially affecting the precision of the analysis.
Regarding future research directions, it is advisable to seek out a more diverse range of data sources to enrich the datasets and improve the accuracy of the analysis. Long-term follow-up studies can be carried out to observe the long-term influence of the acquisition on the comprehensive business strategies and ecosystem development of both companies. Moreover, in-depth exploration of the factors that impact the realization of synergies can provide more targeted and practical guidance for future M&A activities.
References
[1]. Fischer, D. (2018). Microsoft Purchase of LinkedIn: Accounting Changes after Acquisitions. Retrieved from http://dx. doi. org/10. 2139/ssrn. 3909416
[2]. Fischer, D. and Tinkelman, D. (2020). LinkedIn's Financial Accounting Before and After Microsoft Acquired It: Instructional Case. Retrieved from http://dx. doi. org/10. 2139/ssrn. 4419149
[3]. Kiesel, F. , Ries, J. M. and Tielmann, A. (2017) The Impact of Mergers and Acquisitions on Shareholders' Wealth in the Logistics Service Industry. International Journal of Production Economics, 193, 781-797.
[4]. Lin, C. (2024) Comparative Analysis of S&P 500 and NASDAQ: A Machine Learning Approach to Understanding Differential Market Sensitivity and Growth Stocks. SHS Web of Conferences, 188, 1003.
[5]. Fama, E. F. (1970) Efficient Capital Markets: A Review of Theory and Empirical Work. The Journal of Finance (New York), 25, 383-417.
[6]. Jayaraman, N. , Mandelker, G. and Shastri, K. (1991) Market Anticipation of Merger Activities: An Empirical Test. Managerial and Decision Economics, 12, 439-448.
[7]. Angwin, D. N. , Urs, U. , Appadu, N. , Thanos, I. C. , Vourloumis, S. and Kastanakis, M. N. (2022) Does Merger & Acquisition (M&A) Strategy Matter? A Contingency Perspective. European Management Journal, 40, 847-856.
[8]. Gupta, I. , Raman, T. V. and Tripathy, N. (2023) Impact of Merger and Acquisition on Financial Performance: Evidence from Construction and Real Estate Industry of India. FIIB Business Review, 12, 74-84.
[9]. Chaturvedi, T. and Weigelt, C. (2024) Operating Synergy and Post-Acquisition Integration in Corporate Acquisitions: A Resource Reconfiguration Perspective. Long Range Planning, 57, 102428.
[10]. Adesola, O. A. , Stanley, C. U. , Oluwatoyin, F. A. and Bibitayo, E. A. (2024) The Role of Digital Transformation in Post-merger Integration. Financial & Accounting Research Journal, 6, 1501-1516.
Cite this article
Liu,Y. (2025). The Acquisition of Microsoft and LinkedIn: A Financial Performance Study by Using Cumulative Abnormal Return Rate Analysis. Advances in Economics, Management and Political Sciences,190,47-56.
Data availability
The datasets used and/or analyzed during the current study will be available from the authors upon reasonable request.
Disclaimer/Publisher's Note
The statements, opinions and data contained in all publications are solely those of the individual author(s) and contributor(s) and not of EWA Publishing and/or the editor(s). EWA Publishing and/or the editor(s) disclaim responsibility for any injury to people or property resulting from any ideas, methods, instructions or products referred to in the content.
About volume
Volume title: Proceedings of ICEMGD 2025 Symposium: Digital Transformation in Global Human Resource Management
© 2024 by the author(s). Licensee EWA Publishing, Oxford, UK. This article is an open access article distributed under the terms and
conditions of the Creative Commons Attribution (CC BY) license. Authors who
publish this series agree to the following terms:
1. Authors retain copyright and grant the series right of first publication with the work simultaneously licensed under a Creative Commons
Attribution License that allows others to share the work with an acknowledgment of the work's authorship and initial publication in this
series.
2. Authors are able to enter into separate, additional contractual arrangements for the non-exclusive distribution of the series's published
version of the work (e.g., post it to an institutional repository or publish it in a book), with an acknowledgment of its initial
publication in this series.
3. Authors are permitted and encouraged to post their work online (e.g., in institutional repositories or on their website) prior to and
during the submission process, as it can lead to productive exchanges, as well as earlier and greater citation of published work (See
Open access policy for details).
References
[1]. Fischer, D. (2018). Microsoft Purchase of LinkedIn: Accounting Changes after Acquisitions. Retrieved from http://dx. doi. org/10. 2139/ssrn. 3909416
[2]. Fischer, D. and Tinkelman, D. (2020). LinkedIn's Financial Accounting Before and After Microsoft Acquired It: Instructional Case. Retrieved from http://dx. doi. org/10. 2139/ssrn. 4419149
[3]. Kiesel, F. , Ries, J. M. and Tielmann, A. (2017) The Impact of Mergers and Acquisitions on Shareholders' Wealth in the Logistics Service Industry. International Journal of Production Economics, 193, 781-797.
[4]. Lin, C. (2024) Comparative Analysis of S&P 500 and NASDAQ: A Machine Learning Approach to Understanding Differential Market Sensitivity and Growth Stocks. SHS Web of Conferences, 188, 1003.
[5]. Fama, E. F. (1970) Efficient Capital Markets: A Review of Theory and Empirical Work. The Journal of Finance (New York), 25, 383-417.
[6]. Jayaraman, N. , Mandelker, G. and Shastri, K. (1991) Market Anticipation of Merger Activities: An Empirical Test. Managerial and Decision Economics, 12, 439-448.
[7]. Angwin, D. N. , Urs, U. , Appadu, N. , Thanos, I. C. , Vourloumis, S. and Kastanakis, M. N. (2022) Does Merger & Acquisition (M&A) Strategy Matter? A Contingency Perspective. European Management Journal, 40, 847-856.
[8]. Gupta, I. , Raman, T. V. and Tripathy, N. (2023) Impact of Merger and Acquisition on Financial Performance: Evidence from Construction and Real Estate Industry of India. FIIB Business Review, 12, 74-84.
[9]. Chaturvedi, T. and Weigelt, C. (2024) Operating Synergy and Post-Acquisition Integration in Corporate Acquisitions: A Resource Reconfiguration Perspective. Long Range Planning, 57, 102428.
[10]. Adesola, O. A. , Stanley, C. U. , Oluwatoyin, F. A. and Bibitayo, E. A. (2024) The Role of Digital Transformation in Post-merger Integration. Financial & Accounting Research Journal, 6, 1501-1516.