


1. Introduction
The UK grocery retail sector is highly competitive, characterized by shifting consumer demands for value, quality, and convenience. As the second-largest supermarket chain in the UK, Sainsbury’s faces challenges from discount retailers, technological disruption, and persistent inflationary pressures. Despite these obstacles, Sainsbury’s has demonstrated resilience, with a 1.6% increase in underlying profit to £701 million and a 6.8% rise in retail sales in the 52 weeks ending March 2024, largely driven by its successful "Food First" strategy. However, the company faces significant challenges, including a high P/E ratio of 43.79, which surpasses competitors like Tesco (16.8) and Walmart (25.4). This valuation reflects market concerns, as Sainsbury's share price has trended downward from January to April 2024. Nevertheless, the company has room for improvement, leveraging its differentiation strategy, easing inflationary pressures, and potential industry consolidation opportunities to strengthen its market position. This report provides a comprehensive financial analysis and valuation of Sainsbury's, based on its 2023 annual report and supplementary market data, concluding with a target price of 283p per share and a "Hold" recommendation.
2. Industry overview & competitive positioning
2.1. Industry analysis
The grocery retail market is a highly competitive industry, driven by consumer demand for convenience, quality, and value. Retailers compete on various factors, including price, product range, and customer experience, in order to meet these evolving consumer expectations [1]. According to Data Bridge, the global grocery market will be approximately USD 126 billion in 2023 and is expected to reach USD 193.4 billion by 2031, at a CAGR of 5.50 per cent. This indicates that the global grocery market has the potential for steady and sustainable growth.
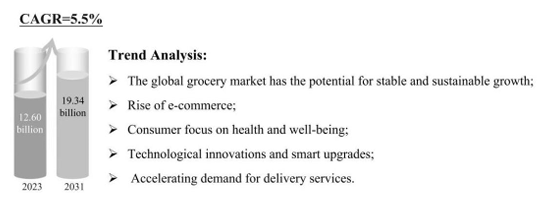
Figure 1: Predicted industry scale and the average annual compound growth rate
2.2. Competitive strategy analysis
According to Sainsbury’s Preliminary Results Announcement 2024, Sainsbury’s competitive advantage lies in its ability to develop price competitiveness through its cost leadership strategy; and to innovate and strengthen its product brands through its differentiation strategy. These effective strategies have enabled the brand to survive, grow and expand in an increasingly competitive market environment.

Figure 2: The competitive strategy analysis of Sainsbury
3. Corporate strategy analysis
Sainsbury’s strategy is structured around five strategic priorities, with the core objective of progressively streamlining operations and accelerating cost savings programmes to support investment in improving food quality, increasing product choice and driving innovation [2]. The company's investments will be focused on supporting the core food business and it remains committed to improving the efficiency of the overall business, in order to create greater value for customers and shareholders.
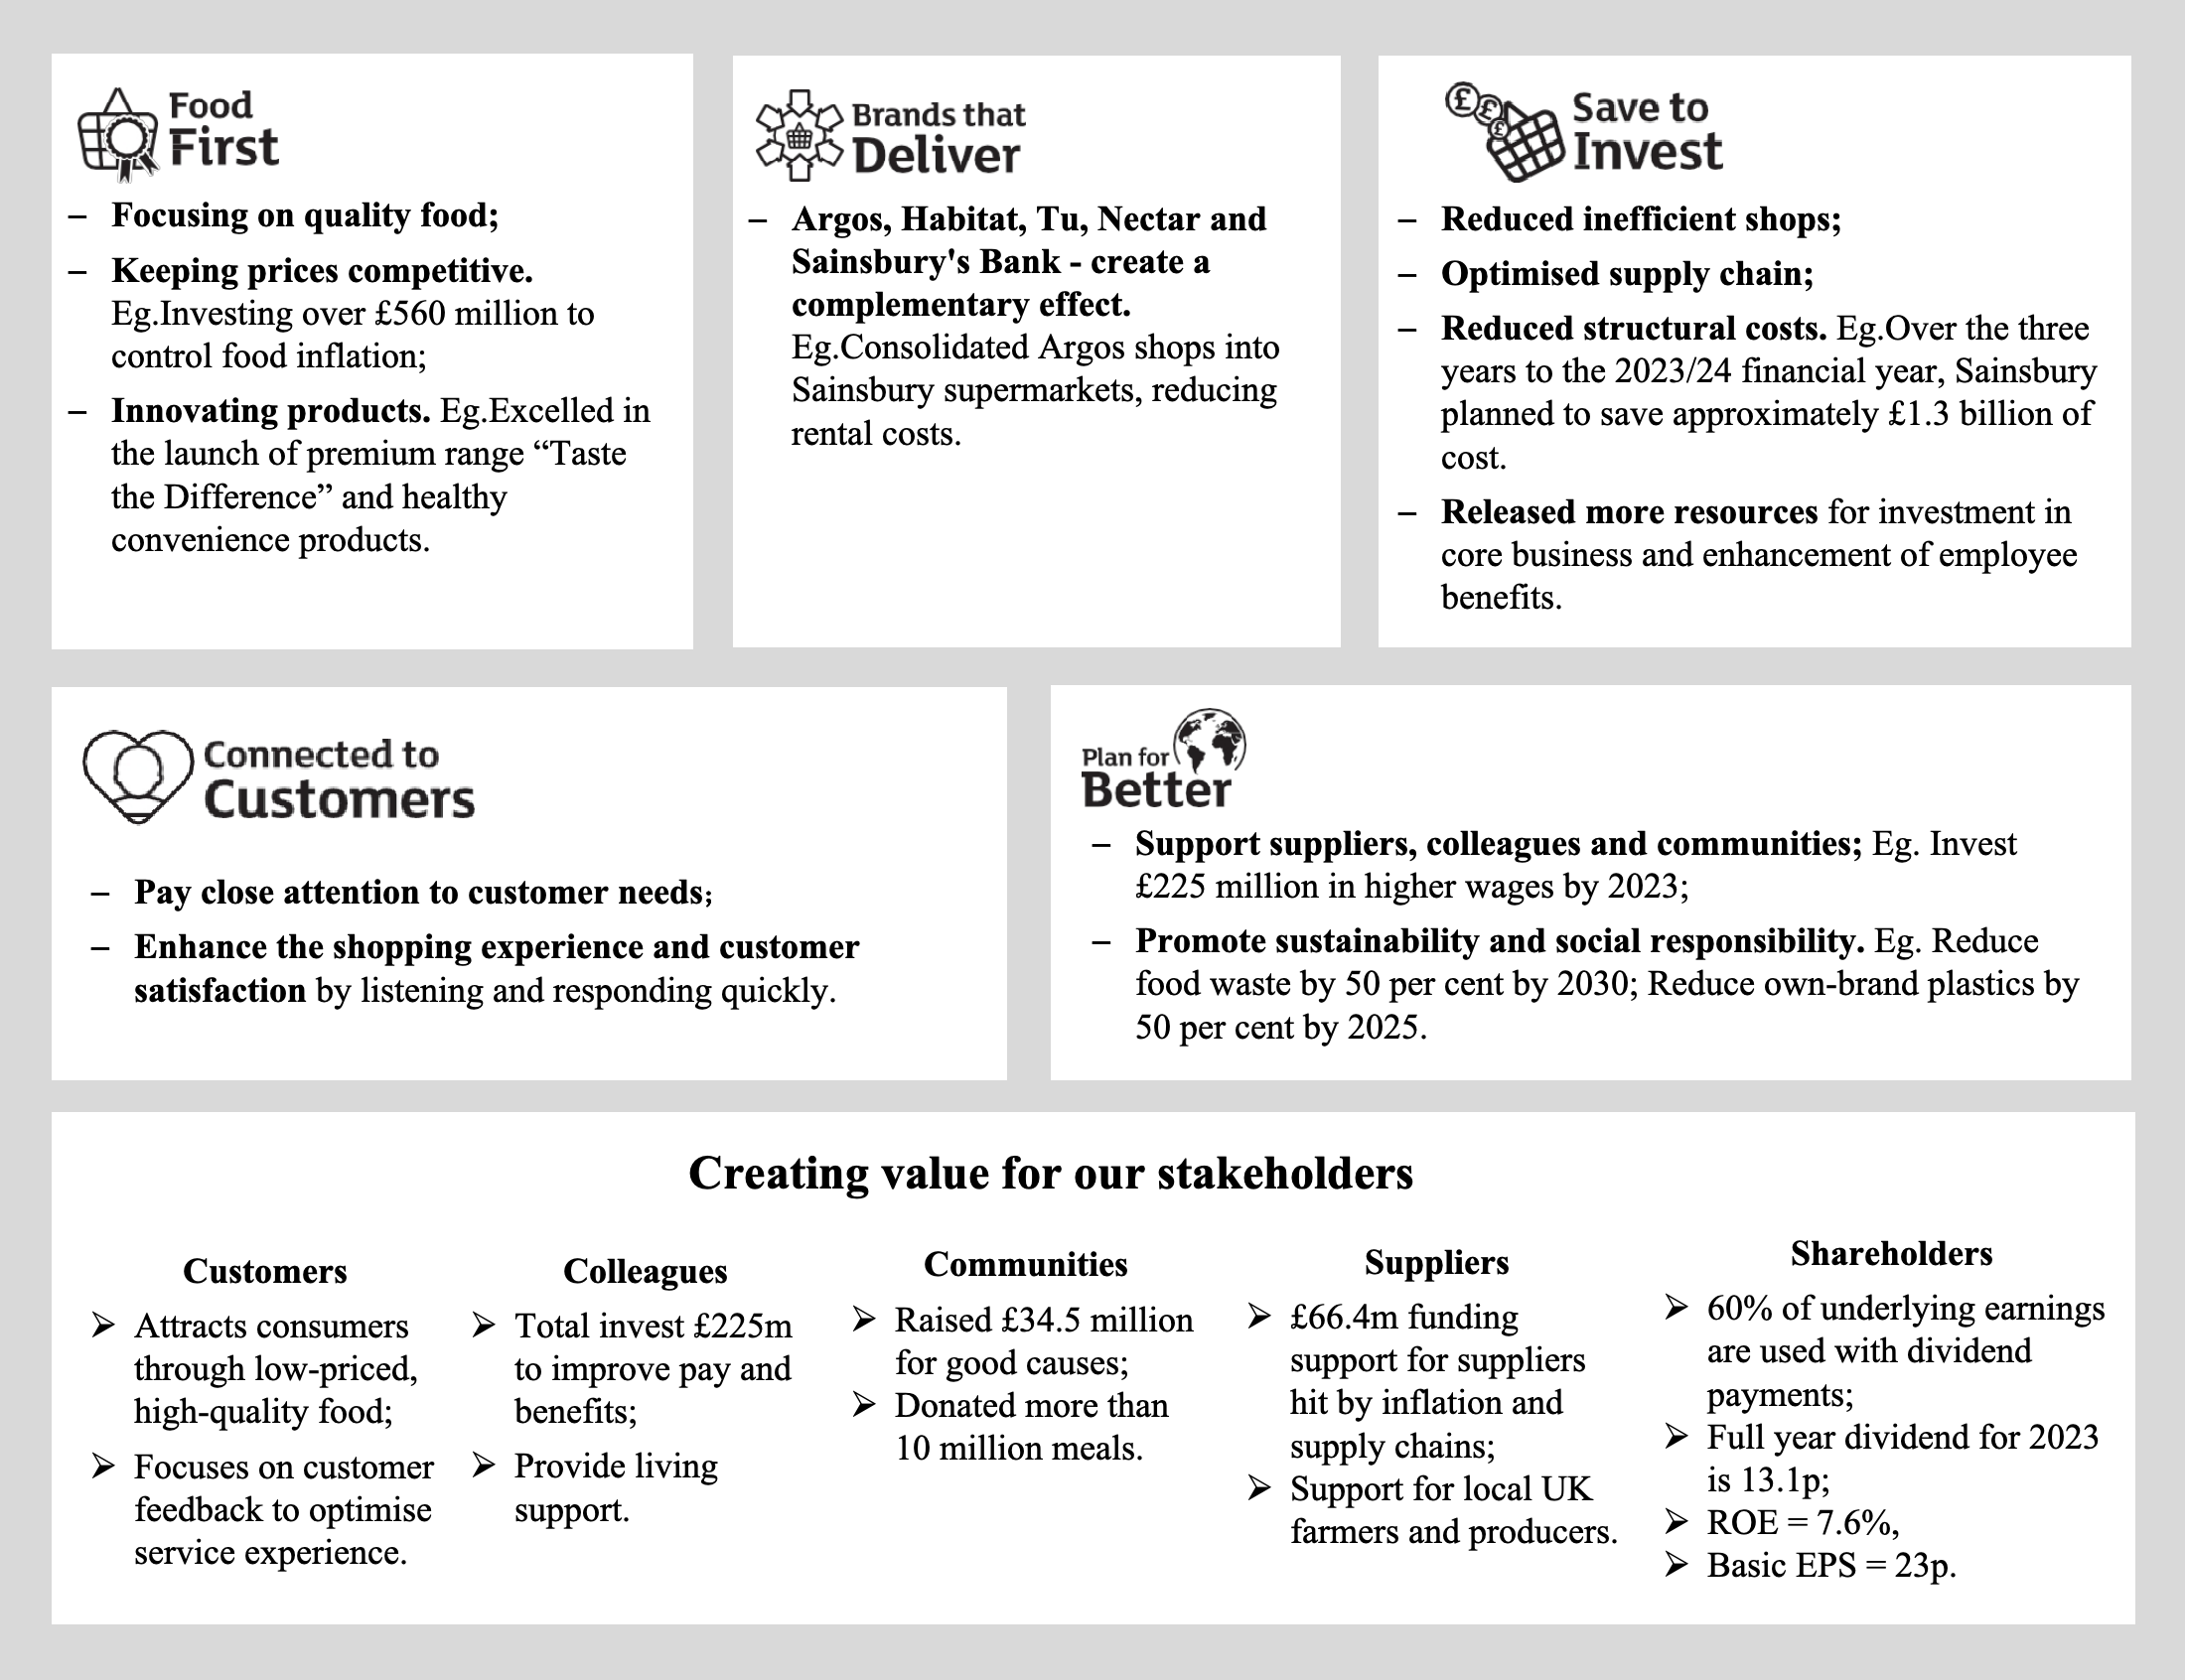
Figure 3: The corporate strategy analysis of Sainsbury
4. Corporate strategy analysis
4.1. Ratio analysis
According to the Statement of Directors' Responsibilities and Independent Auditor's Report on Sainsbury's 2023 financial statements disclosures [2], the Board of Directors strictly complies with the corresponding accounting standards to ensure that the financial statements give a true and fair view of the Group's financial position and results of operations. Ernst & Young's independent auditor has confirmed that the financial statements comply with the requirements of the Companies Act 2006 and that no material uncertainties have been identified that threaten the Company's ability to operate.
|
Analysis of Profitability |
2023 |
2024 |
Change |
Industry Average Ratio |
|
ROE |
2.85% |
1.99% |
-0.86% |
4.1% |
|
ROA |
0.79% |
0.55% |
-0.24% |
0.9% |
|
Gross margin |
6.36% |
7.14% |
0.78% |
6.2% [3] |
|
Operating margin |
1.78% |
1.63% |
-0.16% |
1.0% |
|
Dupont Decomposition |
||||
|
Net Margin |
0.66% |
0.42% |
-0.24% |
0.7% [4] |
|
Assets Turnover |
1.20 |
1.30 |
0.10 |
1.25 |
|
Equity Multiplier |
3.61 |
3.65 |
0.04 |
3.5 |
|
Analysis of Operating Capacity |
||||
|
Inventory Turnover |
15.91 |
15.82 |
-0.09 |
17.5 [5] |
|
Receivables Turnover |
48.08 |
54.09 |
6.02 |
50.0 |
|
Payables Turnover |
6.27 |
6.10 |
-0.17 |
6.5 |
|
Analysis of Solvency |
||||
|
Current Ratio |
2.13 |
1.96 |
-0.17 |
0.84 [6] |
|
Quick Ratio |
1.62 |
1.46 |
-0.16 |
0.39 |
|
Equity Ratio |
0.28 |
0.27 |
-0.01 |
0.3 |
|
Debt-to-Asset Ratio |
0.72 |
0.73 |
0.01 |
0.7 |
The following conclusions can be drawn from the comparison and analysis of Sainsbury's financial ratios for 2023-2024:
•In terms of Profitability, Sainsbury's Return on Equity (ROE), Return on Total Assets (ROA) and Net Profit Margin are below the industry average level and slightly declining, indicating that the company needs to optimize its asset allocation and improve its revenue structure. Nevertheless, Gross margin has improved and is above the industry average, suggesting that the cost-control strategy is effective.
•In terms of operating capability, Sainsbury's Assets Turnover has improved and is close to industry level. However, inventory management efficiency is slightly lower than the industry and has declined slightly, suggesting that Sainsbury needs to further optimize its inventory strategy to address the risk of slow-moving sales. Meanwhile, Sainsbury's accounts receivable management is significantly better than the industry, suggesting a strong cash flow recovery.
•In terms of Solvency, Sainsbury's financial leverage is slightly higher than the industry average, with a slight increase in long-term debt risk. Therefore, it needs to focus on its capital structure to balance debt risk and return. Short-term solvency is well above the industry, with low liquidity risk.
5. Forecasts
5.1. Pro-forma balance sheet and income statement
The principal assumptions used in the computation of the pro forma statements and their respective rationales are set out below:
|
Forecasting assumptions of Growth % |
|
|
Net Sales |
2.29% |
|
NOPAT Margin |
5.5% |
|
Non-operating expense |
-13.71% |
|
Dividend Payout Ratio |
60% |
|
Net Operating Working Capital |
4.60% |
|
Net Long-term Operating Assets |
-1.63% |
|
Net Financial Liabilities |
-0.06% |
|
Total Equity |
0.43% |
In order to smooth out the short-term market volatility and provide a robust & effective forecast of the company's long-term financial performance, the report uses the Compound Annual Growth Rate (CAGR) as a forecasting tool based on Sainsbury's disclosed actual data for the period 2021-2024 to project Sainsbury's annual growth rate for key financial statement items. The forecast results will be reasonably adjusted according to the following macroeconomic environment, corporate strategies and market trends. The formula for calculating CAGR is set out below:
On the revenue side, UK’s food inflation is expected to fall from 18% in 2023 to 5%-6% in 2024[7], the price-driven sales effect has been weakening. Meanwhile, he continued expansion of discount retailers (Aldi and Lidl)[8] limits the scope for further market expansion. As a result, sales growths has become asymptotically conservative following mean reversion theory.
On the profit side, Cost-Saving programmes will directly drive margin improvement. Sainsbury also plans to accelerate the divestment of inefficient non-core businesses, thereby reducing the drag of losses and further improving profit performance[9].
In terms of capital allocation, Sainsbury maintains a high dividend rate to protect shareholder returns. The company's capital structure is stable, with Net Financial Liabilities remaining broadly unchanged and Total equity growing more slowly.
In terms of operations and assets, Sainsbury's inventory turnover declines in 2023, so the company is expected to expand working capital in the future to address supply chain risks. At the same time, Sainsbury's capital expenditure continues to be prudent, with the company prioritizing investment in digitalization and supply chain optimization over large-scale fixed asset expansion, resulting in slower growth in long-term assets.
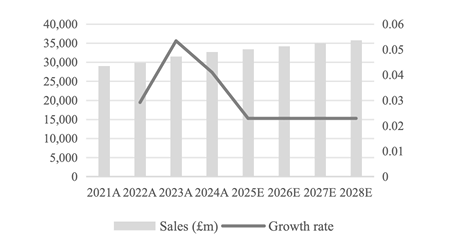
Figure 4: Net sales (£m) and corresponding growth rate of Sainsbury in 2021~2028
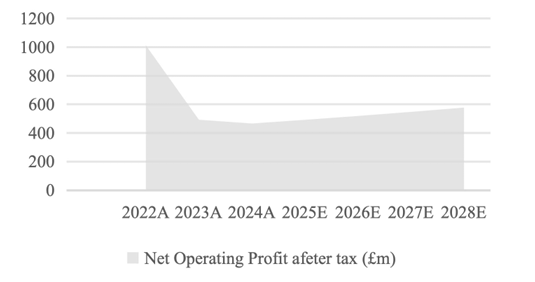
Figure 5: Net operating profit after tax (£m) of Sainsbury in 2021~2028
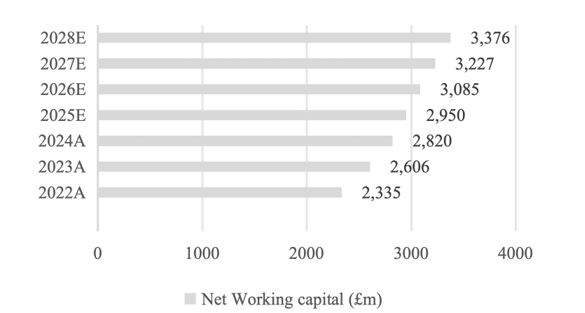
Figure 6: Net working capital (£m) of Sainsbury in 2021~2028
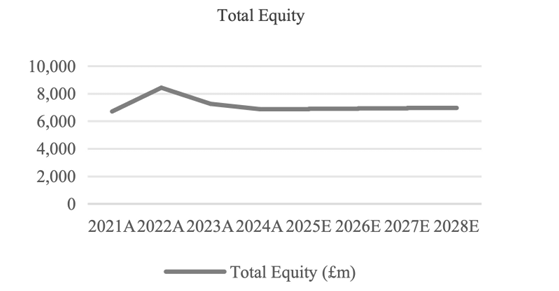
Figure 7: Total equity (£m) of Sainsbury in 2021~2028
5.2. Reformulated and compressed income statement and balance sheet
The projected financial statements using the above assumptions are as follows (£ million).
|
Income Statement |
2022A |
2023A |
2024A |
2025E |
2026E |
2027E |
2028E |
|
Net Sales |
29,895 |
31,491 |
32,700 |
33,449 |
34,215 |
34,998 |
35,800 |
|
Net Operating Profit after Tax (NOPAT) |
1,011 |
492 |
465 |
491 |
518 |
599 |
632 |
|
Non-operating Expenses |
(264) |
(92) |
(74) |
(64) |
(55) |
(48) |
(41) |
|
Net profit attributable to equity shareholders of the parent company |
747 |
400 |
391 |
427 |
463 |
551 |
591 |
|
Dividend |
607 |
295 |
279 |
295 |
311 |
359 |
379 |
|
Balance Sheet |
2022A |
2023A |
2024A |
2025E |
2026E |
2027E |
2028E |
|
Net Operating Working Capital |
(2,335) |
(2,606) |
(2,820) |
(2,950) |
(3,085) |
(3,227) |
(3,376) |
|
Net Long-term Operating Assets |
16,867 |
16,404 |
15,783 |
15,525 |
15,272 |
15,022 |
14,777 |
|
Net Operating Assets (NOA) |
14,532 |
13,798 |
12,963 |
12,575 |
12,186 |
11,795 |
11,401 |
|
Net Financial Liabilities |
6,109 |
6,545 |
6,095 |
6,092 |
6,088 |
6,085 |
6,081 |
|
Total Equity |
8,423 |
7,253 |
6,868 |
6,870 |
6,872 |
6,874 |
6,876 |
|
Equity and Net Financial Liabilities |
14,532 |
13,798 |
12,963 |
12,962 |
12,960 |
12,959 |
12,957 |
|
FCF Calculation |
2022A |
2023A |
2024A |
2025E |
2026E |
2027E |
2028E |
|
NOPAT |
1,011 |
492 |
465 |
491 |
518 |
599 |
632 |
|
NOA |
14,532 |
13,798 |
12,963 |
12,575 |
12,186 |
11,795 |
11,401 |
|
Change in NOA |
(734) |
(835) |
(388) |
(389) |
(391) |
(394) |
|
|
Free Cash Flow |
1,226 |
1,300 |
878 |
907 |
990 |
1,026 |
Then, these forecasted financial data will be used to estimate the target price of Sainsbury.
6. Valuation
6.1. Valuation from the equity perspective
First, using the Capital Asset Pricing Model to calculate the cost of equity RE.
|
CAPM Model |
Notes |
||
|
rf |
Risk-free Interest Rate |
5.25% [7] |
|
|
β |
Beta |
0.86 [10] |
|
|
ERP |
Equity Risk Premium |
3.95% [10] |
E(rM)-rf 3.7%~4.2% Average(3.7%+4.2%)=3.95% |
|
rE |
Cost of Equity |
8.65% |
rE =rf +β·MRP |
The report uses the Residual Income Valuation Model (RIVM) for equity valuation. This model reduces the reliance on assumptions of terminal value and focuses more on observable financial data, thus effectively reducing valuation errors. The RIVM model decomposes the equity value into the sum of the current book value of net assets (BVE) and discounted future residual income. By anchoring the intrinsic value of the company, RIVM model effectively avoids the impact of short-term market sentiment fluctuations, thus significantly reducing the impact of long-term uncertainty on valuation. The formula for calculating corporate value is set outbelow:
This report sets the terminal growth rate at 1.55%, which effectively reflects the low-growth norms of UK GDP and the grocery sector, takes increased competition of the market, inflation fluctuations and the positive effects of cost optimization into account. Therefore, this estimate is in line with the requirements for conservatism and sustainability in permanent phase.
|
RIVM Calculation as at 26 April, 2024 (£ million) |
||||||
|
2024A |
2025E |
2026E |
2027E |
2028E |
Terminal Value (TV Growth=1.55%) |
|
|
Net Earnings |
427 |
463 |
551 |
591 |
||
|
Net Dividends |
295 |
311 |
359 |
379 |
||
|
Book Value |
6,868 |
6,870 |
6,872 |
6,874 |
6,876 |
|
|
Residual Income (RI) |
(179) |
(145) |
(60) |
(22) |
(317) |
|
|
Discounted RI |
(164) |
(122) |
(47) |
(16) |
(227) |
|
|
V (Equity) |
6,291 |
With 2,369 million outstanding shares |
||||
|
Numbers of Outstanding Shares (million) |
2,369 |
|||||
|
Target Price |
266p |
|||||
6.2. Valuation from the pricing multiple perspective
Based on data from Equity Analytics [11], the report selects the price/ earnings (P/E) ratio and forward P/E ratio of typically comparable companies in the same industry. The Mean P/E level, Median P/E level and Harmonic Mean P/E level of these companies are calculated. Then use Multiplier Valuation Model to value Sainsbury's equity.
Sainsbury's P/E ratio for the last 12 months is 43.79, demonstrating the strong market confidence to its short-term earnings growth. The P/E ratio is expected to fall back to 11.5 over the next 12 months, reflecting a mean reversion trend after the earnings are delivered.
|
P/E |
||
|
Comparable Companies |
T12M |
F12M |
|
Sainsbury |
43.79 |
11.5 |
|
Tesco |
16.80 |
16.18 |
|
Walmart |
28.84 |
40.73 |
|
Marks & Spencer |
12.90 |
16.65 |
|
Pricing Multiples |
||
|
T12M |
F12M |
|
|
P/E Mean |
19.51 |
24.52 |
|
P/E Median |
16.80 |
16.65 |
|
P/E Harmonic Mean |
17.47 |
20.49 |
|
Average P/E ratio in grocery sector |
16.20 (UK FSTE) |
|
|
Sainsbury’s Earnings Per Share |
13.7p |
21.5p |
Pricing Multiple Valuation Model (Equity perspective):
|
Target Price Calculations (pence per share) |
||
|
T12M |
F12M |
|
|
P/E Mean |
322 |
442 |
|
P/E Median |
277 |
300 |
|
P/E Harmonic Mean |
288 |
369 |
According to the analysis, the outlook for Sainsbury is favourable, with EPS expected to rise to 21.5p in the forward 12 months.
7. Investment recommendation & risks
7.1. Sensitivity analysis
The matrix below shows the sensitivity analysis of the target price to the estimated cost of equity and sales growth rate in the RIVM model. The centre value of the matrix is 266p, which is the target price based on the assumed parameters in report. Depending on the combination of cost of equity and sales growth rate, the target price varies from 222p to 279p.
|
Sensitivity Matrix (Units: Pence) |
||||||||||
|
Cost of Equity |
||||||||||
|
Net Sales Growth Rate |
8.45% |
8.50% |
8.55% |
8.60% |
8.65% |
8.70% |
8.75% |
8.80% |
8.85% |
|
|
2.69% |
279 |
276 |
272 |
269 |
265 |
262 |
259 |
256 |
253 |
|
|
2.59% |
274 |
270 |
267 |
264 |
260 |
257 |
254 |
251 |
249 |
|
|
2.49% |
269 |
265 |
262 |
259 |
256 |
253 |
250 |
247 |
244 |
|
|
2.39% |
263 |
260 |
257 |
254 |
251 |
248 |
245 |
243 |
240 |
|
|
2.29% |
259 |
255 |
252 |
250 |
266 |
244 |
241 |
239 |
236 |
|
|
2.19% |
254 |
251 |
248 |
245 |
243 |
240 |
238 |
235 |
233 |
|
|
2.09% |
249 |
246 |
244 |
241 |
239 |
236 |
234 |
232 |
229 |
|
|
1.99% |
245 |
242 |
240 |
237 |
235 |
232 |
230 |
228 |
226 |
|
|
1.89% |
240 |
238 |
236 |
233 |
231 |
229 |
226 |
224 |
222 |
|
As can be seen from the table, for every 0.05% increase in the cost of equity, the target price falls by 3.2-3.5 pence. While for every 0.1% increase in the sales growth rate, the target price rises by 4.7-5.1 pence. Thus the sensitivity of the target price to the cost of equity is higher than the sales growth rate, suggesting that a rise in market interest rates or risk premiums (e.g. UK interest rate hikes) would have a greater impact on valuation.
|
Price Sensitivity |
Increase in Cost of Equity |
Increase in Growth Rate |
|
% Change |
0.05% |
0.1% |
|
Corresponding Price Change |
-3.2p ~ -3.5p |
4.7p ~ 5.1p |
As the RIVM model focuses on the intrinsic value of company, the P/E Median reflects market sentiment, the combination of the two models could reduce the limitations of a single and the risk of misjudgement. The final valuation result is the average of the RIVM model result and the P/E Median. That is, Target Price = Average (266+300) = 283p.
7.2. Scenario analysis of the target price
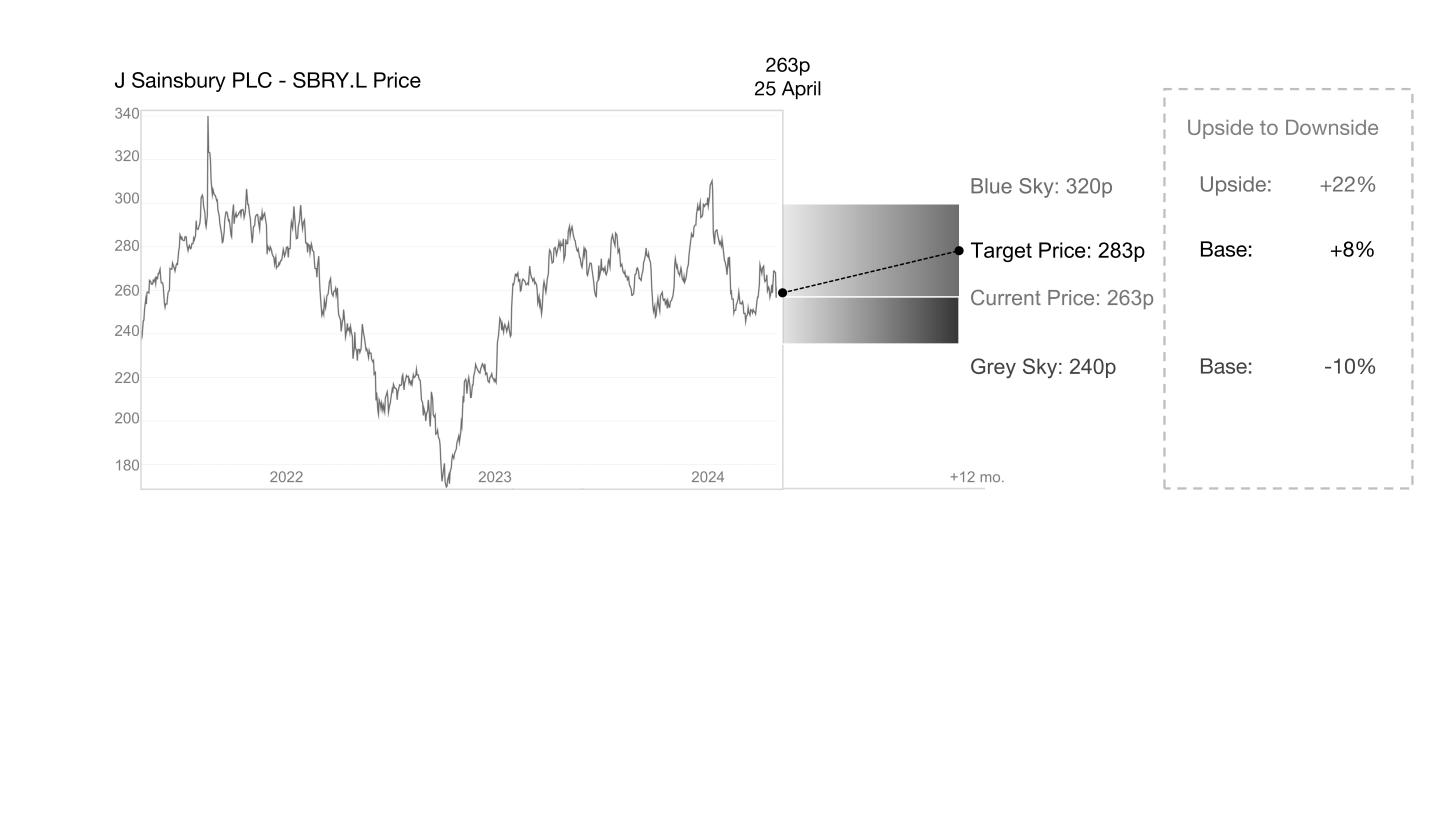
Figure 8: Scenario analysis of Sainsbury
The Blue Sky situation: Cost pressures will ease if UK food inflation stabilizes in 4-5% range. At the same time if Aldi/Lidl's expansion slows down (sales growth falls below 5%), the competitive pressure on traditional supermarkets will be eased. Driven by digital innovation and personalized recommendations, customer stickiness has further increased and sales have grown with it, lifting Sainsbury's market share to 13% and above. It is expected that Sainsbury's share price could rise to 320p.
The Grey Sky situation: If Sainsbury's cost-cutting programme fails to meet expectations, coupled with a rising tax burden and continued weakness in non-core businesses, this could erode profits and weigh on overall revenue. In addition, if the interest rates of bank continue to rise and push up the company's cost of equity, Sainsbury's share price would fall to 240p.
8. Conclusion
On April 26, 2024, the valuation of Sainsbury calculated using the RIVM and the Pricing Multiple Model was 283 pence, which is an 8% increase compared to the market price. Therefore, Sainsbury's current market valuation is considered reasonable, and a “hold” recommendation is advised.
References
Cite this article
Li,Y. (2025). Strategic Financial Analysis and Valuation of Sainsbury’s PLC—Based on 2023 Annual Report Data. Advances in Economics, Management and Political Sciences,191,101-111.
Data availability
The datasets used and/or analyzed during the current study will be available from the authors upon reasonable request.
Disclaimer/Publisher's Note
The statements, opinions and data contained in all publications are solely those of the individual author(s) and contributor(s) and not of EWA Publishing and/or the editor(s). EWA Publishing and/or the editor(s) disclaim responsibility for any injury to people or property resulting from any ideas, methods, instructions or products referred to in the content.
About volume
Volume title: Proceedings of ICEMGD 2025 Symposium: The 4th International Conference on Applied Economics and Policy Studies
© 2024 by the author(s). Licensee EWA Publishing, Oxford, UK. This article is an open access article distributed under the terms and
conditions of the Creative Commons Attribution (CC BY) license. Authors who
publish this series agree to the following terms:
1. Authors retain copyright and grant the series right of first publication with the work simultaneously licensed under a Creative Commons
Attribution License that allows others to share the work with an acknowledgment of the work's authorship and initial publication in this
series.
2. Authors are able to enter into separate, additional contractual arrangements for the non-exclusive distribution of the series's published
version of the work (e.g., post it to an institutional repository or publish it in a book), with an acknowledgment of its initial
publication in this series.
3. Authors are permitted and encouraged to post their work online (e.g., in institutional repositories or on their website) prior to and
during the submission process, as it can lead to productive exchanges, as well as earlier and greater citation of published work (See
Open access policy for details).