


1. Introduction
Since the Basel Committee first issued "the Basel Accord" in 1988, credit risk has always been the top priority of commercial banks' risk management, and the new accord has combined it with market risk and operational risk as the three major risks faced by banks. In today's global economic integration, the importance of credit risk has become increasingly prominent. With the rise of emerging industries such as Internet Finance and big data, financial transactions become more and more frequent, and credit risk becomes more and more important. The bank's credit risk will lead to the loss of credit assets, erode the bank's capital, and then affect its financial status and profitability, which will have a serious negative impact on the financial system and the real economy.
The assessment of bank credit risk has a history of over a hundred years. Early methods were mainly based on expert analysis, which relied on the experience and subjective judgment of experts. In order to avoid the subjectivity and arbitrariness of experts’ methods, later scholars proposed statistical models based on corporate financial indicators, such as binary choice models and Z-score models [1]. However, these models heavily rely on historical financial data, and the quality and timeliness of financial data directly affect the judgment results of the models. Nowadays, existing research mainly follows two paths. One generates and expands sample data through smooth expansion theory to obtain large sample data, and use it as a basis to classify bank credit risk levels, thereby achieving credit risk assessment [2]. Another approach is through machine learning models, such as Ma Mengchen's discovery, used random forest models in credit risk evaluation of small and medium-sized companies [3]. Others built a credit risk assessment model based on logistics regression, which is widely used because of its practicality and objectivity [4]. Then tested the effectiveness of the model's prediction effect. Although some machine learning models such as random forest and logistics regression have improved prediction accuracy, but there are still problems such as poor model interpretability and imbalanced data when facing the massive financial data.
In view of the existing problems of lacking effective processing of classification features and data imbalance, this essay proposes a credit risk assessment model based on label encoding and XGBoost. The rationality and effectiveness of the model are verified by the test of a data set. Firstly, the model separates and classifies the numerical features, and labels the classification variables after the numerical features are standardized; Secondly, in order to improve the accuracy and generalization ability of the model, SMOTEENN [5]. Sampling method is adopted to balance the data. Finally, XGBoost is adopted to assess the level of credit risk.
The main work of this article is as follows:
(1)In order to improve the prediction performance of the model for credit risk users and solve the problem of data imbalance, this essay uses SMOTEENN sampling method to balance the data.
(2)XGBoost is designed to predict users with high and low credit risks, in order to improve the prediction ability.
Based on XGBoost model, this study innovatively added SMOTEENN method to build SM-XGBoost model. This model not only solves the problems of poor model interpretation and unbalanced data, but also further optimizes the credit risk assessment.
2. Experimental
2.1. Experimental data processing
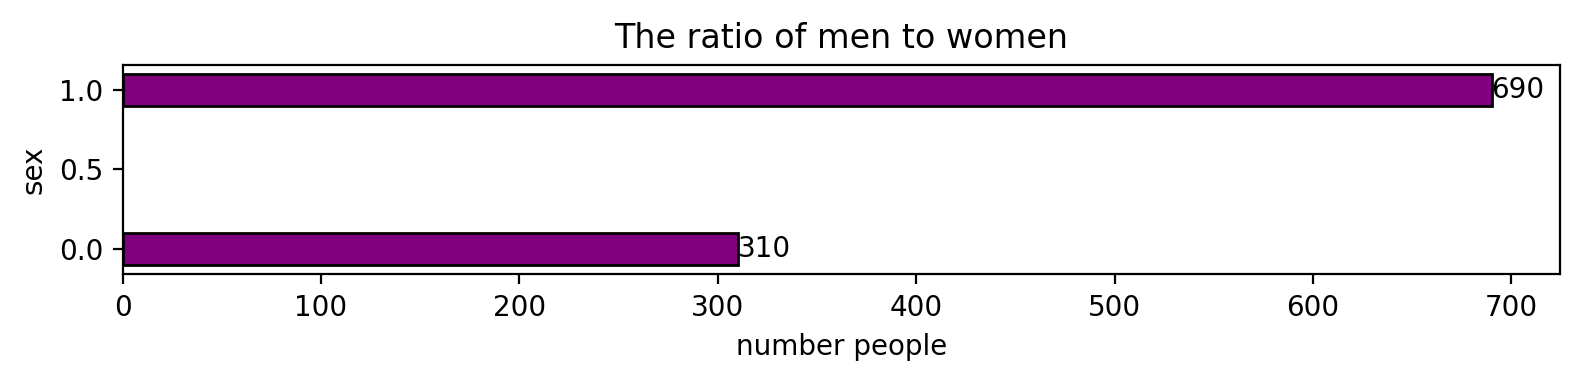
This experiment used the German credit risk dataset. Table 1 summarizes the basic situation and characteristics of the data set. German credit risk is a dataset from UCI, with a total of 1000 samples, including 5 numerical data, 4 category data, and 20 variables, covering data such as account balance, credit account, integral finance, and duration. The goal of the experiment is to accurately identify high and low credit risk users. In this task, the proportion of male users accounts for 69% of the total number of users, so the dataset belongs to unbalanced dataset (see Table 1).
|
Data set |
Number of samples |
Value type |
Male users |
|
|
Numerical type |
Category type |
|||
|
UCI |
1000 |
5 |
4 |
69% |
Data preprocessing mainly includes: processing missing values, separating numerical features and classification features, data standardization, standardized processing, and classification variables. First, when processing missing values, fill the missing items in the category feature with "unknown". Then, the numerical features and classification features are differentiated, and the classification features are independently coded and standardized in order to reduce the impact on their weights. Finally, the credit amount is converted into a classification variable, and is divided into two categories of high and low credit users based on the median. The dataset is divided into two parts, and the proportion of the training set: the test set is 7:3, and the random state is set to a fixed value of 43, this can ensure the certainty of the results.
2.2. Data preprocessing analysis
Firstly, carrying out pearson correlation analysis according to the data characteristics, and it is clearly displayed by means of thermal map. The following will be analyzed from several typical situations.
(1) Credit evaluation is highly related to the loan amount (see Figure 1).
The essence of credit assessment is the quantitative assessment of financial institutions to borrower's default risk. High credit scores (such as timely repayment records and low credit card utilization rate) indicate that the borrower has a low probability of default. Banks can expand credit supply by reducing the risk premium (i.e. loan interest rate). At the same time, borrowers with high credit scores usually have a stable source of income and debt management ability, which further enhances the repayment guarantee. This risk pricing mechanism under asymmetric information makes credit score become the core variable to determine the credit limit.
(2) Credit evaluation is weakly correlated with loan maturity.
The extension of the loan term will increase the uncertainty faced by banks (such as interest rate fluctuations, changes of borrowers' income). Although high credit scores reduce the risk of default, banks still need to control liquidity risk by reducing maturities. For example, short-term loans can dynamically assess risk through frequent renewal, while long-term loans require higher risk compensation.
(3) Job stability is related to low loan amounts.
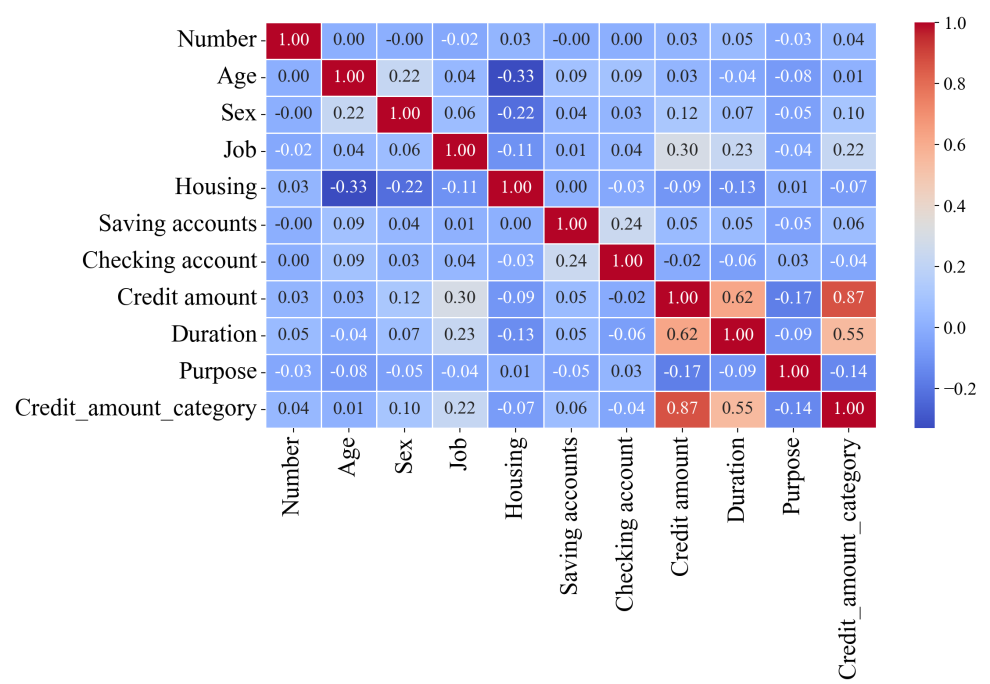
Although Job stability is an important indicator of traditional loan approval, but its impact is diluted by other factors. According to the modern credit model, the influence weight of asset proof (such as real estate, deposits) and debt ratio (debt/income) on quota has exceeded that of occupation.
Next, the data of high and low credit risk components under different working conditions and different loan maturities are displayed and analyzed.
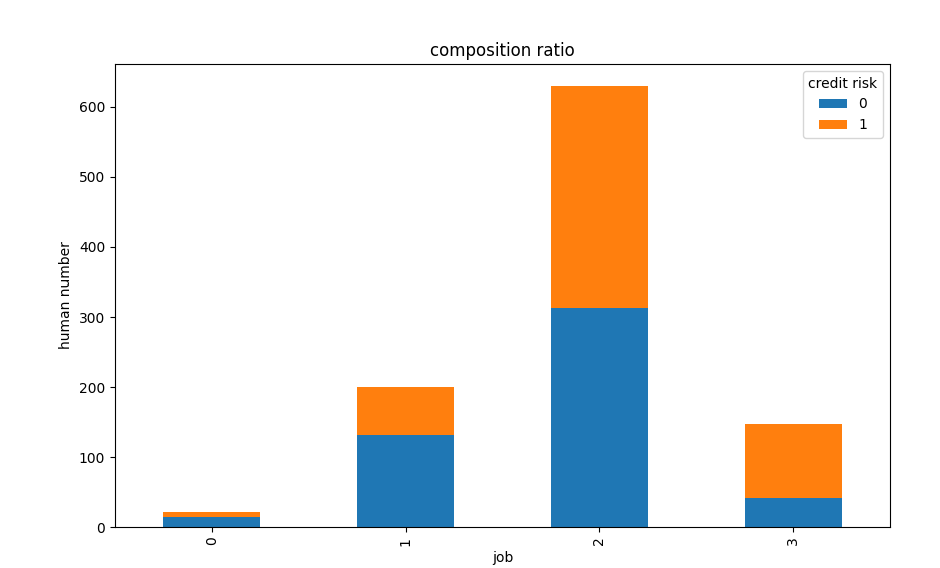
(1) Proportion of high and low credit risk under different working conditions
The number of highly skilled high is closed to low credit users. The credit of highly skilled users is also high, compared to unskilled and residential work, the number of low credit risk is significantly higher than that of high risk.
Highly skilled work population: highly skilled work usually requires employees to have professional knowledge and skills, and they can be competent only after long-term learning and practice accumulation. This part of the population may be relatively good in income level and stability, and have a certain economic foundation to deal with all kinds of financial affairs. However, even highly skilled workers may lead to differences in credit status due to personal consumption concepts, major emergencies and other factors.
Highly skilled users: highly skilled users often have unique capabilities and advantages in their professional fields, and can obtain higher income and better career prospects. They often have a more stable source of income and a clearer ability to plan and manage their finances. Good economic foundation and strong financial management awareness make them more able to repay on time and in full in credit activities, thus accumulating a better credit record and a higher credit level.
Unskilled and residential work: the work is relatively unstable, prone to default, not on the loan quota, so the number of low credit is far greater than the number of high credit.
(2) Proportion of high and low credit risk under different loan maturities
As can be seen from the Figure 2, the low credit of users with a loan period of less than 20 years accounts for a large proportion .The high credit of users with a loan period of more than 20 years accounts for the majority (see Figure 2).
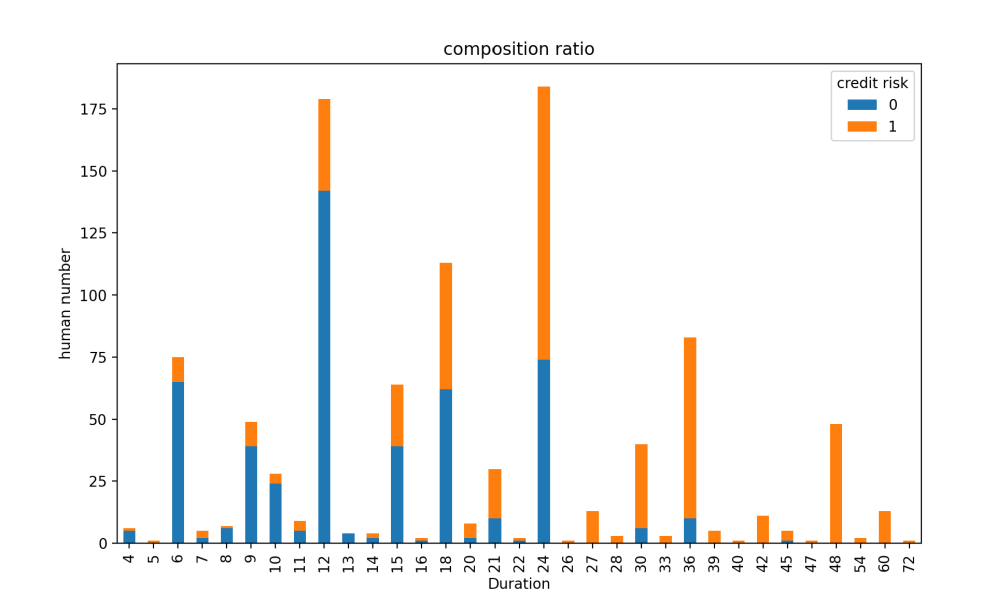
The long loan term means that the repayment pressure is relatively dispersed for a long time, and the monthly repayment amount is low. Financial institutions are more willing to issue long-term loans to high credit users, because they usually have a stable source of income and strong repayment ability. They can afford long-term debt liability and have a greater possibility of repaying loans in full and on time.
3. Basis for modeling
(1)Tree model: the tree model has better adaptability to tasks with irregular distribution.
(2)Handling multiple data types: In the data set, there are five numerical data and four sub type data. XGBoost can deal with numerical features directly.For the classified features, they can also be well incorporated into the model after simple coding (such as single hot coding, label coding) (see Figure 3).
(3)Dealing with complex relationships: the thermal map shows that there are complex correlations between high and low credit and loan amount and term. XGBoost can deal with non-linear relationships, capture these complex correlations, and improve the accuracy of credit risk assessment.
3.1. Model building
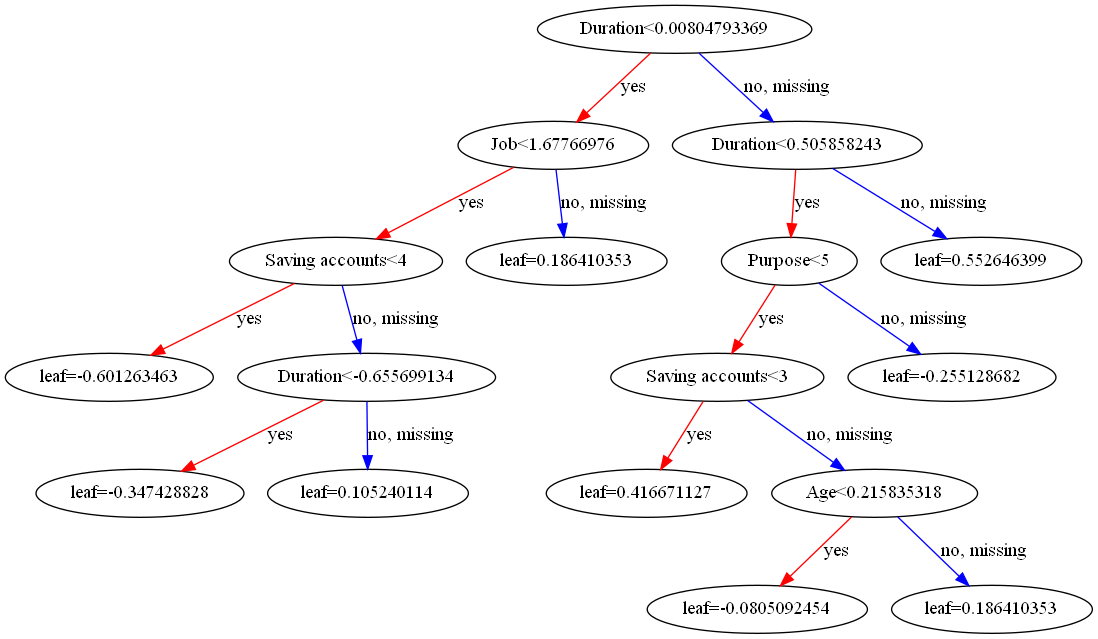
This decision tree makes threshold judgment on multiple features such as "duration", "job" and "saving accounts", gradually subdivides the data, and finally gives the corresponding prediction results (see Figure 4)
3.2. Model comparison
Linear regression: It is simple, efficient and highly interpretable, It can clearly show the relationship between characteristics and target variables. By introducing a decision rule (usually a probability threshold, such as 0.5), it converts the predicted probability into one of two categories, so that it can be directly applied to binary classification problems. This way makes logical regression not only provide probability information about classification, but also directly give classification decisions, which is very suitable for dealing with binary classification problems.
XGBoos has the characteristics of high efficiency, flexibility and portability [6]. In addition, under the gradient lifting framework, it has high computational efficiency, can process large-scale data and has good scalability and robustness. Neural network models is inspired by the structure of human brain. It processes complex data patterns in a highly flexible way by simulating the organizational structure of human brain nervous system, which has the characteristics of high efficiency, flexibility and portability. In addition, under the gradient lifting framework, it has high computational efficiency, can process large-scale data, and has good scalability and robustness.
4. Model evaluation
4.1. German credit risk data set confusion matrix
(1)The real label is 0 (low credit): When the model identifies samples with real labels of 0, 131 judgments are correct. The model misidentified 19 samples with real labels of 0 as 1.
(2)True label 1 (high credit): Fifty three samples with a real label of 1 were misjudged by the model to be 0. The model correctly identified 97 samples with a real label of 1 (see Figure 5).
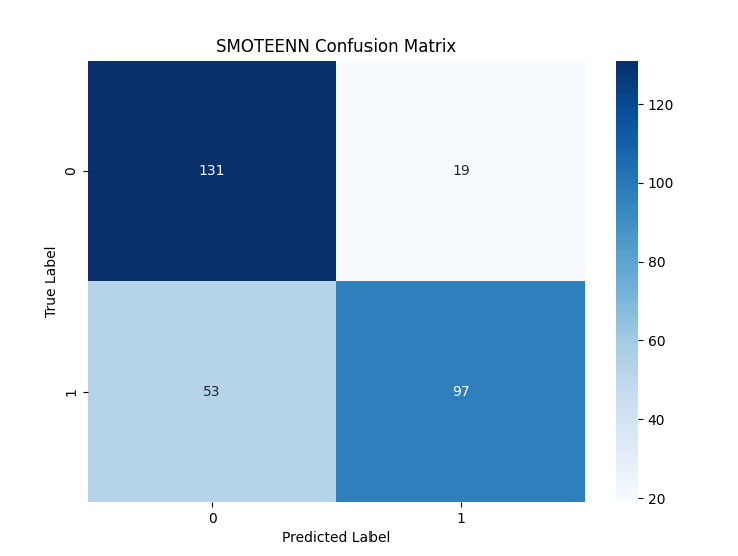
Summary: there are a certain number of misjudgments (more false negative cases) when identifying samples with a real label of 1.
4.2. Evaluating indicator
This experiment uses five commonly indicators for binary classification problems: precision, recall, f1-score, accuracy and AUC. The reason for the evaluation based on these five comprehensive indicators is that it can comprehensively measure the performance of the credit risk assessment model from different angles, including the prediction accuracy of positive and negative cases, the overall classification effect of the model and the ability to distinguish different risk levels, so as to provide a multi-dimensional basis for the accurate evaluation of credit risk.
4.3. AUC
AUC (area under the curve) is the core indicator to evaluate the performance of the binary classification model, which is used to measure the ability of the model to rank positive samples higher than negative samples [7]. Its value ranges from 0 to 1. The higher the value, the stronger the model's ability to distinguish positive and negative samples. It is mainly composed of two indicators: TPR (true positive rate) and FPR (false positive rate). The calculation formulas of the two indicators are as follows.
Criteria for judging the merits of classifiers (prediction models) from AUC:
AUC = 1.It's the perfect sorter.
AUC = [0.85, 0.95]. It worked well.
AUC = [0.7, 0.85].Average effect.
AUC = [0.5, 0.7].The effect is low, but it is already good for predicting stocks.
AUC = 0.5.With random speculation (example: Lost copper), the model has no predictive value.
AUC < 0.5.Worse than random speculation. But as long as you always do the opposite, it's better than random speculation.
4.4. Precision
Precision is a measure of the accuracy of classifiers or predictors in machine learning (ML) [8]. It is defined as the ratio of the number of true positive predictions made by the classifiers to the total number of positive predictions made by the classifiers. In other words, what's really right is the proportion of positive predictions.
Precision is a key parameter in machine learning because it quantifies the ability of the classifiers to identify successful samples. It is sometimes combined with another statistic called recall, which is defined as the ratio of true positive predictions to all cases that are actually positive. The formula is:
4.5. Recall
Recall, also known as recall rate or sensitivity, is one of the evaluation indicators of classification model, which is mainly used to evaluate the coverage of the model to positive cases [9]. Recall rates focus on the proportion accurately identified in all category 1 samples. Its basic meaning is the proportion of samples that are actually positive examples, and the model predicts that they are positive examples. Calculated by the following formula:
Among them, the real case (TP) refers to the number of samples correctly predicted by the model as positive cases, and the false negative case (FN) refers to the number of samples incorrectly predicted by the model as negative cases.
4.6. F1-score
F1-score uses the reconciled average of recall and accuracy as an indicator of model evaluation.
F1-score is a calculation result between [0,1]. When FP+FN=0 (When there is no misjudgment of samples), the calculation result of f1-score is 1; When 1 is not correctly identified, when TP=0, F1-Score=0.
4.7. Accuracy
Accuracy is a basic indicator to evaluate the performance of classification models [10]. Its basic meaning is that the model predicts the proportion of the correct number of samples to the total number of samples. It represents the probability that the model will make the correct prediction. Calculated by the following formula:
4.8. Evaluating indicator
|
Model |
German Credit Risk |
||||
|
AUC |
precision |
recall |
f1-score |
accuracy |
|
|
Decision tree |
0.7367 |
0.7487 |
0.7367 |
0.7334 |
0.7367 |
|
Random forest |
0.8084 |
0.7514 |
0.7400 |
0.7370 |
0.7400 |
|
XGBoost |
0.8112 |
0.7741 |
0.7600 |
0.7569 |
0.7600 |
|
GBDT |
0.7947 |
0.7565 |
0.7400 |
0.7358 |
0.7400 |
|
Logistic |
0.8085 |
0.7639 |
0.7533 |
0.7508 |
0.7533 |
|
DNN |
0.7956 |
0.7565 |
0.7400 |
0.7358 |
0.7433 |
After comparing five performance indicators of six models, it can be found that random forest, XGBoost and logistic regression models have better performance, and XGBoost performs best. It is much higher than other model indicators in precision, f1-score and other four indicators (see Table 2).
4.9. Ablative experiment
In order to verify the effectiveness of each module in the SM-XGBoost model, this experiment uses ablation experiment, and the evaluation indicators include AUC, precision, recall, f1-score and accuracy. The results of different factors are assumed as follows:
1)SM-XGBoost1: Use label coding, SMOTEENN sampling method is used for data balancing, and XGBoost is used to evaluate performance.
2)SM-XGBoost2: a new coding method, single hot coding, is adopted, and SMOTEENN sampling method is also used for counting
3)SM-XGBoost3: Adopt the coding method , but the data balancing operation is not carried out, and the XGBoost model is evaluated directly.
4)SM-XGBoost4: Adopt the single hot coding method, and the data balancing operation is also not carried out.
The results of the ablation experiment are shown in Table 3.
According to the experiment, using label coding and SMOTEENN data sampling respectively will improve the performance, but when both are adopted, the performance results show the highest. It shows that these two methods are necessary to process the data set.
|
Model |
Label |
Single-hot |
SMOTEENN |
German Credit Risk |
||||
|
AUC |
precision |
recall |
f1-score |
accuracy |
||||
|
LM-XGBoost1 |
√ |
× |
√ |
0.8112 |
0.7741 |
0.7600 |
0.7569 |
0.7600 |
|
LM-XGBoost2 |
× |
√ |
√ |
0.8069 |
0.7677 |
0.7467 |
0.7416 |
0.7467 |
|
LM-XDBoost3 |
√ |
× |
× |
0.7712 |
0.6938 |
0.6900 |
0.6885 |
0.6900 |
|
LM-XGBoost4 |
× |
√ |
× |
0.7656 |
0.7018 |
0.7000 |
0.6993 |
0.7000 |
5. Conclusion , limitation and expectation
5.1. Conclusion
In this study, the SM-XGBoost model is designed based on data characteristics, and compared with five other traditional machine learning models (decision tree, random forest, neural network, logistics regression, gradient lifting). The results show that the performance of the SM-XGBoost model is higher than that of the other five indicators, AUC, precision, recall, f1-score and accuracy.
In addition, the model was ablated in two aspects: label coding or exclusive coding and whether to use data balance. From the experimental results, it can be seen that when label coding and SMOTEENN data balance method’s (SM-XGBoost model’s) index and performance are the best. It is proved that the SM-XGBoost model can solve the problems of poor interpretation and unbalanced data distribution in the old model. The model is more suitable for credit risk assessment.
5.2. Limitation
SM-XGBoost model is integrated with other learning models to make comprehensive use of the advantages of different models and improve the generalization ability of models. SM-XGBoost can be combined with bagging algorithms such as random forest to train different subsets of models in parallel, and finally predict the results by voting or averaging.
The sample size of the data set is not large enough, and a larger sample size can be evaluated later. The currently used data sets have some limitations in sample size, which may have many adverse effects on the training and evaluation of models. On the one hand, a small sample size is difficult to fully cover all kinds of credit risk related characteristics, resulting in insufficient richness and completeness of the feature models learned by the model, and the accuracy and stability of prediction will be greatly reduced in face of complex and changeable actual credit scenarios.
5.3. Expectation
To address this issue, it is necessary to conduct larger sample size evaluation work in the future. By collecting more credit data, covering a wider range of credit subjects, richer credit behaviors, and longer time span credit records, it can provide more abundant learning materials for the model. This not only helps the model to mine more universal and in-depth credit risk feature patterns, enhance adaptability to different credit scenarios, and improve prediction accuracy. Under the training of a large number of samples, the model can better balance bias and variance, effectively avoid overfitting and improve its reliability and practicality in practical credit risk assessment tasks.
References
[1]. Wang P., Li K.P., Su L., (2025) Can dimension reduction help deep neural networks better learn credit risk—— Research Based on factor enhanced interpretable learning model. China management science,4, 1-15. https://doi.org/10.16381/j.cnki.issn1003-207x.2024.1256.
[2]. Du Y.Q., (2021) Shi Baofeng Credit risk rating model and demonstration of commercial banks based on smooth expansion principle [J]. Operations research and management, 28 (06), 159-165
[3]. Ma M.C., (2023) Research on credit risk assessment of SMEs based on random forest method. SEZ economy, 01,141-144
[4]. Zeng X., (2024) Credit risk assessment of listed companies based on improved k-means clustering algorithm [J]. Journal of science, 44 (11), 20-25
[5]. Tian Y., Guo H.L., Ji Q., (2024) Credit card risk customer forecast based on SMOTEENN XGBoost. Software guide, 23 (07), 138-143
[6]. Meng X.J., Chen J.D., Zhang J., (2024) Research on credit risk prediction of small and medium-sized enterprises integrating unstructured text information [J]. Systems science and mathematics, 44 (06), 1608-1629
[7]. Niu X.J., Ling F., (2023) Research on personal credit risk assessment model based on portfolio learning. Fudan Journal (NATURAL SCIENCE EDITION), 60 (06), 703-719. Doi: 10.15943/j.cnki. Fdxb-jns.2021.06.003
[8]. Jia Y., Zhao F., Li B., et al., (2023) Bayes optimized XGBoost credit risk assessment model [J]. Computer engineering and applications, 59 (20), 283-294
[9]. Lu Z., Zhang J., (2022) Credit risk prediction of listed companies based on smotetomek rfe-mlp algorithm [J]. Systems science and mathematics, 42 (10), 2712-2726
[10]. Chi G.T., Wang S.S.,(2024) Default risk prediction model of Listed Companies in China based on XGBoost [J]. Journal of system management, 33 (03): 735-754
Cite this article
Zong,Z. (2025). Credit Risk Assessment Model Based on XGBoost. Advances in Economics, Management and Political Sciences,193,171-180.
Data availability
The datasets used and/or analyzed during the current study will be available from the authors upon reasonable request.
Disclaimer/Publisher's Note
The statements, opinions and data contained in all publications are solely those of the individual author(s) and contributor(s) and not of EWA Publishing and/or the editor(s). EWA Publishing and/or the editor(s) disclaim responsibility for any injury to people or property resulting from any ideas, methods, instructions or products referred to in the content.
About volume
Volume title: Proceedings of ICEMGD 2025 Symposium: Innovating in Management and Economic Development
© 2024 by the author(s). Licensee EWA Publishing, Oxford, UK. This article is an open access article distributed under the terms and
conditions of the Creative Commons Attribution (CC BY) license. Authors who
publish this series agree to the following terms:
1. Authors retain copyright and grant the series right of first publication with the work simultaneously licensed under a Creative Commons
Attribution License that allows others to share the work with an acknowledgment of the work's authorship and initial publication in this
series.
2. Authors are able to enter into separate, additional contractual arrangements for the non-exclusive distribution of the series's published
version of the work (e.g., post it to an institutional repository or publish it in a book), with an acknowledgment of its initial
publication in this series.
3. Authors are permitted and encouraged to post their work online (e.g., in institutional repositories or on their website) prior to and
during the submission process, as it can lead to productive exchanges, as well as earlier and greater citation of published work (See
Open access policy for details).
References
[1]. Wang P., Li K.P., Su L., (2025) Can dimension reduction help deep neural networks better learn credit risk—— Research Based on factor enhanced interpretable learning model. China management science,4, 1-15. https://doi.org/10.16381/j.cnki.issn1003-207x.2024.1256.
[2]. Du Y.Q., (2021) Shi Baofeng Credit risk rating model and demonstration of commercial banks based on smooth expansion principle [J]. Operations research and management, 28 (06), 159-165
[3]. Ma M.C., (2023) Research on credit risk assessment of SMEs based on random forest method. SEZ economy, 01,141-144
[4]. Zeng X., (2024) Credit risk assessment of listed companies based on improved k-means clustering algorithm [J]. Journal of science, 44 (11), 20-25
[5]. Tian Y., Guo H.L., Ji Q., (2024) Credit card risk customer forecast based on SMOTEENN XGBoost. Software guide, 23 (07), 138-143
[6]. Meng X.J., Chen J.D., Zhang J., (2024) Research on credit risk prediction of small and medium-sized enterprises integrating unstructured text information [J]. Systems science and mathematics, 44 (06), 1608-1629
[7]. Niu X.J., Ling F., (2023) Research on personal credit risk assessment model based on portfolio learning. Fudan Journal (NATURAL SCIENCE EDITION), 60 (06), 703-719. Doi: 10.15943/j.cnki. Fdxb-jns.2021.06.003
[8]. Jia Y., Zhao F., Li B., et al., (2023) Bayes optimized XGBoost credit risk assessment model [J]. Computer engineering and applications, 59 (20), 283-294
[9]. Lu Z., Zhang J., (2022) Credit risk prediction of listed companies based on smotetomek rfe-mlp algorithm [J]. Systems science and mathematics, 42 (10), 2712-2726
[10]. Chi G.T., Wang S.S.,(2024) Default risk prediction model of Listed Companies in China based on XGBoost [J]. Journal of system management, 33 (03): 735-754