


1. Introduction
Since the conflict between Russia and Ukraine broke out, it has attracted worldwide attention, especially having a great impact on the global oil and gas market. As a major oil and gas producer in the world, Russia's energy exports occupy an important position in the international market [1]. The intensification of conflicts has led to Western countries imposing sanctions on Russia [2], which directly affects Russia's oil and gas exports, resulting in severe fluctuations in global oil and gas prices. Some companies are forced to adjust their investment plans and market strategies to cope with rising costs and market uncertainty [3]. Due to economic sanctions imposed by European and American countries on Russia and the resulting supply chain instability, many countries are facing energy supply shortages [1]. This series of problems and chain effects have further affected oil and gas prices, and this price volatility indirectly or directly affects the business strategies of oil and gas companies. This study designed to explore and analyze the specific effects of energy changes, price fluctuations and other factors on the oil and gas market in the Russia-Ukraine conflict through event analysis and data analysis.
2. Literature review
Some literature points out that the COVID-19 before the outbreak of the Russia-Ukraine conflict will also cause changes in energy prices [4]. As a result of the rapid spread of COVID-19 globally, it has brought enormous physical fitness, economic, environmental, and social challenges to all humanity. Almost all countries are working to slow down the spread of the disease through measures including but not limited to restricting large-scale gatherings and maintaining complete or partial lockdowns. In addition, literature also indicates that with the outbreak of COVID-19 withhold in early 2020, both Brent crude oil prices and transfer of property (TTF) prices have correspondingly decreased [5].
The impact of different events on different oil and gas companies will also vary. Compared to the pandemic, Brent crude oil suffered greater losses during the Russia Ukraine war, while natural gas did not. However, WTI suffered the same losses during both crises. During epidemics and wars, the connections between markets have strengthened [6]. The evidence available so far shows that the COVID-19 was the main cause for the decline of oil prices before the outbreak of the Russia-Ukraine conflict [4].
As the global pandemic gradually stabilizes, the world economy gradually recovers, people's travel increases, and the total demand for oil rises [7]. Russia provides 10% -25% of the world's oil, gasoline and coal products to different countries, especially European countries, which makes world oil prices soar, and the supply in the region is unstable due to the Russia-Ukraine conflict [1]. With the implementation of sanctions against Russia by European and American countries, companies such as BP, Shell, and ExxonMobil have successively announced their withdrawal from energy cooperation with Russia, increasing the possibility of unstable oil supply in the energy market and further leading to high oil prices [8].
Zhao et al. analyzed the financial impact of the Russia-Ukraine War on ExxonMobil. The study emphasized the sharp fluctuations in stock prices and market valuations, and attributed them to geopolitical instability caused by the conflict. There are also articles discussing the role of ExxonMobil in global energy security during the Russia-Ukraine conflict. It emphasizes the importance of ExxonMobil maintaining stable energy supply amidst disruptions caused by conflicts. Nerlinger and Utz investigated the strategic and operational adjustments made by BP in response to conflicts. They found that BP must make significant changes in supply chain management and risk mitigation strategies to address the challenges posed by ongoing warfare. The Russia-Ukraine conflict has a long-term impact on BP's oil investment strategy. Therefore, BP adjusted its risk management and capital allocation according to the aggravation of geopolitical risks. In addition, literature has assessed the supply chain elasticity of ExxonMobil and BP in the Russia-Ukraine conflict, which identified the key loopholes and strategies adopted by the two companies to improve supply chain stability in response to the conflict. As the dollar devaluation led to the rise of the price of oil per barrel, OPEC decided to boost production, leading to the decline of the price of oil per barrel. On the other hand, the production of non-OPEC countries has decreased, resulting in price increases. If OPEC does not increase production to make up for the shortage of Russian oil in the international market, oil prices will rise significantly [9]. There is literature showing that Schmidbaur and Rösch used a simple regression model and GARCH model, introducing a series of dummy variables representing OPEC meetings to distinguish those meetings that announced increased production quotas, cuts, or no changes [10].
According to the WTI crude oil price, the difference model shows that the price level of three unstable assets has been positively affected within a few days after the outbreak of the Russia-Ukraine war. The validity of the differential model is verified by parallel trend test [11].
3. Design
The primary date used in this analysis have three main sources: statistics, The Energy Information Administration (EIA), X-RATES and Trading Economics. We have an annual sample covering the period from 2012 to 2024. Figure 1 provides a detailed description of the initial variables considered and the main factors affecting oil price changes in each time period. Table 2 provides a simple analysis of the data in Figure 1, which includes the maximum, minimum, median, average, and variance of OPEC, Brent, and WTI crude oil prices from 2012 to 2024. Other variables initially considered but not selected as input variables include OPEC production, world crude oil demand, OPEC supply, and weekly average prices of OPEC, Brent, and WTI crude oil.
The EIA Spot Prices for Crude Oil and Petroleum Products and Statistic reported the monthly average price of crude oil, and X-RATES reported the rate of conversion of one Chinese yuan to one US dollar. During the sample period from January 2023 to August 2024, we obtained the monthly average prices of OPEC, Brent, and WTI crude oil and the average exchange rate of RMB to USD. We conducted regression analysis using USD exchange rate as the variable and oil price as the dependent variable, as shown in Table 1.
|
Exchange rate of dollar |
OPEC's oil price(USD) |
Brent's oil price(USD) |
WTI's oil price(USD) |
Period of time |
|
6.7967 |
81.62 |
82.50 |
78.12 |
Jan-23 |
|
6.8357 |
81.88 |
82.59 |
76.83 |
Feb-23 |
|
6.8945 |
78.45 |
78.43 |
73.28 |
Mar-23 |
|
6.8833 |
84.13 |
84.64 |
79.45 |
Apr-23 |
|
6.9803 |
75.82 |
75.47 |
71.58 |
45047 |
|
7.1492 |
75.19 |
74.84 |
70.25 |
45078 |
|
7.1921 |
81.06 |
80.11 |
76.07 |
Jul-23 |
|
7.2328 |
87.33 |
86.15 |
81.39 |
Aug-23 |
|
7.2800 |
94.6 |
93.72 |
89.43 |
Sep-23 |
|
7.2755 |
91.78 |
90.6 |
85.64 |
Oct-23 |
|
7.2169 |
84.92 |
82.94 |
77.69 |
Nov-23 |
|
7.1259 |
79.00 |
77.63 |
71.90 |
Dec-23 |
|
7.1327 |
80.04 |
80.12 |
74.15 |
Jan-24 |
|
7.1860 |
81.23 |
83.48 |
77.25 |
Feb-24 |
|
7.2018 |
84.22 |
89.94 |
81.28 |
Mar-24 |
|
7.2369 |
89.12 |
85.41 |
85.35 |
Apr-24 |
|
7.2327 |
83.59 |
89.94 |
81.28 |
May-24 |
|
7.2534 |
83.22 |
81.75 |
85.35 |
Jun-24 |
|
7.2625 |
84.43 |
82.25 |
79.77 |
Jul-24 |
|
7.1515 |
78.41 |
85.15 |
81.80 |
Aug-24 |
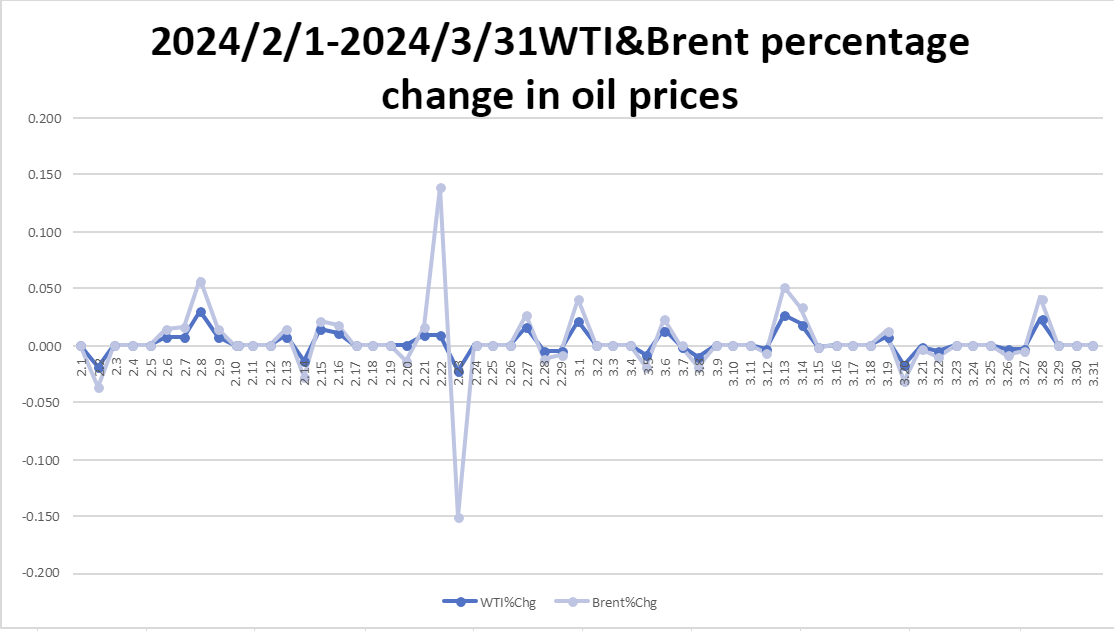
Trading Economics we used Formula 1 to process the daily real-time updated crude oil prices (excluding non-trading days) and calculated the annual average growth percentage of oil prices from 2012 to 2024 and the daily average growth percentage of oil prices from February 1 to March 31, 2022 to 2024, as shown in Figure 4, 5, 6, 7.
4. Results
According to the broken line chart in Figure 1, the imbalance between oil supply and demand in 2014 and the COVID-19 in 2019 were the time points of the Russia-Ukraine war and the main reasons and events that affected oil prices before the war [4,12]. Under the context of the Russia-Ukraine conflict, geopolitical tensions continue, global oil supply is unstable, raising the risk premium of oil futures, traders expect the supply shortage of the oil market to increase, making short-term oil prices rise. In addition, the Russia-Ukraine conflict further exacerbated global inflation [13].
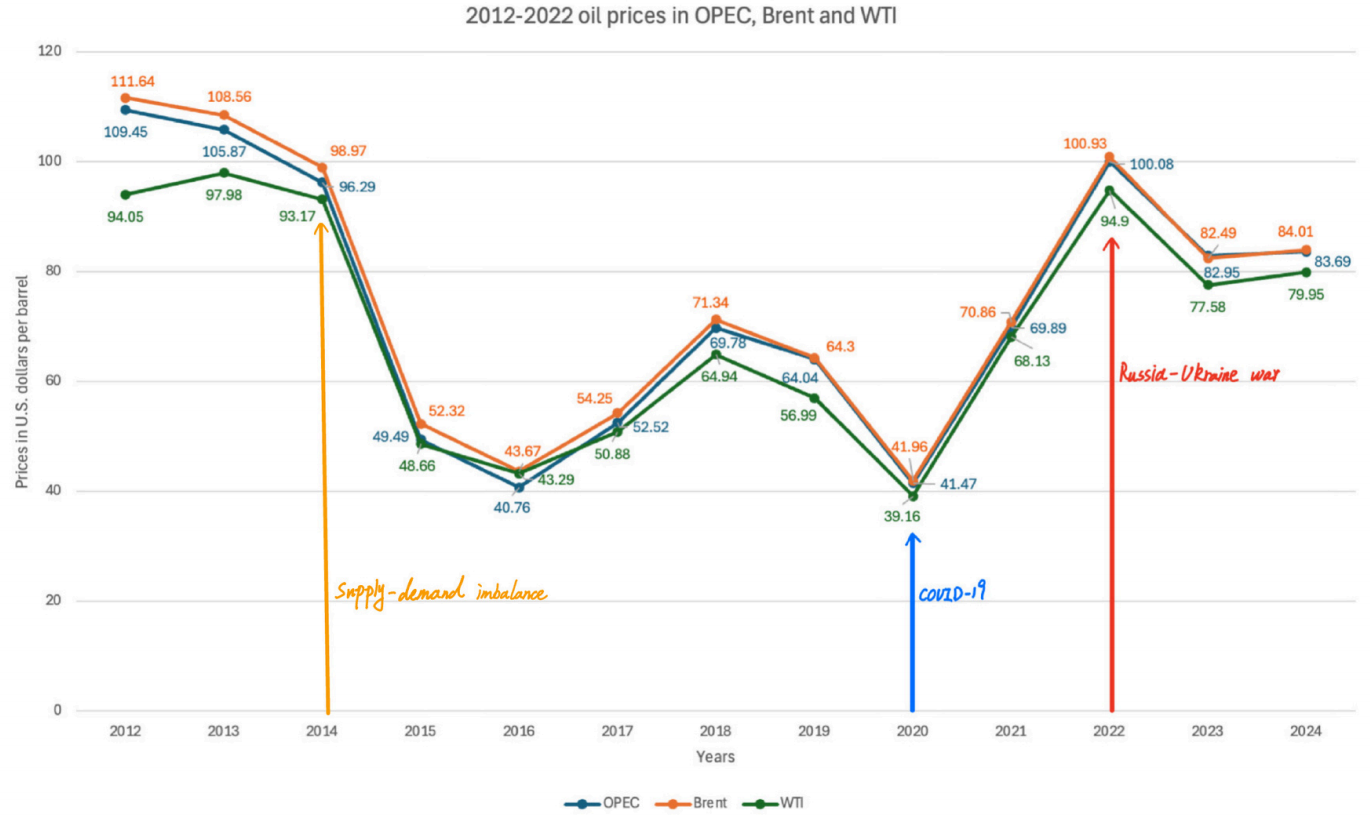
Based on the data in Figure 1, we've sorted out some key data points (in Table 2). According to the variances of OPEC, Brent, and WTI, it can be seen that WTI's oil price changes are relatively stable, but the differences are not significant.
|
OPEC |
Brent |
WTI |
|
|
Max |
109.45 |
111.64 |
97.98 |
|
Min |
40.76 |
41.96 |
39.16 |
|
Median |
69.89 |
71.34 |
68.13 |
|
Average |
74.32923077 |
75.79230769 |
69.97538462 |
|
Standard deviation |
23.17347703 |
23.21801196 |
20.30243093 |
According to Figure 2, in recent years, the volatility of oil prices has significantly increased, reflecting the complexity and uncertainty of the global energy market. From 2012 to 2024, oil prices experienced multiple significant increases and decreases, which not only had a profound affect consumers and businesses, but also on the global economy.
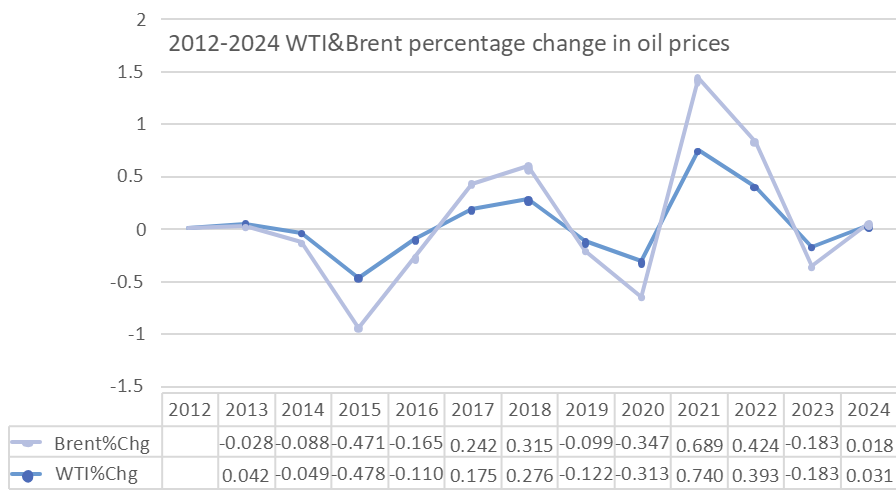
Figure 3 shows that prior to the outbreak of the Russo Ukrainian War, regional tensions may have already had an affect oil price. As Russia is an exporting country, the stability of its supply directly affects the global market's oil price trend [14]. Therefore, there were slight fluctuations in oil prices before the conflict. Since the conflict of the Russia-Ukraine on February 24, 2022, oil prices have experienced significant fluctuations. The geopolitical problems caused by the Russia-Ukraine conflict have led Europe and the United States to impose sanctions on Russia. The EU announced that it would implement an oil embargo on Russia, which would affect Russia's oil export capacity [2].
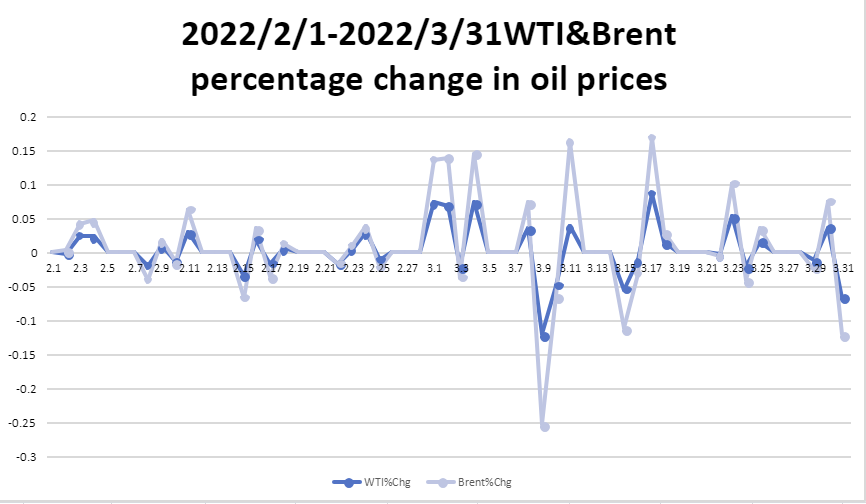
Figure 4 shows that the production of crude oil has decreased, Russia's export capacity has been further restricted, the Federal Reserve's interest rate hike has slowed down, and the US dollar exchange rate has dropped significantly, which has boosted confidence in the US dollar denominated crude oil futures market and pushed up oil prices [15]. Finally, the possibility of a global economic recession has increased, economic pressure is high, and market expectations for oil have decreased, leading to a short-term drop in oil prices.
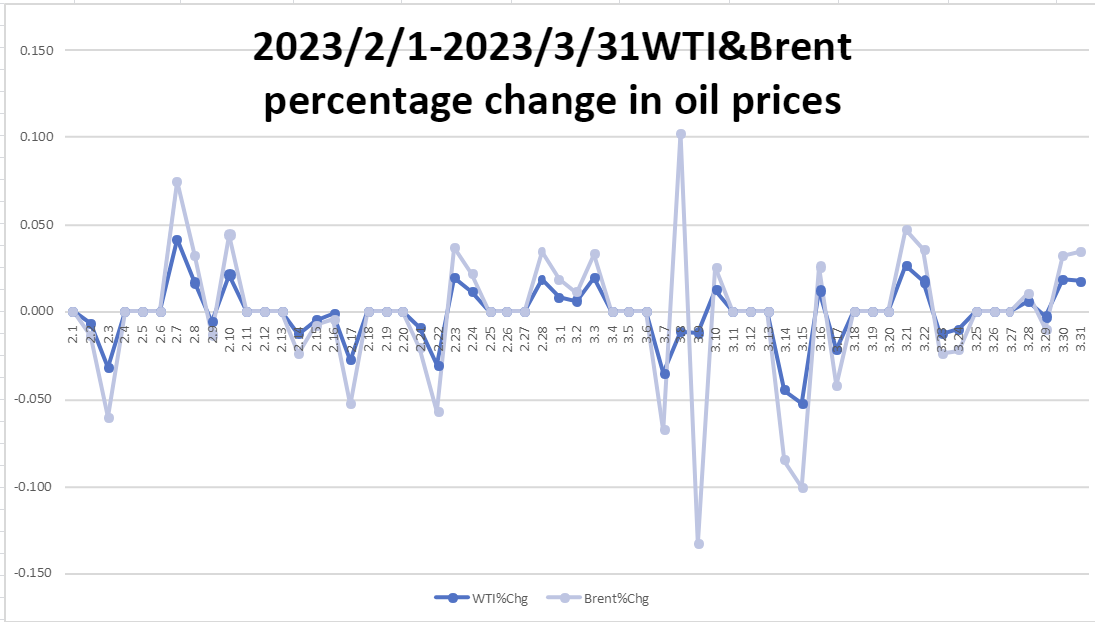
Figure 5 shows that if conflicts lead to long-term production and supply chain disruptions, oil prices will continue to rise. Conversely, if there are signs of conflict easing, oil prices may fall [16]. In 2024, with the global economic situation gradually becoming clear and the Russia-Ukraine conflict situation gradually easing, the impact on oil prices will weaken, which will help oil prices return to a relatively stable range.
According to Table 1, we conducted a regression analysis on the impact of the RMB to USD rate of conversion on oil prices (Figure 6 and Table 3, 4, 5). Through the data, we found that when the USD exchange rate rises, due to the reverse effect of purchasing power, the same amount of USD can buy more crude oil, which will reduce the demand for crude oil and thus lower the price of crude oil. That is to say, when the RMB depreciates against the USD, the cost of imported oil increases, leading to an increase in oil prices. So, the relationship between the US dollar rate of conversion and oil prices usually shows a negative correlation.
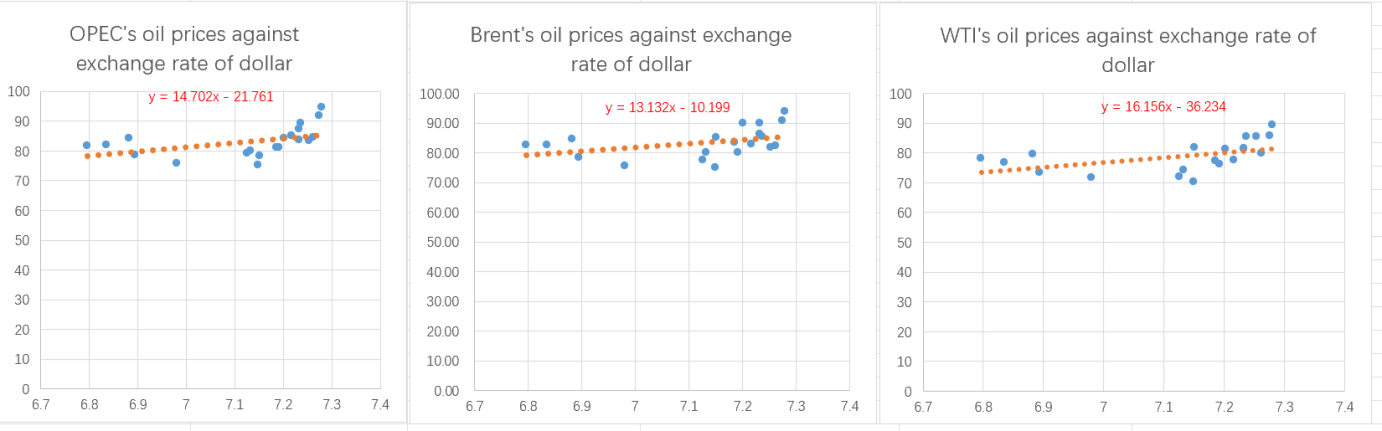
According to the regression analysis of OPEC (see Table 3), the P-value is close to zero, indicating that OPEC oil prices are related to the US dollar rate of conversion. From the confidence interval, it can be seen that considering errors, when the RMB rate of conversion against the US dollar decreases by 1%, OPEC oil prices will rise by about 0.8 US dollars.
|
OPEC |
|
|
Regression Statistics |
|
|
Multiple R |
0.464796002 |
|
R Square |
0.216035324 |
|
Adjusted R Square |
0.17248173 |
|
Standard Error |
4.504528758 |
|
Observed Value |
20 |
|
Variance Analysis |
df |
SS |
MS |
F |
Significance F |
|
Regression Analysis |
1 |
100.6466921 |
100.6466921 |
4.9602186 |
0.038938583 |
|
Residual |
18 |
365.2340279 |
20.2907793 |
||
|
Total |
19 |
465.88072 |
|
Coefficients |
Standard Error |
t Stat |
P-value |
Lower 95% |
Upper 95% |
|
|
Intercept |
-21.761290 |
47.049854 |
-0.462516 |
0.649254 |
-120.60936 |
77.086786 |
|
Exchange rate of dollar |
14.701515 |
6.601030 |
2.227155 |
0.038939 |
0.833266 |
28.569764 |
Table 4 shows that, taking into account errors, for every 1% decrease in the RMB to USD exchange rate, Brent oil prices will decrease by approximately $1.4.
|
Brent |
|
|
Regression Statistics |
|
|
Multiple R |
0.408378957 |
|
R Square |
0.166773372 |
|
Adjusted R Square |
0.120483004 |
|
Standard Error |
4.721330437 |
|
Observed Value |
20 |
|
Variance Analysis |
df |
SS |
MS |
F |
Significance F |
|
Regression Analysis |
1 |
80.3091203 |
80.3091203 |
3.602766162 |
0.0738388 |
|
Residual |
18 |
401.237310 |
22.2909611 |
||
|
Total |
19 |
481.54642 |
|
Coefficients |
Standard Error |
t Stat |
P-value |
Lower 95% |
Upper 95% |
|
|
Intercept |
-10.19888 |
49.314350 |
-0.206813 |
0.838477 |
-113.804494 |
93.406716 |
|
Exchange rate of dollar |
13.132420 |
6.918736 |
1.898095 |
0.073839 |
-1.403304 |
27.668144 |
According to the regression analysis of WTI (see Table 5), considering errors, when the exchange rate of RMB against USD decreases by 1%, WTI oil prices will increase by approximately $1.7. Compared to OPEC and Brent, WTI is more affected by the exchange rate of the Chinese yuan against the US dollar.
(a)WTI’s regression statistics
|
WTI |
|
|
Regression Statistics |
|
|
Multiple R |
0.485736861 |
|
R Square |
0.235940298 |
|
Adjusted R Square |
0.193492537 |
|
Standard Error |
4.676219034 |
|
Observed Value |
20 |
|
Variance Analysis |
df |
SS |
MS |
F |
Significance F |
|
Regression Analysis |
1 |
121.5449798 |
121.5449798 |
5.558368493 |
0.029912028 |
|
Residual |
18 |
393.6064402 |
21.86702446 |
||
|
Total |
19 |
515.15142 |
|
Coefficients |
Standard Error |
t Stat |
P-value |
Lower 95% |
Upper 95% |
|
|
Intercept |
-36.2341856 |
48.843161 |
-0.741847 |
0.467749 |
-138.849859 |
66.381488 |
|
Exchange rate of dollar |
16.155889 |
6.8526284 |
2.357619 |
0.029912 |
1.759051 |
30.552727 |
5. Conclusions
With the stability of the global epidemic, the recovery of the world economy, the increase of tourism development and travel, the overall demand for oil is on the rise. However, since the outbreak of the Russia-Ukraine conflict, the impact of the war on the global economy has also driven the impact on the resource market. Through the investigation of oil data before and after the outbreak of the Russia-Ukraine conflict, this paper studies the extent to which the Russian Ukrainian war affects oil and gas companies and oil prices, and how the fluctuations of oil prices change under the influence of the war.
Through research, it is found that under the context of the Russia-Ukraine conflict, geopolitical tensions continue, global oil supply is unstable, the risk premium of oil futures is raised, and traders expect the supply shortage of the oil market to continue to increase, leading to a rise in short-term oil prices [13]. Geopolitical instability not only leads to a decrease in crude oil production, but also results in Russia being sanctioned by Europe and the United States. The European Union has announced an oil embargo on Russia [2], and many European and American countries have imposed sanctions on Russia, such as Shell and ExxonMobil announcing the termination of their cooperation with Russian energy companies [8]. The further limitation of Russia's export capacity has slowed down the Federal Reserve's interest rate hikes and led to a significant decline in the US dollar exchange rate, which has boosted confidence in the US dollar denominated crude oil futures market and pushed up oil prices [15].
Therefore, the geopolitics issues arising from the conflict between Russia and Ukraine, the instability of global oil supply, the sanctions imposed on Russia as a major exporter by Europe and the United States, and the decline of the US dollar exchange rate have all led to the rise of global oil prices, thus affecting the income changes of oil and gas companies. According to this finding, this study believes that easing the conflict between Russia-Ukraine conflict is the fastest solution to recover the oil price, but it is obviously not so easy to ease the conflict between countries. Therefore, in addition, the European and American countries lift the sanctions on Russian oil exports, make the dollar exchange rate rise, and perhaps also make the oil price return to the original level.
Acknowledgement
Yawen Deng and Xiaoqi Liu contributed equally to this work and should be considered co-first authors.
References
[1]. Utama, H. G, & Astuty, P. (2023). The Effect of The Russia-Ukraine War And Economic Determinants on Indonesian Oil Imports. EAI. 1-4
[2]. Goldthau, A., & Tagliapietra, S. (2022). Energy crisis: five questions that must be answered in 2023. Nature, 612(7941), 627–630. https: //doi.org/10.1038/d41586-022-04467-w
[3]. Qi, Z., Kun, Y., Yi, H., Jianbin, J., & Shouyang, W. (2023). Unveiling the impact of geopolitical conflict on oil prices: A case study of the Russia-Ukraine War and its channels. Energy Economics, 126, 106956.
[4]. Xing, X., Cong, Y., Wang, Y., & Wang, X. (2023). The impact of COVID-19 and war in Ukraine on energy prices of oil and natural gas. Sustainability, 15(19), 14208. https: //doi.org/10.3390/su151914208
[5]. Chakraborty, I., & Maity, P. (2020). CoviD-19 outbreak: Migration, effects on society, global environment and prevention. The Science of the TotalEnvironment, 728, 138882. https: //doi.org/10.1016/scitotenv.2020.138882
[6]. Roy, A., Soni, A., & Deb, S. (2023). A wavelet-based methodology to compare the impact of pandemic versus Russia–Ukraine conflict on crude oil sector and its interconnectedness with other energy and non-energy markets. Energy Economics. https: //doi.org/10.1016/j.eneco.2023.106830
[7]. Wang, Q., Yang, X., & Li, R. (2022). The impact of the COVID-19 pandemic on the energy market – A comparative relationship between oil and coal. Energy Strategy Reviews, 39, 100761. https: //doi.org/10.1016/j.esr.2021.100761
[8]. Zaghum, U., Y., D. A., Carlos, E., &. Wafa, E. (2022). Spillovers between sovereign yield curve components and oil price shocks. Energy Economics, Elsevier, vol. 109(C).
[9]. Onour, I. A., & Abdo, M. M. (2022). Sensitivity of Crude Oil Price Change to Major Global Factors and to Russian–Ukraine War Crisis. Journal of Sustainable Business and Economics, 5(2), 69-75
[10]. Gordon, A. J. G., & Recio, L. A. H. (2019). External Effects of the War in Ukraine: The Impact on the Price of Oil in the Short-term. International Journal of Energy Economics and Policy, 9(2), 267-276 https: //ideas.repec.org/a/eco/journ2/2019-02-31.html
[11]. Wang, Z., Liu, S., Wei, Y., & Wang, S. (2023). Estimating the impact of the outbreak of wars on financial assets: Evidence from Russia-Ukraine conflict. Heliyon, 9(11).
[12]. Prest, B. C. (2018). Explanations for the 2014 oil price decline: Supply or demand?. Energy Economics, 74, 63-75.
[13]. Aharon, D. Y. & Q., M. (2022). Infection, invasion, and inflation: Recent lessons. ideas.repec.org. https: //ideas.repec.org/a/eee/finlet/v50y2022ics1544612322004901.html
[14]. Zhao, C., & Chen, B. (2014). China's oil security from the supply chain perspective: A review. Applied Energy, 136, 269–279. https: //doi.org/10.1016/j.apenergy.2014.09.016
[15]. Chih-Chiang, W., Huimin, C., & Yu-Hsien, C. (2012). The economic value of co-movement between oil price and exchange rate using copula-based GARCH models. ideas.repec.org. https: //ideas.repec.org/a/eee/eneeco/v34y2012i1p270-282.html#author-abstract
[16]. IEA. (2023). Oil market report. https: //iea.blob.core.windows.net/assets/b36b96c7-eb7c-41d1-b213-e86fa42ae10d/-14NOV2023_OilMarketReport.pdf
Cite this article
Deng,Y.;Liu,X.;Fu,C.;Liang,T. (2025). What Was the Effect of the Ukraine War on Oil and Gas Companies and Oil Prices?. Advances in Economics, Management and Political Sciences,182,206-215.
Data availability
The datasets used and/or analyzed during the current study will be available from the authors upon reasonable request.
Disclaimer/Publisher's Note
The statements, opinions and data contained in all publications are solely those of the individual author(s) and contributor(s) and not of EWA Publishing and/or the editor(s). EWA Publishing and/or the editor(s) disclaim responsibility for any injury to people or property resulting from any ideas, methods, instructions or products referred to in the content.
About volume
Volume title: Proceedings of the 3rd International Conference on Financial Technology and Business Analysis
© 2024 by the author(s). Licensee EWA Publishing, Oxford, UK. This article is an open access article distributed under the terms and
conditions of the Creative Commons Attribution (CC BY) license. Authors who
publish this series agree to the following terms:
1. Authors retain copyright and grant the series right of first publication with the work simultaneously licensed under a Creative Commons
Attribution License that allows others to share the work with an acknowledgment of the work's authorship and initial publication in this
series.
2. Authors are able to enter into separate, additional contractual arrangements for the non-exclusive distribution of the series's published
version of the work (e.g., post it to an institutional repository or publish it in a book), with an acknowledgment of its initial
publication in this series.
3. Authors are permitted and encouraged to post their work online (e.g., in institutional repositories or on their website) prior to and
during the submission process, as it can lead to productive exchanges, as well as earlier and greater citation of published work (See
Open access policy for details).
References
[1]. Utama, H. G, & Astuty, P. (2023). The Effect of The Russia-Ukraine War And Economic Determinants on Indonesian Oil Imports. EAI. 1-4
[2]. Goldthau, A., & Tagliapietra, S. (2022). Energy crisis: five questions that must be answered in 2023. Nature, 612(7941), 627–630. https: //doi.org/10.1038/d41586-022-04467-w
[3]. Qi, Z., Kun, Y., Yi, H., Jianbin, J., & Shouyang, W. (2023). Unveiling the impact of geopolitical conflict on oil prices: A case study of the Russia-Ukraine War and its channels. Energy Economics, 126, 106956.
[4]. Xing, X., Cong, Y., Wang, Y., & Wang, X. (2023). The impact of COVID-19 and war in Ukraine on energy prices of oil and natural gas. Sustainability, 15(19), 14208. https: //doi.org/10.3390/su151914208
[5]. Chakraborty, I., & Maity, P. (2020). CoviD-19 outbreak: Migration, effects on society, global environment and prevention. The Science of the TotalEnvironment, 728, 138882. https: //doi.org/10.1016/scitotenv.2020.138882
[6]. Roy, A., Soni, A., & Deb, S. (2023). A wavelet-based methodology to compare the impact of pandemic versus Russia–Ukraine conflict on crude oil sector and its interconnectedness with other energy and non-energy markets. Energy Economics. https: //doi.org/10.1016/j.eneco.2023.106830
[7]. Wang, Q., Yang, X., & Li, R. (2022). The impact of the COVID-19 pandemic on the energy market – A comparative relationship between oil and coal. Energy Strategy Reviews, 39, 100761. https: //doi.org/10.1016/j.esr.2021.100761
[8]. Zaghum, U., Y., D. A., Carlos, E., &. Wafa, E. (2022). Spillovers between sovereign yield curve components and oil price shocks. Energy Economics, Elsevier, vol. 109(C).
[9]. Onour, I. A., & Abdo, M. M. (2022). Sensitivity of Crude Oil Price Change to Major Global Factors and to Russian–Ukraine War Crisis. Journal of Sustainable Business and Economics, 5(2), 69-75
[10]. Gordon, A. J. G., & Recio, L. A. H. (2019). External Effects of the War in Ukraine: The Impact on the Price of Oil in the Short-term. International Journal of Energy Economics and Policy, 9(2), 267-276 https: //ideas.repec.org/a/eco/journ2/2019-02-31.html
[11]. Wang, Z., Liu, S., Wei, Y., & Wang, S. (2023). Estimating the impact of the outbreak of wars on financial assets: Evidence from Russia-Ukraine conflict. Heliyon, 9(11).
[12]. Prest, B. C. (2018). Explanations for the 2014 oil price decline: Supply or demand?. Energy Economics, 74, 63-75.
[13]. Aharon, D. Y. & Q., M. (2022). Infection, invasion, and inflation: Recent lessons. ideas.repec.org. https: //ideas.repec.org/a/eee/finlet/v50y2022ics1544612322004901.html
[14]. Zhao, C., & Chen, B. (2014). China's oil security from the supply chain perspective: A review. Applied Energy, 136, 269–279. https: //doi.org/10.1016/j.apenergy.2014.09.016
[15]. Chih-Chiang, W., Huimin, C., & Yu-Hsien, C. (2012). The economic value of co-movement between oil price and exchange rate using copula-based GARCH models. ideas.repec.org. https: //ideas.repec.org/a/eee/eneeco/v34y2012i1p270-282.html#author-abstract
[16]. IEA. (2023). Oil market report. https: //iea.blob.core.windows.net/assets/b36b96c7-eb7c-41d1-b213-e86fa42ae10d/-14NOV2023_OilMarketReport.pdf