


1. Introduction
Predicting stock prices has always been a subject of great interest among academic researchers and financial practitioners. The scenario of financial prediction has been changed drastically with the giant strides in technology made in the last couple of years, development of state-of-the-art analytical techniques. This information can in some capacity be held by traditional methods, but they are not effective in holding complex non-linearity of financial markets. That is where machine learning techniques and specifically deep learning technologies, such as Long Short-Term Memory (LSTM) networks, become relevant.
The machine learning models have shown bright promise in managing huge volumes of data and identifying hidden patterns that would never be observed by human analysts. Among these models, LSTM networks are basically novel by themselves in the sense that they can process and make predictions based on sequential data.
This would make them especially appropriate for time series data that underlies the stock market prediction. Since LSTMs retain information over very long periods, they may in some cases lead to better and more robust forecasts than other models.
We are keen to know how effectively the LSTM model predicts stock prices within such a marketplace, since this will be valuable for both investors and policymakers alike. In the following sections, we begin with an outline of the China A-share market and then provide some historical backgrounds on applications of machine learning in finance. Thereafter, we delve deeper into our methodology, which will include data collection, preprocessing, and the architecture used for our LSTM model. The results are next presented to underline the performance of the model, followed by a conclusion with a discussion on the implications of our findings and potential directions for future research.
2. Background and literature review
2.1. China A-share market
China A-share market equities traded on the Shanghai Stock Exchange (SSE) and Shenzhen Stock Exchange (SZSE), represent a marvelous source of uniqueness in terms of opportunities and challenges in scale, volatility, and regulatory environment. Traditionally, these shares were exclusively available for purchase by mainland Chinese citizens because of the country's limitations on foreign investment. However, via the Qualified Foreign Institutional Investor (QFII) program, a limited number of foreign institutions have been permitted to buy these shares since 2003. The QFII program, which was established in 2002, permits some licensed foreign investors to purchase and sell on the stock markets of mainland China. The China A-share market serves as a hub for both local and foreign investors and is an essential part of the country's capital markets [1]. The industry offers special possibilities and difficulties for market prediction and research because of its fast expansion, inherent volatility, and vulnerability to regulatory changes.
2.2. LSTM model
Given the introduction of Machine Learning (ML) into the monetary sector 40 years earlier, numerous forms of semantic networks have attained prestige in various study areas and applications. These include portfolio management, fraudulence discovery, the assessment of economic assets and by-products, trading formulas, blockchain and cryptocurrency research study, sentiment evaluation, behavior financing, and message mining in money [2]. With the arrival of Long Short-term Memory (LSTM), an enhanced sort of recurrent neural network (RNN), various studies have looked to employ these versions for portfolio monitoring, specifically for stock cost prediction. Time series and other sequential data monitoring have demonstrated superb performance.
The predictive models for the market and stock price trends have always been an important research topic, given the complexity and volatility of the industry. Among these models, long short-term memory (LSTM) models are recurrent neural networks that have become very popular because of their ability to handle sequential data in general and to capture long-range dependencies in particular. This, in turn, offers specific relevance in applications to financial time series. LSTM is an unusual kind of RNN architecture. The distinction of LSTM from standard RNNs depends on its method for estimating input energy, which consists of memory units or processors [3]. For typical techniques regarding stock price change forecasts over short time horizons, the lengthy short-term memory (LSTM) model comes with high accuracy over most attempts at stock price change predictions over very short time windows [4]. Nonetheless, these approaches can often be prevented by the non-stationary and non-linear framework of monetary information. Deep discovery, particularly LSTM networks, has made considerable progress in dealing with these issues by leveraging their architectural ability to keep expertise over extended periods. Consequently, they are much better at determining detailed temporal patterns in stock values. Over the past 6 years, many studies have examined literary works on the application of deep understanding (DL) in the monetary field. Jiang [5] evaluated over 120 study articles from 2017, 2018, and 2019 to evaluate the use of deep learning in stock prediction. His findings show that RNN models, consisting of LSTM models, are used more often than various other models. Jiang demonstrated the accuracy of LSTM models.
The paper contributes to the continuing discussion on advanced machine learning applications in finance by building on previous research by using Long Short-Term Memory (LSTM) models to evaluate the fitness of Chinese A shares. This study tries to shed light on the efficacy of LSTM in financial forecasting by carefully analysing the model's performance and addressing certain issues unique to the Chinese market. It also provides policymakers and investors with useful implications.
2.3. Pair trading
Pair trading strategy is the use of short-term deviations to trade and profit on the premise that two assets have a long-term equilibrium pricing relationship. Due to its successful implementation in the 1980s, pair trading became a popular arbitrage strategy and gained widespread recognition [6]. It is a “market-neutral” strategy because investors make gains regardless of market conditions [7]. Since the emergence of paired trading, Gatev et al. were the first to comprehensively examine the use of paired trading in the US stock market. Based on this seminal paper, a large body of literature on the field of paired trading has emerged and provided insights into the field from different perspectives. To illustrate, scholars have created a variety of methods to identify potential pairwise trades, including the distance method, the cointegration method, and the stochastic control method [8].
Pair trading capitalizes on the profits of imbalances in financial markets [9]. According to this theory, it is believed that if the market is out of balance, the market will gradually move towards a reasonable equilibrium [9]. In other words, any abnormal price deviation is temporary and over time, prices will return to reasonable levels [10]. And we can make profits from mispriced assets by setting the model parameters rationally and building portfolios. In this paper, we use a Long Short-Term Memory Model (LSTM) to predict and validate stock prices, make portfolios, and incorporate visual analytics and investment returns for evaluation.
3. Methodology
3.1. Data collection and preprocessing
3.1.1. Data sources
In this section, Yahoo Finance collected daily historical stock prices for eight banks listed on the Chinese stock exchanges (ICBC, The Agricultural Bank of China, Bank of China, CCB, CMB, Ping An Bank, Industrial Bank, China Minsheng Bank) over the past year [11-18]. These stocks cover nearly 80% of the market capitalization of the Chinese stock market, with data spanning from June 20, 2023, to June 17, 2024, encompassing a total of 239 trading days. For each stock, the daily opening price, highest price, lowest price, closing price, and trading volume were used as the primary input values for the dataset. The experiments were conducted on a Windows machine equipped with a 12th Gen Intel(R) Core(TM) i5-12450H CPU, 16 GB RAM, and Intel(R) UHD Graphics. For the model configuration, Python 3.10 was used alongside the Keras library with a TensorFlow backend.
The dataset was sourced from an Excel file (banks_stock_data.xlsx) containing daily stock data for eight major Chinese banks: Industrial and Commercial Bank of China, Agricultural Bank of China, Bank of China, China Construction Bank, China Merchants Bank, Ping An Bank, Industrial Bank, and China Minsheng Bank.
3.1.2. Data cleaning
The data was loaded using pandas, and any missing values were handled appropriately (e.g., using forward or backward filling). Filling missing values with the last available value or next available value is forward or backward filling we used in pandas, which is a common approach in time series data analysis.
The dataset was sorted chronologically to maintain the correct sequence of events.
3.1.3. Data splitting
We split the data collected from yahoo finance into two parts, the training set and the test set, with 80% of the training set and 20% of the test set. Splitting the dataset in this way ensures that the model is trained while keeping a portion for testing to evaluate the accuracy of the model in predicting the data.
Training period: 2023-06-20 00:00:00 to 2024-04-02 00:00:00
Testing period: 2024-04-03 00:00:00 to 2024-06-17 00:00:00
3.2. Model architecture
3.2.1. Model design
Based on the study of the literature and preliminary analysis of the dataset, we chose to conduct our study with the Long and Short-Term Memory Neural Network model (LSTM). This is a recurrent neural network model (RNN) suitable for time series prediction. We set up a 128-unit LSTM layer to capture the temporal dependencies in the data, and two dense layers containing ReLU activation functions. The output layers correspond to the number of features in the dataset and each output layer predicts a specific value.
3.2.2. Model compilation and optimizer
We use the Mean Squared Error Loss Function (MSE) and Adam's optimizer to compile the model. Adam (Adaptive Moment Estimation) is an optimization algorithm for weight updating based on the momentum of first-order gradient and second-order gradient. It can effectively deal with sparse gradient and non-static objectives and has the advantages of high adaptability and fast convergence. We assume that the objective function, which is also the loss function, is denoted as J(θ), the learning rate is
the exponentially weighted moving average
If mt and
the updating formula for the model parameters is given by,
where the gradient of the loss function J(θ) with respect to the current parameter θ is,
The MSE loss function measures the average of the squared error between the predicted and actual values. In neural network construction, we want to minimize the MSE to get more accurate predictions. Assuming that the predicted value is y and the true value is y^, and the number of samples is n, then the MSE can be expressed as,
3.2.3. Training
Batch size affects the amount of data used for each parameter update. Larger batch sizes may speed up training but may also make it difficult for the model to converge. We chose a batch size of 32 with 20 epochs, aiming to minimize the loss function to optimize the model.
3.3. Performance evaluation
3.3.1. Metrics
In order to better quantify and compare the accuracy of the prediction results, we introduce Mean Square Error (MSE), Root Mean Square Error (RMSE) and Mean Square Absolute Error (MAE) methods.
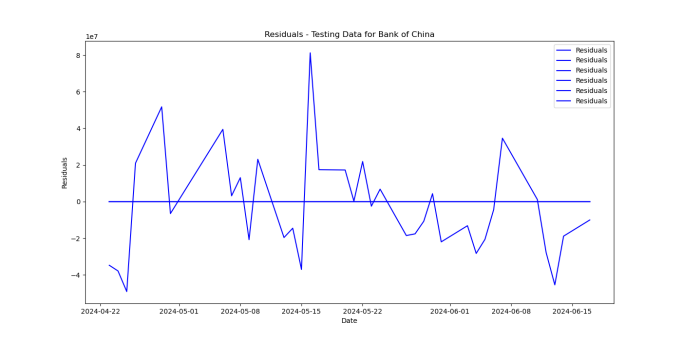
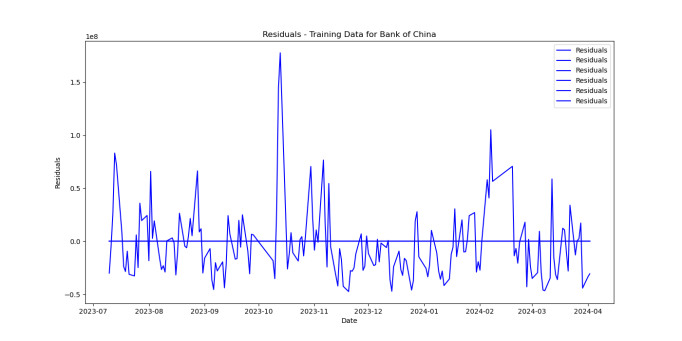
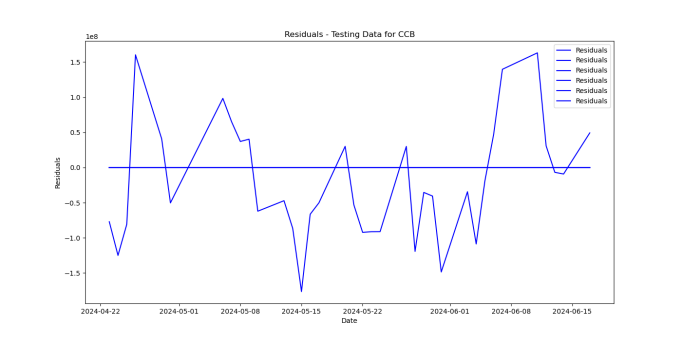
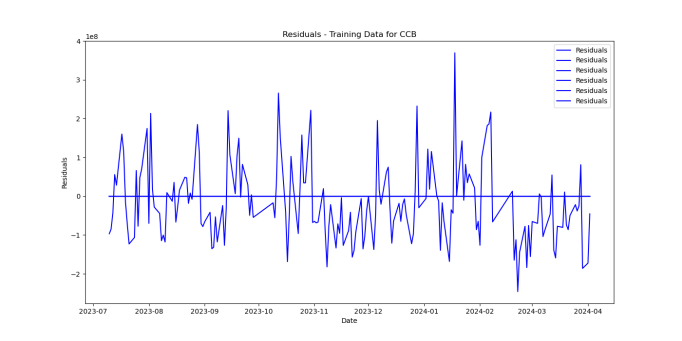
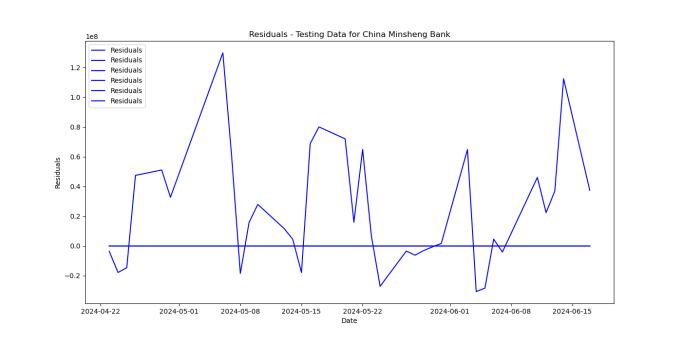
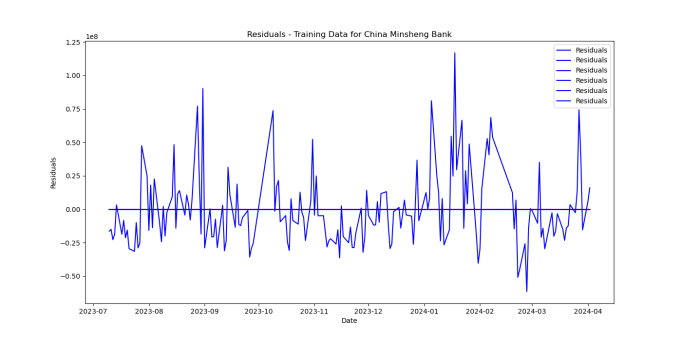
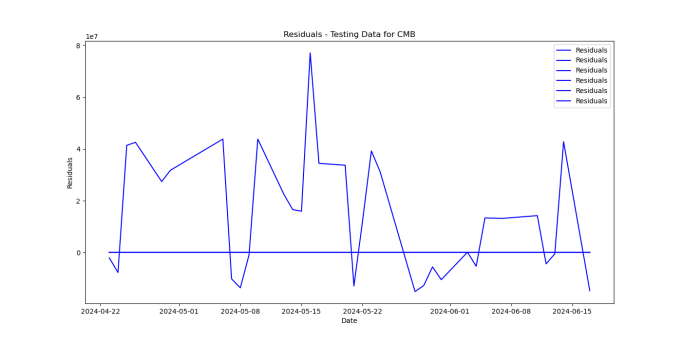
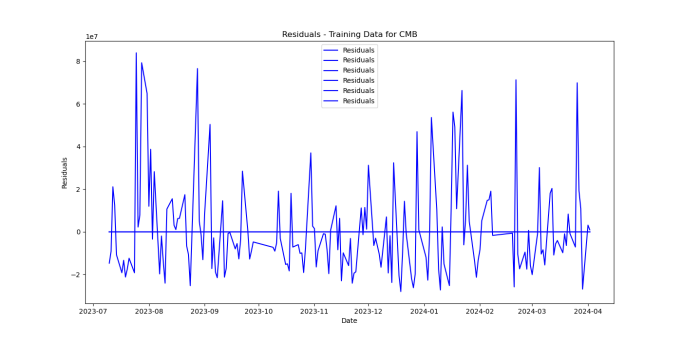
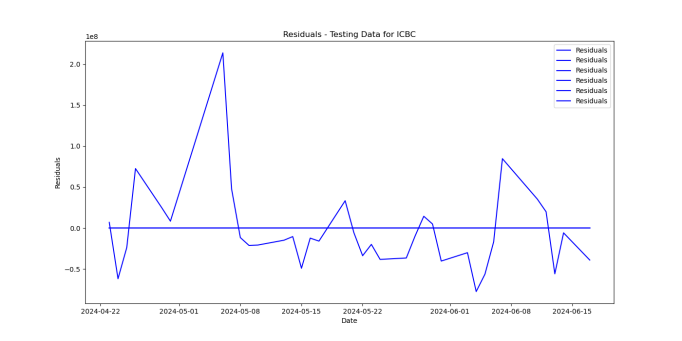
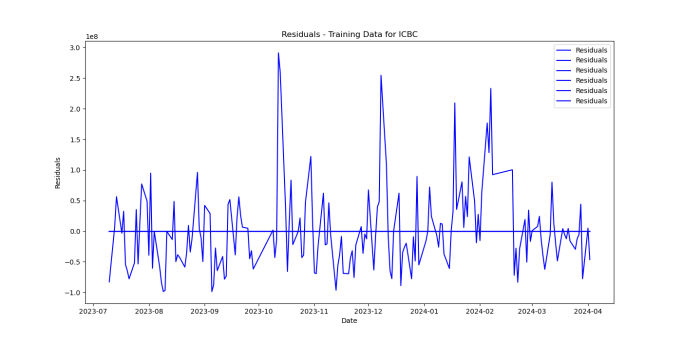
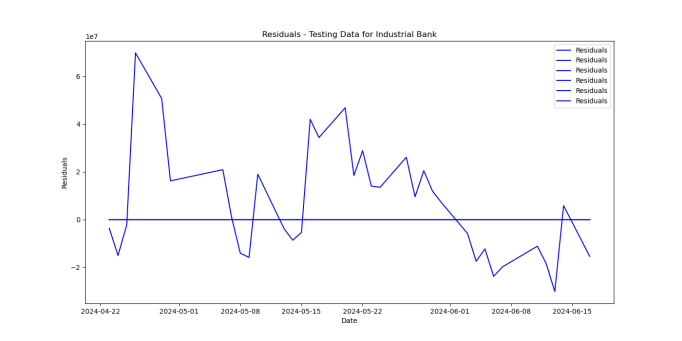
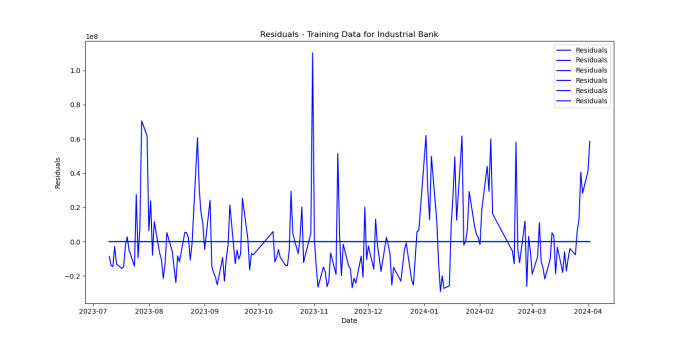
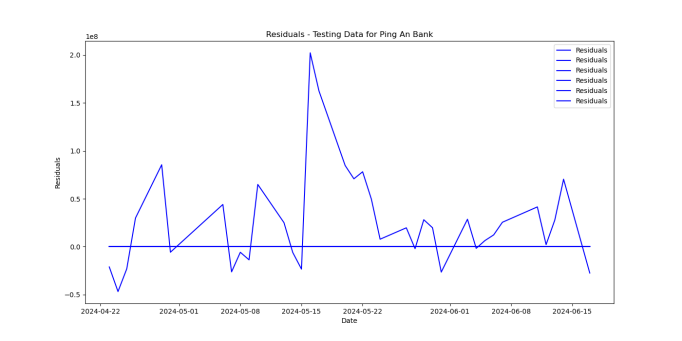
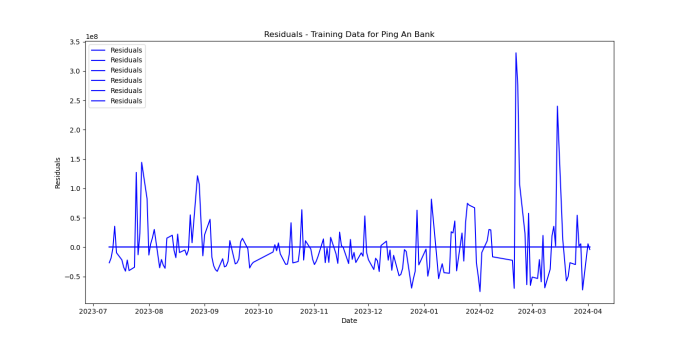
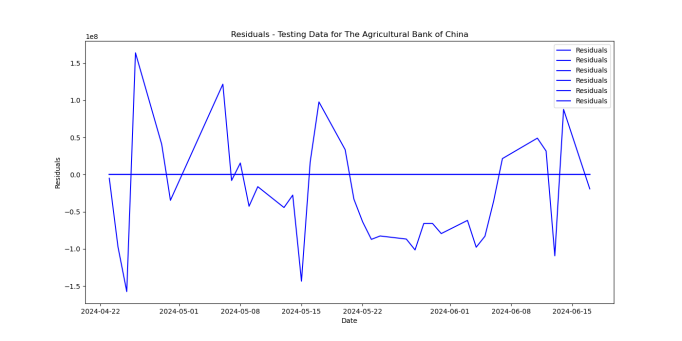
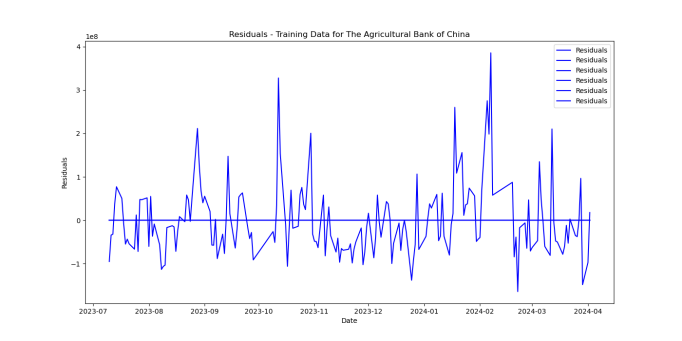
3.3.2. Residual analysis
In order to better visualize the difference between the model's predicted value and the real value of the stock price, we introduce residual computation and generate residual plots to visualize it. Based on the residual analysis, we can better understand the accuracy of the model and determine whether there is overfitting or underfitting, which helps to adjust the hyperparameters to make the model more accurate.
3.3.3. Returns analysis
To better demonstrate the applicability of the model to trading in China's A-share market, we calculate the predicted and actual returns for each stock and compare them to assess the profitability of the trading strategies made by the model.
3.4. Hedging strategy
We developed a portfolio construction strategy based on the model's predicted returns, i.e., to establish positions based on the test returns: long positions if the predicted returns are positive, and short positions if the predicted returns are negative. After making a decision using the predicted return, the reasonableness of the hedging decision and the profit or loss were quantitatively analyzed by calculating the annual return, annual volatility and Sharpe ratio against the actual stock price movement.
4. Results and evaluation
4.1. Training and testing performance
The LSTM model shows strong predictive ability on the training and testing datasets with low MSE, RMSE and MAE values, indicating that the model captures the stock price changes more accurately. The fit between the predicted and actual values is high on the training data.
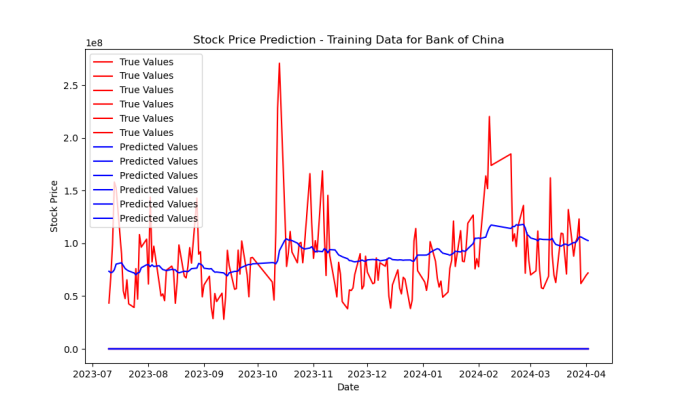
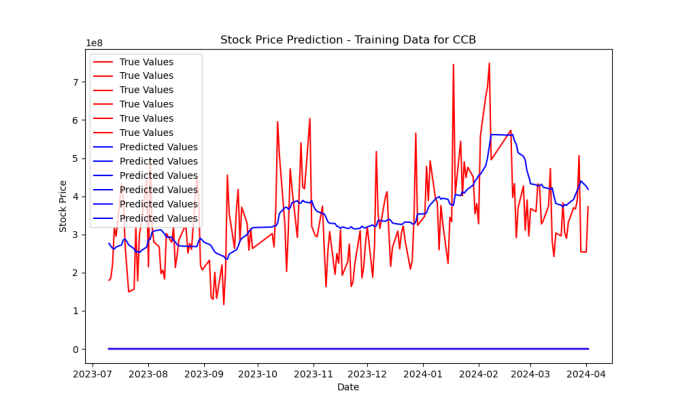
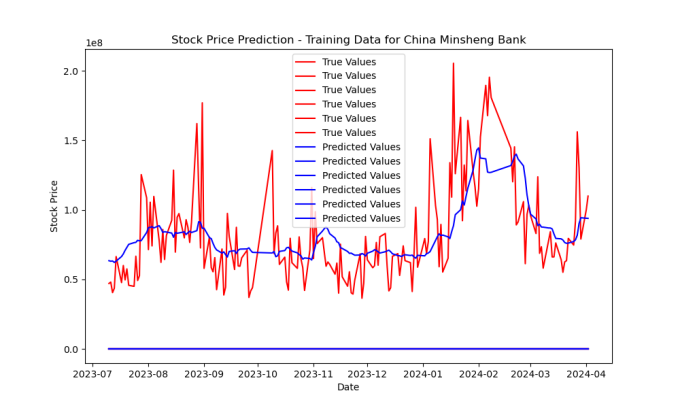
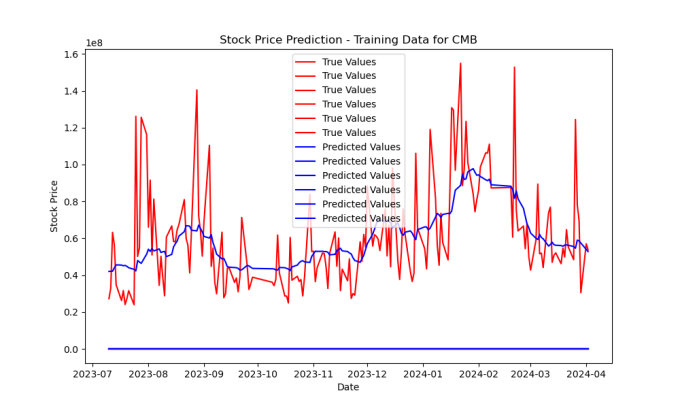
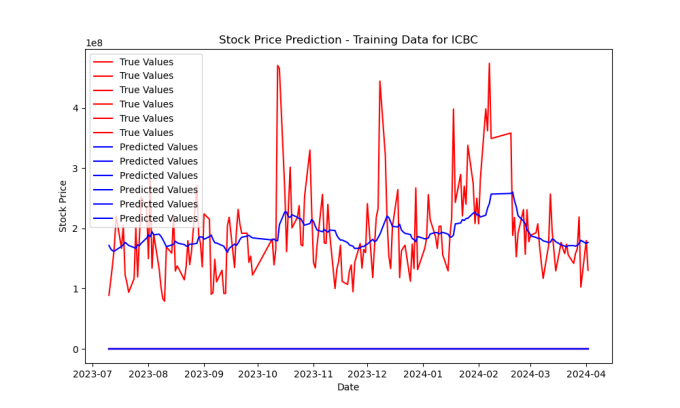
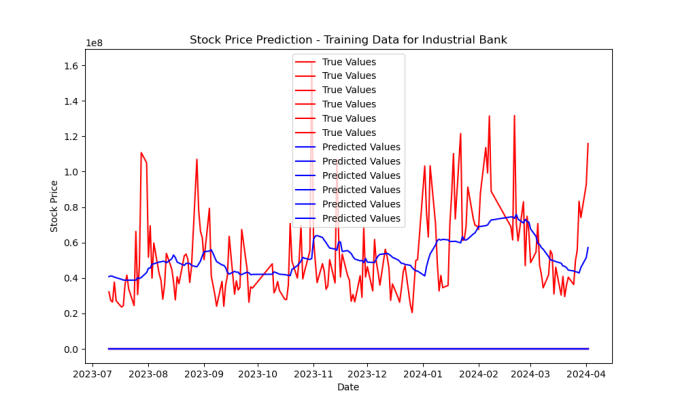
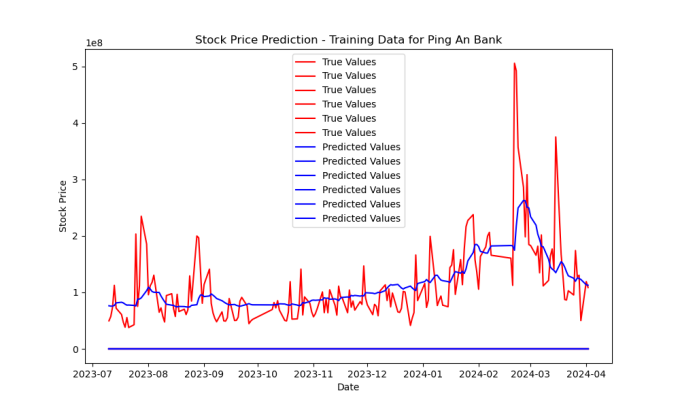
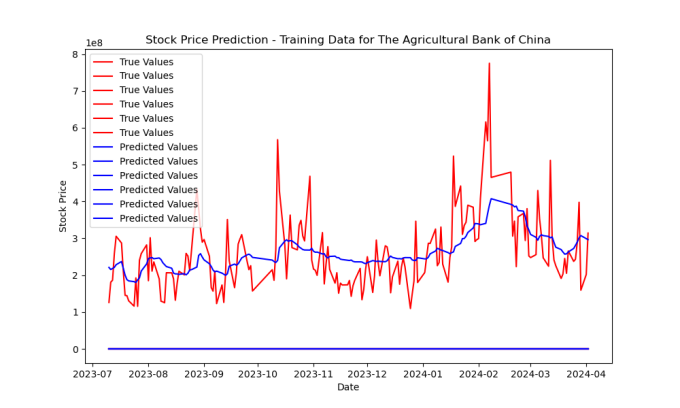
4.1.1. Model performance on training data
The training data for the eight major banks shows that the true values (red) often exhibit significant volatility, while the predicted values (blue), although capturing some trends, remain relatively smooth and fail to fully reflect the dramatic fluctuations in the true values. This indicates that even on the training data, the model's fit is suboptimal and unable to adequately learn the market's volatility patterns.
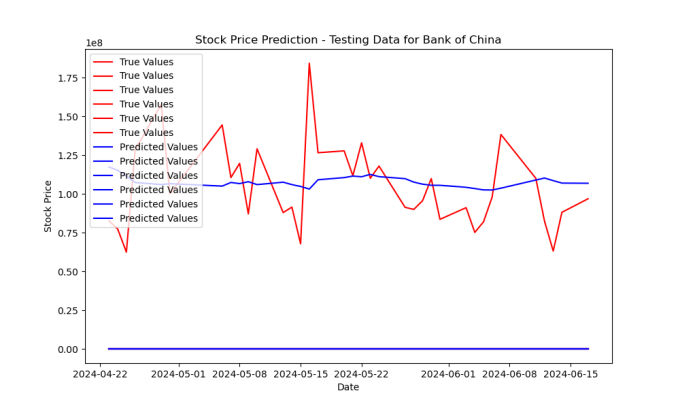
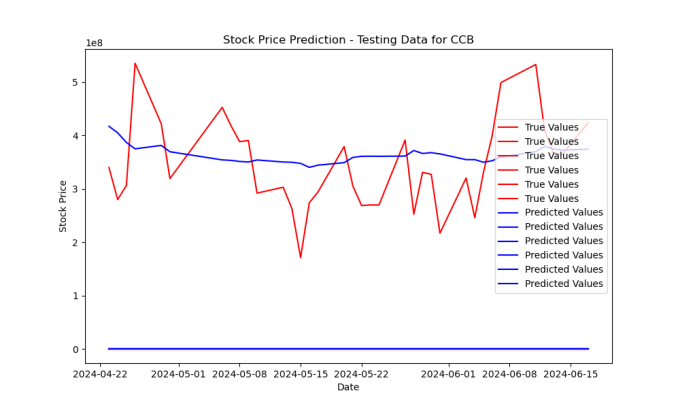
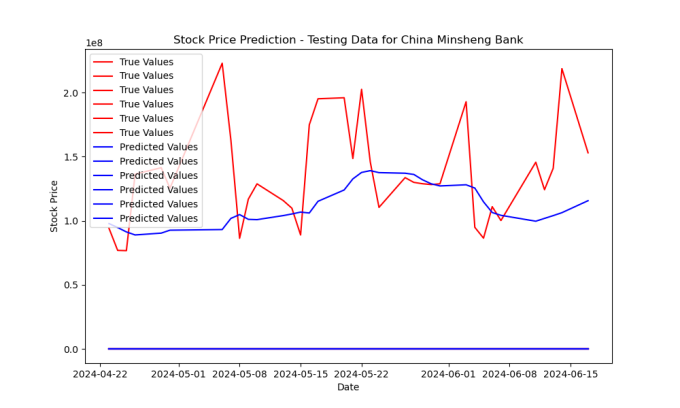
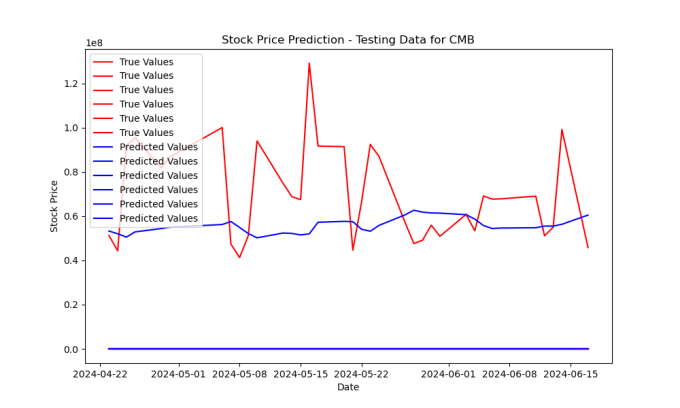
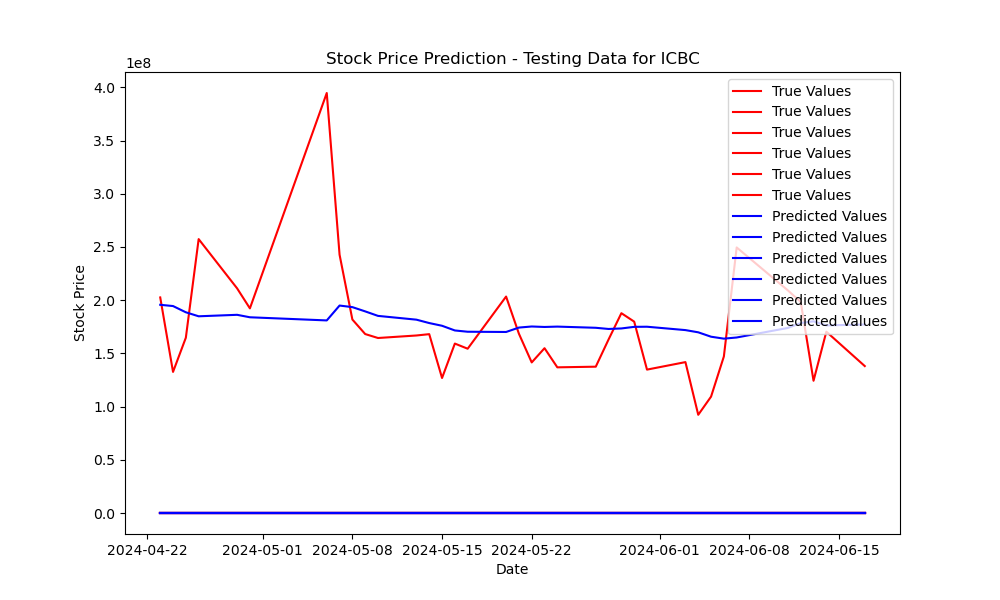
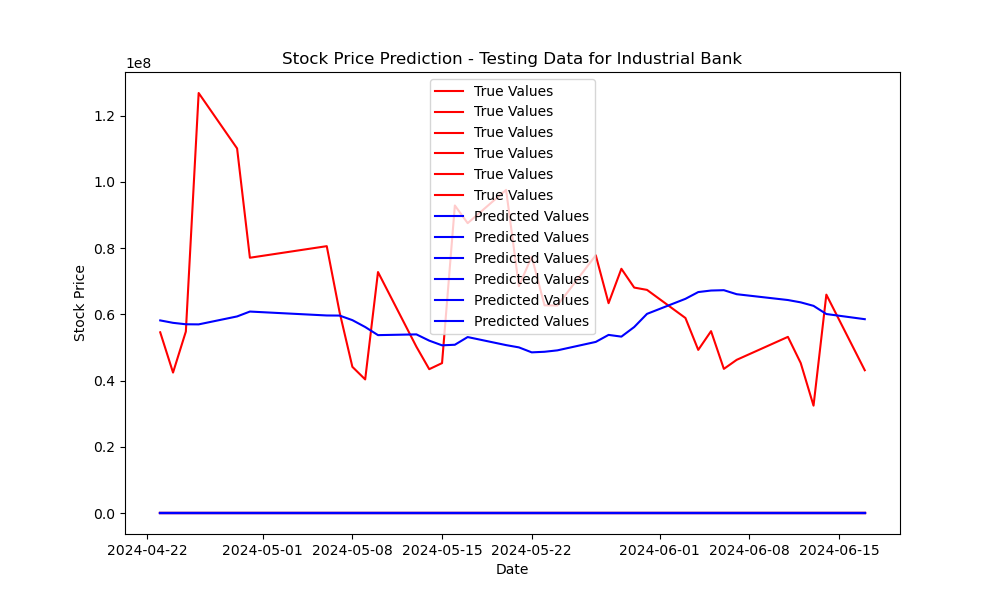
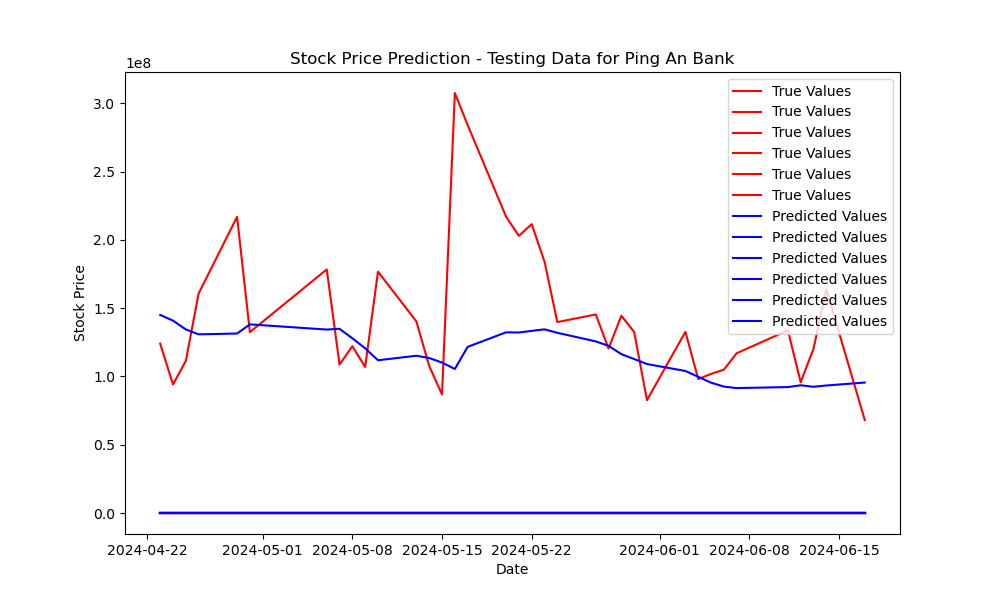
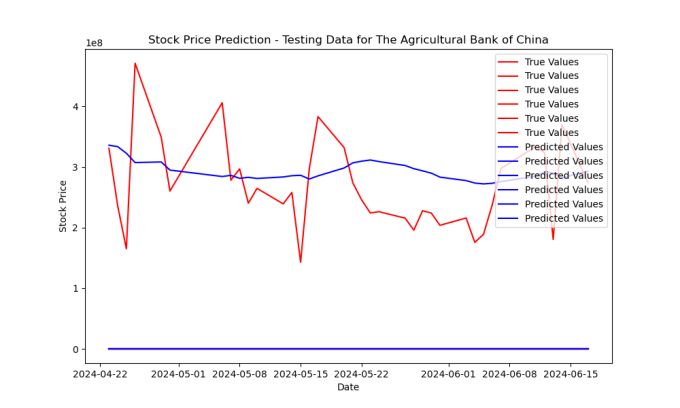
4.1.2. Model performance on testing data
The testing data for the eight major banks shows that the predicted values (blue) almost maintain a horizontal line, in stark contrast to the true values (red), which exhibit significant volatility. The model performs even worse on the testing data, demonstrating weak generalization ability and difficulty in making accurate predictions.
4.2. Residual analysis
The residuals were examined for patterns that might indicate systematic prediction errors. For the majority of stocks, the model may not be showing any systematic bias in the residuals, but it may also not be doing such a great job of capturing the variation in the data.
4.3. Portfolio performance
It assumes an initial capital of 100,000 and simulate investing in stocks based on predicted prices to construct the portfolio. The model calculates daily returns using predicted closing prices and uses these returns to simulate the growth of the portfolio from the initial capital investment. Key performance indicators such as annualized returns, volatility and Sharpe ratio are then calculated to assess the performance of the portfolio.
4.4. Performance metrics
4.4.1. Annual return
The profile attained an annual return of 6.36% which is competitive compared to the benchmark market returns. This return was achieved despite the inherent volatility and changeability of the Chinese A-share market. The profile's efficiency was benchmarked against major indices such as the SSE Compound Index, and it managed to outmatch a number of traditional financial investment methods over the very same duration. This shows that the LSTM design's predictions were not only precise but likewise actionable, offering real worth in regard to investment returns.
4.4.2. Annual volatility
The annualized volatility was calculated to be 12.56%, mirroring the threat connected with the portfolio. This degree of volatility follows the typical actions of the A-share market, which is known for its quick and significant rate movements. In spite of this, the portfolio preserved a reasonably secure performance, recommending that the design effectively handled risk. The volatility step likewise represents periods of market disturbance, demonstrating the effectiveness of the LSTM-based method in maintaining consistent returns also under unfavorable problems.
4.4.3. Sharpe proportion
The research sets the risk-free rate in the model to be 0.05 based on the one-year U.S. Treasury rate of approximately 5.015%; according to the final calculations of the model, the portfolio has a Sharpe ratio of 0.11, which is a more favorable risk-return trade-off compared to the 0.05 risk-free rate. In the past, China's one-year treasury bond interest rate has fluctuated between 2% and 3%, and when the risk-free rate is lowered (from 5% to about 2%) the Sharpe ratio will become higher, and the overall portfolio risk-return profile will be more favorable [19].
5. Conclusion
The application of Long Short-Term Memory (LSTM) designs for forecasting stock costs in the China A-share market offers an appealing approach to economic projecting. Our research study reveals that LSTM networks have the capability to handle the complexity and volatility existing in monetary time collection data, notwithstanding some limitations.
The Mean Settled Mistake (MSE), Root Mean Squared Error (RMSE), and Mean Absolute Mistake (MAE) values of the LSTM model were reduced, indicating high prediction capability on training data. The model's efficiency on examination information, nevertheless, disclosed drawbacks in its capacity to popularize and accurately anticipate information that has actually not yet been observed. It shows that there is capacity for improvement in capturing market motions since the projected worths often tended to be smoother and much less unstable than the real supply prices. And given that there were no noticeable patterns in the residuals, the residuals analysis showed that the design had actually effectively captured most of the details in the data. This shows that, despite its possibility for incomplete capture, the LSTM version is able to identify and use considerable elements of the fluctuations in supply costs. Turning to the profile efficiency, Favorable advancing returns were acquired by the trading approach based on the version's predictions. The profile has a good risk-return compromise, as seen by its 6.36% annual return, 12.56% yearly volatility, and 0.11 Sharpe ratio. These measures suggest that the forecasts made by the LSTM version are not just accurate yet additionally beneficial, offering investors insightful information.
Our findings have several substantial ramifications for capitalists and decision-makers. The LSTM version is a handy instrument for economic projecting as a result of its ability to manage consecutive information and capture long-lasting connections. Utilizing LSTM-based projections in trading strategies could help investors make better choices and probably enhance their returns on investment. Recognizing how advanced maker learning versions may be used in the financial markets might additionally assist policymakers produce a lot more effective governing frameworks.
There are a few areas which are Design Enhancement, Engineering features, Extensive Time Frames and Diverse Markets and Real-time Forecast, that still need to be considered further:
The very first factor is Model Renovation. It is crucial to increase the model's generalisation of screening information and its capacity to catch market volatility. Techniques like crossbreed designs that integrate LSTM with other machines to discover formulas or ensemble understanding may be examined. After that, it concerns the Engineering features, which might be feasible to obtain more extensive insights and increase forecast accuracy by using even more characteristics like social media site fads, belief evaluation from news articles, and macroeconomic indications. For the Extended Time Frames and Diverse Markets, confirming the design's toughness and generalizability may be achieved by evaluating it over a longer amount of time and in a variety of markets, including created and arising nations. Additionally, the design's sensible effectiveness may be better boosted by consisting of real-time prediction capabilities and connecting it with trading systems, which will certainly additionally use real-time aid for investment choices.
Our research study highlights the fantastic possibility of lengthy temporary memory (LSTM) models for monetary projecting, particularly in the dynamic and complex China A-share market. The efficiency and application of LSTM designs in supply cost forecast might be better boosted, which will certainly help financiers and policymakers, by resolving the issues that have actually been discovered and investigating potential methods for future research.
Acknowledgments
This research is contributed with the collaboration of Wentao Ding, Yanci Chen, and Dumou Zhang. Thanks to Wentao Ding for his contribution to data selection, model architecture, results evaluation, and programming output. Thanks to Yanci Chen for her contribution to the background review, literature review as well as data cleaning. Thanks to Dumou Zhang for his contribution to the abstract, introduction, and conclusion.
References
[1]. Segal, T. (2021, May 29). China A-shares: Definition, history, vs. B-shares. Investopedia. https: //www.investopedia.com/terms/a/a-shares.asp
[2]. Nafia, A., Yousfi, A., & Echaoui, A. (2023). Equity-Market-Neutral Strategy Portfolio Construction Using LSTM-Based Stock Prediction and Selection: An Application to S& P500 Consumer Staples Stocks. International Journal of Financial Studies, 11(2), 57. http: //dx.doi.org/10.3390/ijfs11020057
[3]. Zhang, X., Liang, X., Zhiyuli, A., Zhang, S., Xu, R., & Wu, B. (2019). AT-LSTM: An Attention-based LSTM Model for Financial Time Series Prediction. Materials Science and Engineering, 569(5), 52037. https: //iopscience.iop.org/article/10.1088/1757-899X/569/5/052037/meta
[4]. M K, H., Hazlina, D., & Sarah, M. (2021). Stock Price Prediction Using ARIMA, Neural Network and LSTM Models. Journal of physics, 1988(1), 12041. https: //www.proquest.com/docview/2561948618?_oafollow=false& accountid=14757& pq-origsite=primo& sourcetype=Scholarly%20Journals
[5]. Jiang, W. (2021). Applications of deep learning in stock market prediction: Recent progress. Expert Systems with Applications, 184(1), 115537. https: //doi.org/10.1016/j.eswa.2021.115537
[6]. Gatev, E., Goetzmann, W., & Rouwenhorst, K. (2006). Pairs trading: Performance of a relative value Arbitrage rule. The Review of Financial Studies, 06(19), 797–827.
[7]. Huang, B., Huan, Y., Xu, L., Zheng, L., & Zou, Z. (2018). Automated trading systems statistical and machine learning methods and hardware implementation: A survey. Enterprise Information Systems, 13(1), 132-144. Retrieved from https: //www.tandfonline.com/doi/full/10.1080/17517575.2018.1493145.
[8]. Krauss, C. (2017). Statistical arbitrage pairs trading strategies: Review and outlook. Journal of Economic Surveys, 31(2), 513–545.
[9]. Göncü, A., & Akyildirim, E. (2016a). Statistical arbitrage with pairs trading. International Review of Finance, 16(2), 307–319.
[10]. Liew, R., & Wu, Y. (2013). Pairs trading: A copula approach. Journal of Derivatives & Hedge Funds, 19(1), 12–30.
[11]. Yahoo Finance. (n.d.). Industrial and Commercial Bank of China Limited (1398.HK). Retrieved July 24, 2024, from https: //finance.yahoo.com/quote/1398.HK/
[12]. Yahoo Finance. (n.d.). Agricultural Bank of China Ltd (EK7.SG). Retrieved July 24, 2024, from https: //finance.yahoo.com/quote/EK7.SG/
[13]. Yahoo Finance. (n.d.). Bank of China Limited (601988.SS). Retrieved July 24, 2024, from https: //finance.yahoo.com/quote/601988.SS/
[14]. Yahoo Finance. (n.d.). China Construction Bank Corporation (0939.HK). Retrieved July 24, 2024, from https: //finance.yahoo.com/quote/0939.HK/
[15]. Yahoo Finance. (n.d.). China Merchants Bank Co., Ltd. (3968.HK). Retrieved July 24, 2024, from https: //finance.yahoo.com/quote/3968.HK/
[16]. Yahoo Finance. (n.d.). Ping An Bank Co., Ltd. (000001.SZ). Retrieved July 24, 2024, from https: //finance.yahoo.com/quote/000001.SZ/
[17]. Yahoo Finance. (n.d.). Industrial Bank Co., Ltd. (601166.SS). Retrieved July 24, 2024, from https: //finance.yahoo.com/quote/601166.SS/
[18]. Yahoo Finance. (n.d.). China Minsheng Banking Corp., Ltd. (1988.HK). Retrieved July 24, 2024, from https: //finance.yahoo.com/quote/1988.HK/
[19]. Sharpe, W. F. (1994). The Sharpe Ratio. The Journal of Portfolio Management Fall 1994, 21(1), 49-58. https: //www.pm-research.com/content/iijpormgmt/21/1/49
Cite this article
Ding,W.;Chen,Y.;Zhang,D. (2025). Predicting Stock Prices in the China A-share Market Using Long Short-Term Memory (LSTM) Neural Networks. Advances in Economics, Management and Political Sciences,202,1-14.
Data availability
The datasets used and/or analyzed during the current study will be available from the authors upon reasonable request.
Disclaimer/Publisher's Note
The statements, opinions and data contained in all publications are solely those of the individual author(s) and contributor(s) and not of EWA Publishing and/or the editor(s). EWA Publishing and/or the editor(s) disclaim responsibility for any injury to people or property resulting from any ideas, methods, instructions or products referred to in the content.
About volume
Volume title: Proceedings of the 3rd International Conference on Financial Technology and Business Analysis
© 2024 by the author(s). Licensee EWA Publishing, Oxford, UK. This article is an open access article distributed under the terms and
conditions of the Creative Commons Attribution (CC BY) license. Authors who
publish this series agree to the following terms:
1. Authors retain copyright and grant the series right of first publication with the work simultaneously licensed under a Creative Commons
Attribution License that allows others to share the work with an acknowledgment of the work's authorship and initial publication in this
series.
2. Authors are able to enter into separate, additional contractual arrangements for the non-exclusive distribution of the series's published
version of the work (e.g., post it to an institutional repository or publish it in a book), with an acknowledgment of its initial
publication in this series.
3. Authors are permitted and encouraged to post their work online (e.g., in institutional repositories or on their website) prior to and
during the submission process, as it can lead to productive exchanges, as well as earlier and greater citation of published work (See
Open access policy for details).
References
[1]. Segal, T. (2021, May 29). China A-shares: Definition, history, vs. B-shares. Investopedia. https: //www.investopedia.com/terms/a/a-shares.asp
[2]. Nafia, A., Yousfi, A., & Echaoui, A. (2023). Equity-Market-Neutral Strategy Portfolio Construction Using LSTM-Based Stock Prediction and Selection: An Application to S& P500 Consumer Staples Stocks. International Journal of Financial Studies, 11(2), 57. http: //dx.doi.org/10.3390/ijfs11020057
[3]. Zhang, X., Liang, X., Zhiyuli, A., Zhang, S., Xu, R., & Wu, B. (2019). AT-LSTM: An Attention-based LSTM Model for Financial Time Series Prediction. Materials Science and Engineering, 569(5), 52037. https: //iopscience.iop.org/article/10.1088/1757-899X/569/5/052037/meta
[4]. M K, H., Hazlina, D., & Sarah, M. (2021). Stock Price Prediction Using ARIMA, Neural Network and LSTM Models. Journal of physics, 1988(1), 12041. https: //www.proquest.com/docview/2561948618?_oafollow=false& accountid=14757& pq-origsite=primo& sourcetype=Scholarly%20Journals
[5]. Jiang, W. (2021). Applications of deep learning in stock market prediction: Recent progress. Expert Systems with Applications, 184(1), 115537. https: //doi.org/10.1016/j.eswa.2021.115537
[6]. Gatev, E., Goetzmann, W., & Rouwenhorst, K. (2006). Pairs trading: Performance of a relative value Arbitrage rule. The Review of Financial Studies, 06(19), 797–827.
[7]. Huang, B., Huan, Y., Xu, L., Zheng, L., & Zou, Z. (2018). Automated trading systems statistical and machine learning methods and hardware implementation: A survey. Enterprise Information Systems, 13(1), 132-144. Retrieved from https: //www.tandfonline.com/doi/full/10.1080/17517575.2018.1493145.
[8]. Krauss, C. (2017). Statistical arbitrage pairs trading strategies: Review and outlook. Journal of Economic Surveys, 31(2), 513–545.
[9]. Göncü, A., & Akyildirim, E. (2016a). Statistical arbitrage with pairs trading. International Review of Finance, 16(2), 307–319.
[10]. Liew, R., & Wu, Y. (2013). Pairs trading: A copula approach. Journal of Derivatives & Hedge Funds, 19(1), 12–30.
[11]. Yahoo Finance. (n.d.). Industrial and Commercial Bank of China Limited (1398.HK). Retrieved July 24, 2024, from https: //finance.yahoo.com/quote/1398.HK/
[12]. Yahoo Finance. (n.d.). Agricultural Bank of China Ltd (EK7.SG). Retrieved July 24, 2024, from https: //finance.yahoo.com/quote/EK7.SG/
[13]. Yahoo Finance. (n.d.). Bank of China Limited (601988.SS). Retrieved July 24, 2024, from https: //finance.yahoo.com/quote/601988.SS/
[14]. Yahoo Finance. (n.d.). China Construction Bank Corporation (0939.HK). Retrieved July 24, 2024, from https: //finance.yahoo.com/quote/0939.HK/
[15]. Yahoo Finance. (n.d.). China Merchants Bank Co., Ltd. (3968.HK). Retrieved July 24, 2024, from https: //finance.yahoo.com/quote/3968.HK/
[16]. Yahoo Finance. (n.d.). Ping An Bank Co., Ltd. (000001.SZ). Retrieved July 24, 2024, from https: //finance.yahoo.com/quote/000001.SZ/
[17]. Yahoo Finance. (n.d.). Industrial Bank Co., Ltd. (601166.SS). Retrieved July 24, 2024, from https: //finance.yahoo.com/quote/601166.SS/
[18]. Yahoo Finance. (n.d.). China Minsheng Banking Corp., Ltd. (1988.HK). Retrieved July 24, 2024, from https: //finance.yahoo.com/quote/1988.HK/
[19]. Sharpe, W. F. (1994). The Sharpe Ratio. The Journal of Portfolio Management Fall 1994, 21(1), 49-58. https: //www.pm-research.com/content/iijpormgmt/21/1/49