


1. Introduction
1.1. Background
Humans are seeking methods to cut greenhouse gas emissions. Rising levels of carbon dioxide (CO2) emissions, the most common of all greenhouse gas emissions, are leading to life-threatening climate change [1]. As an effort to protect the climate, controlling the increasing CO2 emissions is fundamental. Of all the CO2 emissions from energy in 2018, the transport sector contributed to about 24% of it, of which 45.1% was from passenger vehicles [2]. Noting that the demand for automobiles is constantly growing [3], the adoption of electric vehicles (for short EVs) is a feasible and effective solution to cut carbon emissions from cars.
Now, EVs are gaining popularity worldwide, with global demand at 7.7 million in 2022 [4]. This means that the inevitable trend of EVs has put forward prospective and lucrative markets to develop in, and China is one of the most active participators. The country has become the world’s largest EV market in terms of EV stock and sales and the leader in manufacturing them [5], and car manufacturers are also pushing their expansion overseas [6]. In 2021, China has already become a dominant exporter of EVs [7], exporting 1.2 million EVs in 2023 [8], and the majority of them are sold to Europe [4]. This is why I set my eyes on CEVs’ conditions in Europe: the region is of strategic significance if CEVs are to meet the trends and expand off-shore, and the research on sales is the most straightforward way to demonstrate CEVs’ conditions of development in the market–it is the operationalization of the actual dependent variable: CEVs’ status quo in Europe.
Recently, the EU has decided to impose tariffs on CEVs after an investigation. With the surge of CEVs’ imports, sales, and market share (projected to soar to 15% by 2025) in Europe (as mentioned in the previous paragraph, Europe is CEVs’ largest export market), the EU is running an inclining trade deficit with China, it had expressed concerns of Chinese products being able to competitively and threateningly grow in Europe’s EV industry [9]. Hence, backed by its intention to protect the domestic manufacturers, the EU initiated an anti-subsidy investigation into imports of CEVs in October 2023 [10], and based on the findings of manufacturers benefiting from “under-priced loans, equity injections, purchase subsidies, and government contracts”, it imposed “provisional countervailing duties” on imports of EVs from China. The individual duties applying to the three sampled manufacturers are BYD at 17.4%, Geely at 19.9%, and SAIC Motors at 37.6%. Other investigated manufacturers that are not sampled are subject to a 20.8% “weighted average duty”. The duty for non-cooperating companies is 37.6%. The tariffs will apply on July the 5th, 2024 for a maximum of four months, during which EU Member States will vote on whether to make the duties definitive for five years [11].
1.2. Research question
Noting the significance of CEVs’ status quo in its biggest foreign market Europe, and that tariffs are just set up in this market for those vehicles, I put forward the research question:
How much will the EU’s Tariffs on Chinese EVs Affect their Sales in Europe?
1.3. Contribution and relation to previous work
Numerous paperwork in the past have gone over the effect of trade policies on the EV sector. Fan et al. [12] explored in general the effect of the introduction of international EVs into the domestic EV market and determined the optimal pricing strategies of domestic and international manufacturers and the local government’s optimal decisions on subsidies and tariffs to maximize social welfare; a working paper Coffin et al. [13] ran a computable general equilibrium (CGE) analysis on the effect of tariff imposed by all other regions, including Europe, on Chinese EV and EV part exports. Both papers discussed the situation of a country exporting too many EV products: one went into detail about strategies of domestic manufacturers and the government, and the other used a simulation to demonstrate the problem.
1.4. Overview of the paper
This paper will quantitatively determine the effects of the EU’s tariffs on CEVs’ sales in the European market. Based on the microeconomics model of imposed tariffs with domestic supply, foreign supply, and domestic demand curves, I will analyze the effects of tariffs using line diagrams of a few European and Chinese EV manufacturers’ monthly sales and percentage falls in July’s sales after the tariff.
2. Literature review
In terms of tariffs imposed by a country or region on competitive imported goods, there was research before the incident introduced in 1.1 Background occurred.
2.1. Theoretical studies
There are papers that inquired into the tariffs’ effects theoretically. Fan et al. examine the consequences of a “spillover” of imported EVs in a country and propose the optimal subsidy and tariff policies for the government and pricing strategies of domestic and international EV manufacturers. Yang et al. examines the development of the EV market in a country under government support. By establishing a duopoly model of a domestic and international EV firm, the study covers how tariffs protect the domestic firm from the more competitive international one–in other words, how tariffs can control or even suppress the international manufacturer’s share in the domestic market so the playing ground is leveled. The findings of both studies above are general and may apply to any region or country facing EV spillovers. However, the models might be simplified compared to real-life cases, including the EU-China case in this paper. For instance, the duopoly model in Yang et al.’s study does not reflect the European EV market with multiple international manufacturers already, so a generic tariff policy might not be suitable for each of them. Building on the theoretical findings, this paper will offer a realistic perspective on the impact of tariffs–it will fill a gap in the numerous studies based on cases.
2.2. Case studies
In addition to theoretical understandings, we have papers studying other real-life cases. Based on the case of Donald Trump’s tariffs on Chinese imports, Rosyadi et al. [14] analyze these tariffs’ possible impacts on the global and Chinese economies. This is a precedent of how trade deficits in one of China’s exporting countries could lead to tariffs, providing insight into its negative effects on the terms of trade, global productivity, and social welfare. However, this case that occurred in Europe with EVs is a recent incident yet to be discussed. Overall, the research on a region or country’s tariff policies and their effects on imported EVs is lacking.
Also, this paper includes the recently updated values of the EU’s tariffs, which were not yet known to the authors of previous papers during writing. Coffin et al.[12], a working paper published in March, ran a computable general equilibrium (CGE) analysis on the effect of tariffs imposed by all other regions, including Europe, on Chinese EV and EV part exports. The authors had information on the EU’s anti-subsidy investigation then but not the verdict of it–the value of tariffs.
As presented above, no existing literature of case studies has investigated the impact of a specific region’s tariffs on imported EVs’ sales with the most up-to-date tariff data. This paper fills this gap through a graphed supply-and-demand curve system that I will introduce in the following section.
3. Conceptual framework
3.1. The supply-and-demand model of international trade
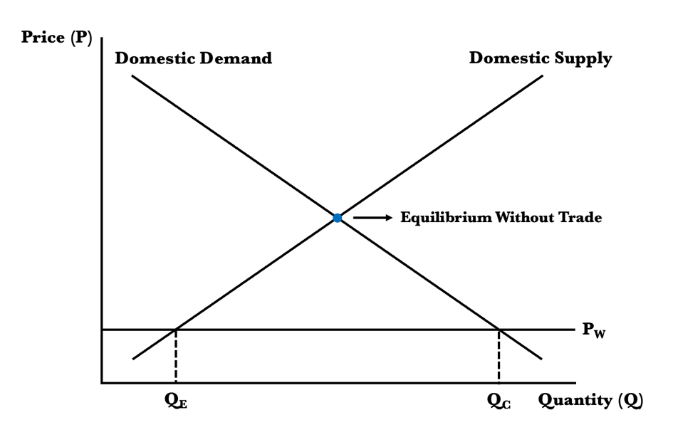
The conceptual framework used is a supply-and-demand curve model that is commonly used in microeconomics analysis of international trade, as shown in Figure 1.
The model shows the supply and demand curve of a domestic or regional market, and in our case, the European EV market. In this market, the domestic price of a certain good is higher than the world price–the price of the good in the global market, leading to imports of this good. After the import, domestic prices are lowered to world price, and the market leaves the equilibrium without trade: domestic suppliers–European EV manufacturers–satisfy all the domestic demand. In the new state, domestic consumers are going to have a higher demand for EVs according to the law of demand. Domestic suppliers are not willing to produce as much because they get paid less for doing so. The gap created between increased demand and decreased domestic supply will be filled by international EV manufacturers, and theoretically, the country could import as many EVs as it wishes at world price. Nonetheless, bear in mind that because international manufacturers also include those from countries other than China, I will re-construct the market with only Europe and this exporting country I am focusing on.
3.2. Adding the tariff to the model
After adding the tariff to the model, we can connect this independent variable to sales: the existence of a tariff will lower CEVs’ sales in Europe, and the higher the tariff, the lower the share. Below is the graphical and textual description.
Now, the country/region’s government imposed a tariff on international EVs, meaning the equilibrium price now is higher than world price. The changes are shown in Figure 2.
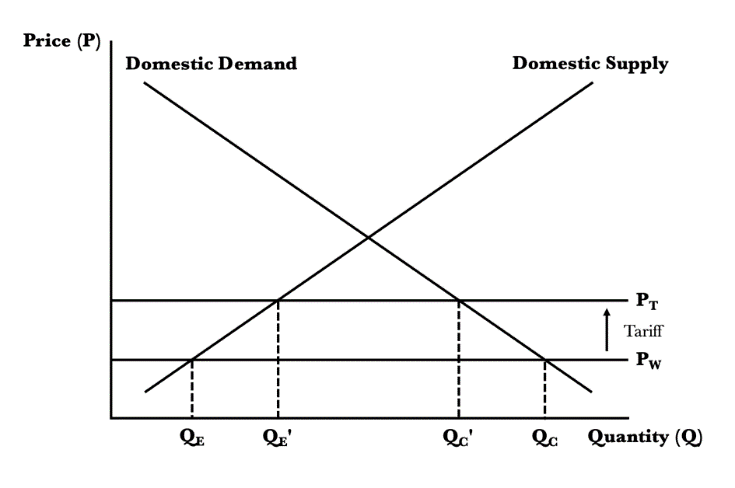
Responding to the increased market price of EVs, domestic suppliers are going to produce more, while consumers are going to demand less. This means that the “gap” between domestic supply and demand shrank, leaving less share for international manufacturers in the market.
To make future references more convenient, I will use notations: the amount of domestic supply, or the number of European EVs sold, is QE; the amount of CEV supply, or the number of CEVs sold, is QC; EVs’ market price is PW. After the tariff, QEbecomes QEs’, QCbecomes QC’, and EVs’ market price becomes PT.
My quantitative analysis will be based on this conceptual framework. This framework indicates how the variables of tariffs and CEV sales are connected, giving us our hypothesis that the EU’s Tariffs on CEVs will lower their sales in Europe.
4. Data
4.1. Motivation of data
To prove our hypothesis quantitatively, and by using QE as the control group, we should see how QC, the experiment group, is affected by the EU’s tariff. Hence, I will use a dataset of EV brands’ monthly sales in Europe to provide empirical evidence. Although using the market share data could also be a feasible approach, since it is calculated by the fraction
4.2. Line diagrams of sales
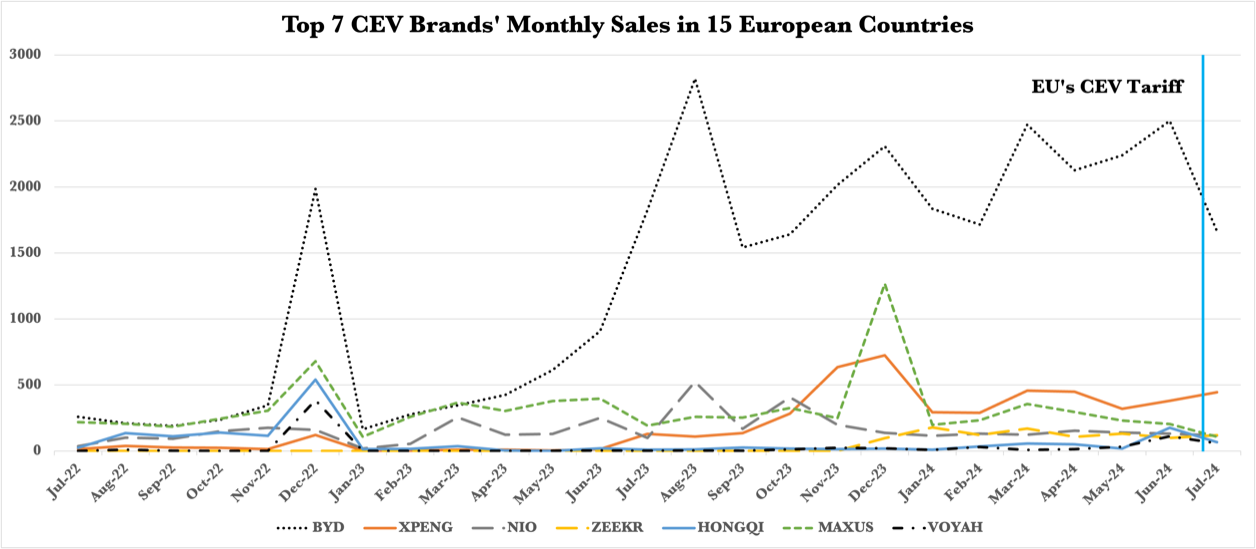
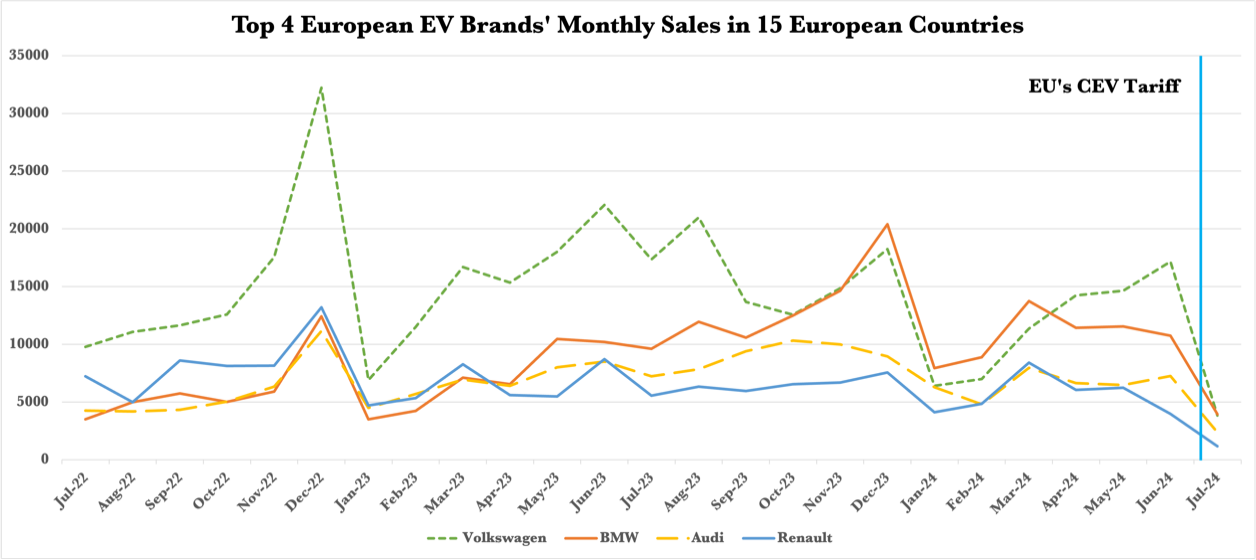
The line diagrams exhibited below in 6.1 show the top European and Chinese EVs’ sales in 15 European countries (Norway, Switzerland, Austria, France, Belgium, Ireland, The United Kingdom, The Netherlands, Spain, Sweden, Denmark, Germany, Italy, Finland, and Portugal). The data source is EU-EVs, a website collecting data on EV sales from the countries’ national agency websites, except for that of France and Belgium, whose data are obtained from multiple sources.
The data ranges from July 2022 to July 2024. However, to the date of completing this paper, July 2024 has not ended yet. The data for this month is going to be incomplete. Though the tariff is since 2024/7/5, there is no data for the month starting 7/5 yet, so for now, July 2024 will be used for comparison with the other months included. A more ideal dataset will be available after 2024/8/5.
4.3. Tariff values
Tariff valuesx (Data Source: European Commission):
• BYD 17.4% (Sampled in investigation)
• Geely 19.9% (Sampled in investigation)
• SAIC Motors 37.6% (Sampled in investigation)
• Unsampled investigated manufacturers: 20.8% weighted average
• Non-cooperating manufacturers: 37.6%
5. Methods
5.1. Approach
To determine how much each CEV brand is affected by different values of tariff imposed and to set European EV brands as a baseline, I will analyze the trend quantitatively after the tariff, combining the conceptual framework of domestic supply-and-demand with tariff, as mentioned in 3.2. I will not calculate the market share. By labeling the tariff value, average prices of the brand’s all on-sale vehicles, and sales data (quantity) of CEV and European EV manufacturers, I hope to find out if a higher tariff for CEVs will be more influential on their sales, or that the variable remains insignificant.
6. Results
6.1. Analysis of line diagram
There may not be a causal relationship between the tariff and CEVs’ sales. From the line diagrams (Figure 3 and Figure 4), the sales of both the European and CEVs are fluctuating regularly–usually increases in sales are followed by decreases. Even though CEVs’ sales dropped after the EU’s tariff, it might just be due to the ups and downs the market regularly experiences–the sales of European EVs also dropped, so the drop in CEV sales cannot simply be attributed to the tariff. It might be that the effect of tariffs is eclipsed by that of the cycle.
Data Source: EU-EVs
Data Source: EU-EVs
6.2. Percentage analysis
Although the results might not be significant in the graph, let us see if numerical analysis shows some difference between the drop in European EVs’ sales and CEVs’ sales. Here is a table of the percentage drop in sales in July 2024, which is after the previous month June 2024.
|
Brand |
Sales June 2024 |
Sales July 2024 |
Percentage Drop |
|
Volkswagen |
17171 |
3824 |
77.73% |
|
BMW |
10740 |
3952 |
63.20% |
|
Audi |
7255 |
2368 |
67.36% |
|
Renault |
3980 |
1158 |
70.90% |
|
Brand |
Sales June 2024 |
Sales July 2024 |
Percentage Drop |
|
BYD |
2499 |
1665 |
33.37% |
|
XPeng |
380 |
444 |
-16.84% |
|
Nio |
131 |
116 |
11.45% |
|
Zeekr |
99 |
120 |
-21.21% |
|
Hongqi |
176 |
67 |
61.93% |
|
Maxus |
203 |
107 |
47.29% |
|
Voyah |
110 |
59 |
46.36% |
6.3. Overall analysis
Surprisingly, after comparing the percentage drop, we see that CEVs’ sales’ percentage drops are even lower than that of European EVs–the maximum percentage drop in CEVs, Hongqi’s 61.93%, is lower than the minimum drop in European EVs, which is BMW’s 63.20%. XPeng and Zeekr even experienced anomalous increases in sales after the tariff.
Hence, after the graphical and numeral analysis of sales data, the results do not prove the hypothesis. Quite the opposite, the percentages seem to contradict with the conceptual framework, especially with the presence of two anomalies, XPeng and Zeekr.
The contradiction could suggest that the regular fluctuations in the market (observed in Figures 3 and 4) are so strong that the effect of tariffs in the market cannot be reflected.
7. Conclusion
7.1. Summary
Due to the efforts to control carbon emissions, EVs are gaining popularity and demand quickly around the globe. This means that their markets are becoming profitable and significant. As an active forerunner and advanced manufacturing country of EVs, China is gaining world dominance in the global EV market and aiming to grow in strategically important regions, and one of it is Europe. Hence, this paper investigates the effect of the EU’s tariffs on the CEVs’ development in the European market, with the sales being a reflection of those brands’ situations in the market. Using the supply-and-demand model of international trade with tariff, a model that is common in the microeconomics of international trade, as the conceptual framework, I draw the hypothesis that the tariff will curtail CEVs’ market performance in Europe. To numerically prove it, I drew line diagrams for the monthly sales of some CEV and domestic brands and constructed a table for the percentage drop in sales between June 2024 and July 2024. However, the results seem to be the opposite of the hypothesis: both European EVs and CEVs saw a drop in sales in July 2024, probably due to the cycle in the European market, and CEV sales actually dropped less than that of domestic EVs.
7.2. Limitations & implications
The paper does not isolate the effect of tariffs on sales. It does not have enough control over confounding variables. The cycle of increasing and decreasing sales in the European EV market might be the most significant of them all, important enough to cover the tariffs’ influences, making the results insignificant. Future research may possibly find a general pattern in the European EV market, so the tariffs’ effects could be isolated once the drops in sales exceed the normal pattern.
The tariffs imposed on imported EVs from China is just one aspect of the trade “wars” between China and Europe and perhaps other major economic entities. This fully reflects China’s robust economy that is still growing and its leading power in the EV industry. Tariffs may affect CEVs’ sales in Europe, but probably not for long, because the products of CEV manufacturers are going to prove themselves over time.
References
[1]. Edenhofer, Ottmar, et al., eds. Renewable energy sources and climate change mitigation: Special report of the intergovernmental panel on climate change. Cambridge University Press, 2011.
[2]. Ritchie, Hannah. “Cars, Planes, Trains: Where Do CO2 Emissions from Transport Come From?” Our World in Data, 6 Oct. 2020, ourworldindata.org/co2-emissions-from-transport.
[3]. IEA, International Energy Agency. "World energy outlook 2012." Int. Energy Agency 666 (2012).
[4]. IEA, International Energy Agency. “Global EV Outlook 2023–Analysis.” IEA, 2023.
[5]. Richter, Felix. “Infographic: The World’s Largest EV Markets.” Statista Daily Data, 25 Sept. 2023, www.statista.com/chart/30898/countries-with-the-largest-electric-car-fleets/.
[6]. “Infographic: Chinese Car Exports Continue to Soar as EV Share Grows.” Statista Daily Data, 3 Apr. 2024, www.statista.com/chart/32019/automobile-exports-from-china/.
[7]. The Impact of Changes in Trade Policies on the Electric Vehicle (EV) Sector: A CGE Analysis. US International Trade Commission, 2024.
[8]. IEA. “Trends in Electric Cars – Global EV Outlook 2024 – Analysis.” IEA, 2024, www.iea.org/reports/global-ev-outlook-2024/trends-in-electric-cars.
[9]. EU Anti-Subsidy Probe into Electric Vehicle Imports from China. European Parliament.
[10]. Brinza, Andreea, et al. EU-China Relations: De-Risking or De-Coupling–the Future of the EU Strategy towards China. 2024.
[11]. “Commission Imposes Provisional Countervailing Duties on Imports of Battery Electric Vehicles from China While Discussions with China Continue.” European Commission - European Commission, ec.europa.eu/commission/presscorner/detail/en/ip_24_3630.
[12]. Fan, Zhi-Ping, et al. “Pricing Strategies of Domestic and Imported Electric Vehicle Manufacturers and the Design of Government Subsidy and Tariff Policies.” Transportation Research Part E: Logistics and Transportation Review, vol. 143, Nov. 2020, p. 102093, https: //doi.org/10.1016/j.tre.2020.102093.
[13]. Coffin, David, et al. The Impact of Changes in Trade Policies on the Electric Vehicle (EV) Sector: A CGE Analysis. US International Trade Commission, 2024.
[14]. Rosyadi, Saiful Alim, and Tri Widodo. “Impact of Donald Trump’s Tariff Increase against Chinese Imports on Global Economy: Global Trade Analysis Project (GTAP) Model.” Journal of Chinese Economic and Business Studies, vol. 16, no. 2, Feb. 2018, pp. 125–145, https: //doi.org/10.1080/14765284.2018.1427930.
Cite this article
Chen,B. (2025). How Much Will the Eu’s Tariffs on Chinese Evs Affect Their Sales in Europe?. Advances in Economics, Management and Political Sciences,202,216-224.
Data availability
The datasets used and/or analyzed during the current study will be available from the authors upon reasonable request.
Disclaimer/Publisher's Note
The statements, opinions and data contained in all publications are solely those of the individual author(s) and contributor(s) and not of EWA Publishing and/or the editor(s). EWA Publishing and/or the editor(s) disclaim responsibility for any injury to people or property resulting from any ideas, methods, instructions or products referred to in the content.
About volume
Volume title: Proceedings of the 3rd International Conference on Financial Technology and Business Analysis
© 2024 by the author(s). Licensee EWA Publishing, Oxford, UK. This article is an open access article distributed under the terms and
conditions of the Creative Commons Attribution (CC BY) license. Authors who
publish this series agree to the following terms:
1. Authors retain copyright and grant the series right of first publication with the work simultaneously licensed under a Creative Commons
Attribution License that allows others to share the work with an acknowledgment of the work's authorship and initial publication in this
series.
2. Authors are able to enter into separate, additional contractual arrangements for the non-exclusive distribution of the series's published
version of the work (e.g., post it to an institutional repository or publish it in a book), with an acknowledgment of its initial
publication in this series.
3. Authors are permitted and encouraged to post their work online (e.g., in institutional repositories or on their website) prior to and
during the submission process, as it can lead to productive exchanges, as well as earlier and greater citation of published work (See
Open access policy for details).
References
[1]. Edenhofer, Ottmar, et al., eds. Renewable energy sources and climate change mitigation: Special report of the intergovernmental panel on climate change. Cambridge University Press, 2011.
[2]. Ritchie, Hannah. “Cars, Planes, Trains: Where Do CO2 Emissions from Transport Come From?” Our World in Data, 6 Oct. 2020, ourworldindata.org/co2-emissions-from-transport.
[3]. IEA, International Energy Agency. "World energy outlook 2012." Int. Energy Agency 666 (2012).
[4]. IEA, International Energy Agency. “Global EV Outlook 2023–Analysis.” IEA, 2023.
[5]. Richter, Felix. “Infographic: The World’s Largest EV Markets.” Statista Daily Data, 25 Sept. 2023, www.statista.com/chart/30898/countries-with-the-largest-electric-car-fleets/.
[6]. “Infographic: Chinese Car Exports Continue to Soar as EV Share Grows.” Statista Daily Data, 3 Apr. 2024, www.statista.com/chart/32019/automobile-exports-from-china/.
[7]. The Impact of Changes in Trade Policies on the Electric Vehicle (EV) Sector: A CGE Analysis. US International Trade Commission, 2024.
[8]. IEA. “Trends in Electric Cars – Global EV Outlook 2024 – Analysis.” IEA, 2024, www.iea.org/reports/global-ev-outlook-2024/trends-in-electric-cars.
[9]. EU Anti-Subsidy Probe into Electric Vehicle Imports from China. European Parliament.
[10]. Brinza, Andreea, et al. EU-China Relations: De-Risking or De-Coupling–the Future of the EU Strategy towards China. 2024.
[11]. “Commission Imposes Provisional Countervailing Duties on Imports of Battery Electric Vehicles from China While Discussions with China Continue.” European Commission - European Commission, ec.europa.eu/commission/presscorner/detail/en/ip_24_3630.
[12]. Fan, Zhi-Ping, et al. “Pricing Strategies of Domestic and Imported Electric Vehicle Manufacturers and the Design of Government Subsidy and Tariff Policies.” Transportation Research Part E: Logistics and Transportation Review, vol. 143, Nov. 2020, p. 102093, https: //doi.org/10.1016/j.tre.2020.102093.
[13]. Coffin, David, et al. The Impact of Changes in Trade Policies on the Electric Vehicle (EV) Sector: A CGE Analysis. US International Trade Commission, 2024.
[14]. Rosyadi, Saiful Alim, and Tri Widodo. “Impact of Donald Trump’s Tariff Increase against Chinese Imports on Global Economy: Global Trade Analysis Project (GTAP) Model.” Journal of Chinese Economic and Business Studies, vol. 16, no. 2, Feb. 2018, pp. 125–145, https: //doi.org/10.1080/14765284.2018.1427930.