


1. Introduction
In recent years, the sharing economy has emerged as a transformative economic model, significantly impacting the hospitality industry. Airbnb is a leader in the sharing economy, an online platform that offers short-term rentals as an alternative to traditional hotel accommodations [1]. As one of the largest and most successful platforms in this space, Airbnb has revolutionized short-term rentals by offering unique lodging experiences to guests worldwide. Founded in 2007, Airbnb has rapidly expanded to cover over 220 countries and regions, with millions of hosts welcoming over 1.5 billion guest arrivals globally. This rapid growth underscores the importance of effective pricing strategies to sustain Airbnb's competitive edge and market share. Since its establishment in 2008, Airbnb has rapidly risen with its unique sharing economy model, greatly disrupting the traditional hotel industry. Airbnb not only captured market share but also forced hotels to lower prices and inspired the creation of more economy brands [2,3]. This study delves into the factors affecting Airbnb housing prices, aiming to assist hosts in optimizing their pricing strategies and enhancing property appeal, thereby increasing their profitability.
The research fully utilizes the data from the Airbnb platform, focusing on ten critical features: room type, accommodates, bathrooms, cancellation policy, cleaning fee, instant bookable, review scores rating, bedrooms, beds, and log price. Through employing EDA and linear regression methods, the study seeks to uncover the relationship between these variables and housing prices. The ultimate goal is to provide actionable insights for people who are looking to list their properties on the Airbnb website for rental to set competitive prices and for the Airbnb housing rental business to refine its pricing algorithms, and foster a more robust and competitive market environment.
2. Methods
2.1. Introduction to data
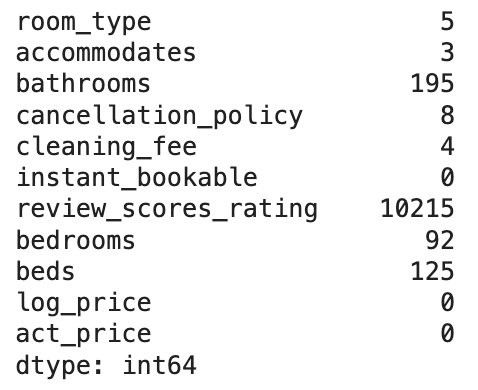
There are 11 columns and 74,111 samples included in this dataset, which contains 7 numerical columns including ID, accommodates, bathrooms, cancellation policy, review scores rating, bedrooms and beds, 2 categorical columns, room type and cancellation policy, and 2 Boolean columns, cleaning fee and instant bookable. Through differentiating the data in group discussion, we decided to first analyze the numerical data with the individual values less than 4 digits to complete the further study for this research and exclude the ID values in the worksheet. After checking the numerical data, it is found that there are missing values in accommodates, review scores rating, bedrooms and beds, which is shown as Figure 1 below. Therefore, the data is cleaned and proceeds to the following analysis.
2.2. Variable definitions and descriptive statistics analysis
The variable definitions and statistical results are shown in Table 1 and Table 2.
As shown in Figures 3 and 4, the original price distribution of Airbnb listings is skewed, requiring the use of the log transformation for the price variable (log price) to achieve a more normalized distribution.
The next analysis focuses on the following nine explanatory variables: accommodates, room type, bathrooms, cancellation policy, cleaning fee, instant bookable, review scores rating, bedrooms, and beds. The statistics for each variable are as follows:
Accommodates: The mean value is 3.526 with a standard deviation of 2.344. The minimum and maximum values are 1 and 16, respectively.
Bathrooms: The mean value is 1.305 with a standard deviation of 0.651.
Review Scores Rating: The mean value is 93.202 with a standard deviation of 8.382.
Bedrooms: The mean value is 1.363 with a standard deviation of 0.951. The minimum and maximum values are 0 and 10, respectively.
Beds: The mean value is 1.918 with a standard deviation of 1.384.
Log Price: The mean value is 4.866 with a standard deviation of 0.756.
These descriptive statistics provide a comprehensive overview of the continuous variables in the dataset, highlighting their central tendencies, variability, and distributional characteristics.
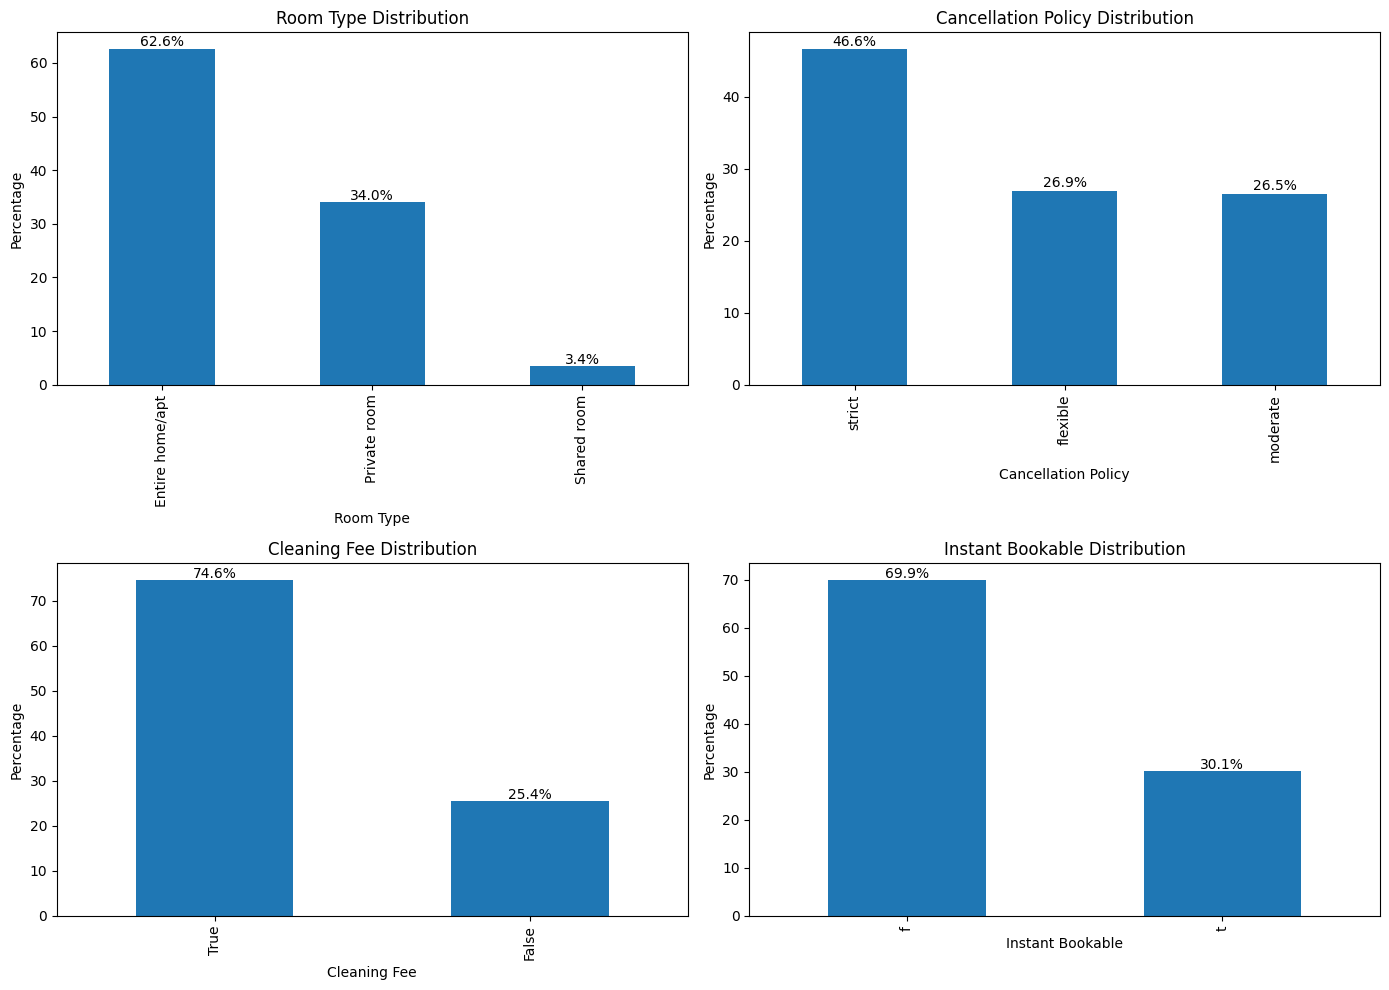
From Figure 2, we can see the frequency of categorical variables: The entire home/apt room type predominates, comprising 62.6% of the dataset, followed by private room at 34%, with the shared room being the least represented at 3.4%. Concerning cancellation policies, listings with a strict policy are the most prevalent, representing 46.6% of the data, thus exceeding those with moderate or flexible policies. In relation to cleaning fees, a substantial majority (74.6%) of the properties impose a cleaning fee. Regarding the distribution of instant bookable, the bar chart reveals that 69.9% of the properties are not available for instant booking and need confirmation from the hosts.
|
Variable |
Description |
|
id |
Property ID |
|
room_type |
Type of Room |
|
accommodates |
Maximum Occupancy |
|
bathrooms |
Number of Bathrooms |
|
cancellation_policy |
Cancellation Policy |
|
cleaning_fee |
Cleaning Fee Included |
|
instant_bookable |
Instant Booking Available |
|
review_scores_rating |
Review Rating Score |
|
bedrooms |
Number of Bedrooms |
|
beds |
Number of Beds |
|
log_price |
Log of Rental Price |
|
Variable |
Count |
Mean |
Std |
Min |
0.250 |
0.500 |
0.750 |
Max |
|
accommodates |
54114 |
3.526 |
2.344 |
1.000 |
2.000 |
3.000 |
4.000 |
16.000 |
|
bathrooms |
53922 |
1.305 |
0.651 |
0.000 |
1.000 |
1.000 |
1.500 |
8.000 |
|
review_scores_rating |
43902 |
93.202 |
8.382 |
20.000 |
90.000 |
95.000 |
99.000 |
100.000 |
|
bedrooms |
54025 |
1.363 |
0.951 |
0.000 |
1.000 |
1.000 |
2.000 |
10.000 |
|
beds |
53992 |
1.918 |
1.384 |
0.000 |
1.000 |
1.000 |
2.000 |
18.000 |
|
log_price |
54117 |
4.866 |
0.756 |
0.000 |
4.369 |
4.828 |
5.298 |
7.600 |
2.3. Exploratory Data Analysis (EDA)
Based on the histogram and the boxplot of the log prices, the diagram indicates that the majority of the log prices are concentrated between 3 and 7, corresponding to actual prices primarily ranging from 0 to 250, as observed in Figures 3 and 4.
Figure 5 is the correlation matrix of the numerical variables, which shows the pairwise relationship between multiple continuous variables through correlation coefficients. The color bar on the right represents the range of correlation values, from -1 to 1, and the darker the color, the stronger the correlation is.
From the heat map, it is observed that:
The data indicates that accommodates has the highest correlation with log price. The percentage is 56%. Furthermore, the strongest correlation is observed between accommodates and beds at 80%, followed by bedrooms, which has a 71% correlation with accommodates. It is also observed that review scores rating demonstrates the lowest correlation with accommodates the percentage of 13%. In the context of identifying the strongest correlations with log price, the results suggest that none of the variables display a markedly strong correlation since the highest correlation percentage is 56%, around half of the dataset.
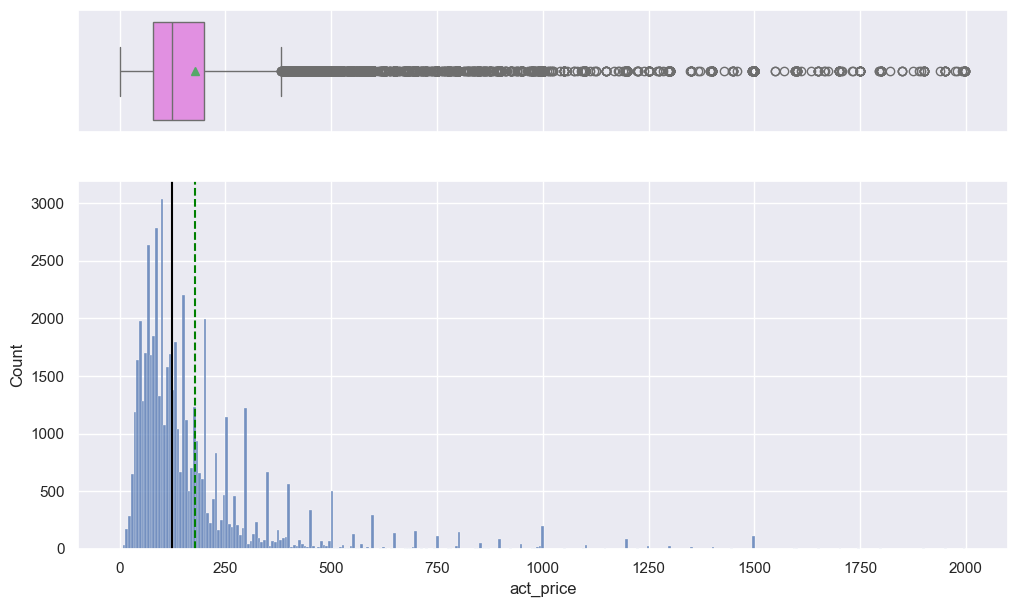
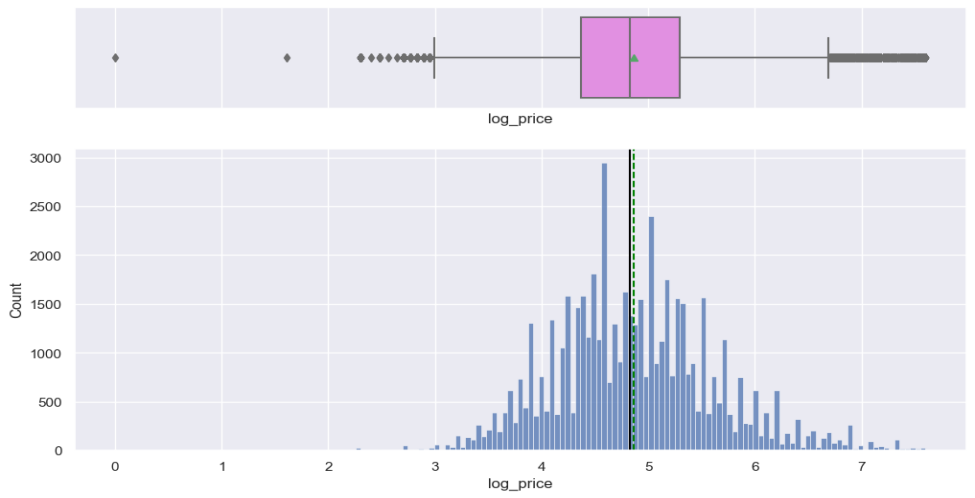
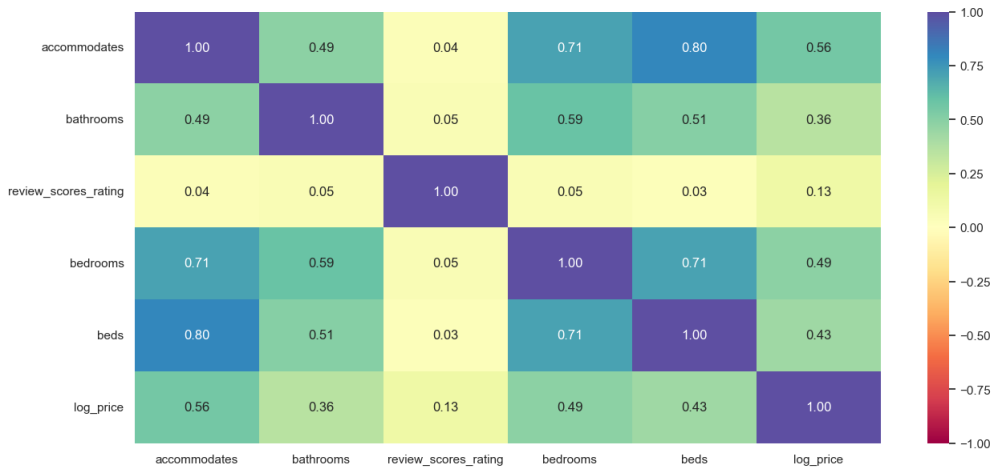
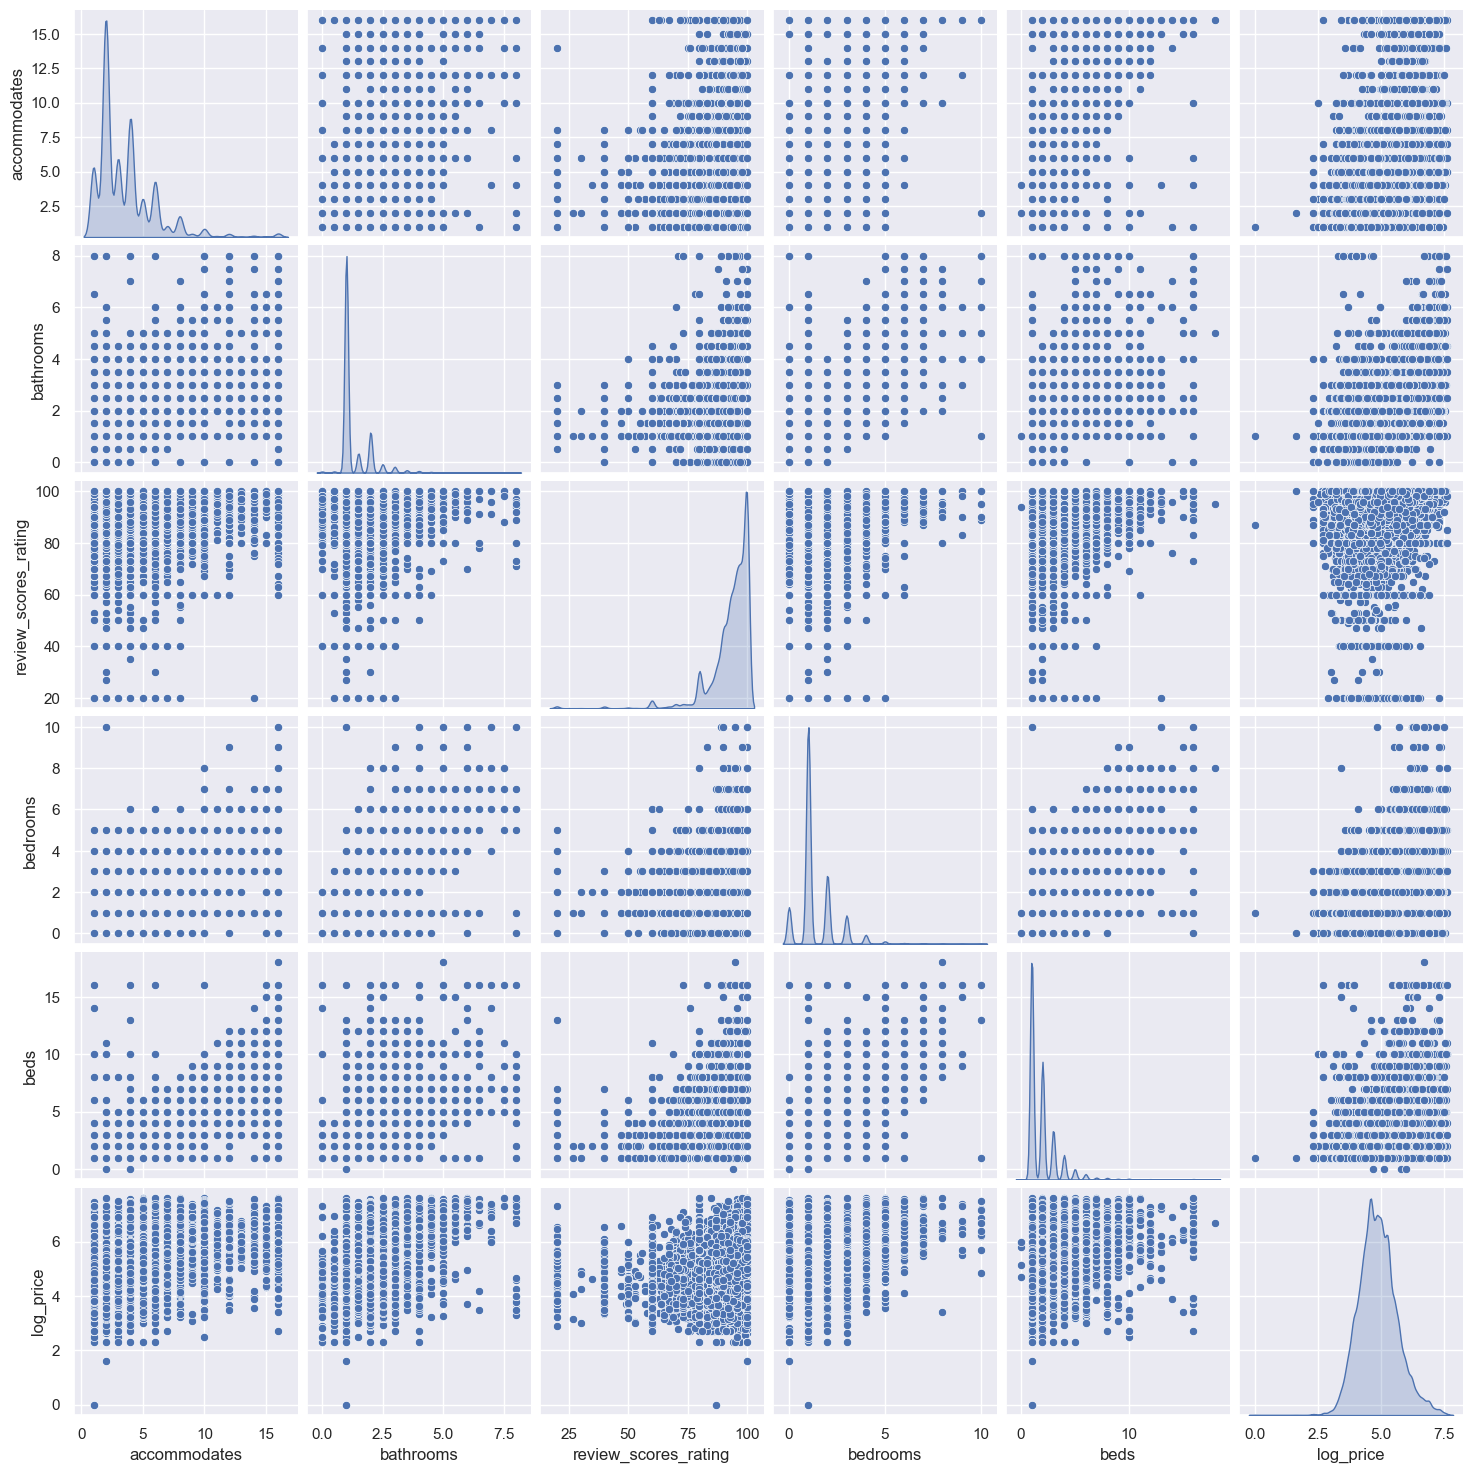
Figure 6 is a scatter plot matrix (Pair Plot) of pairwise variable relationship, illustrating the bivariate relationship between multiple continuous variables as well as the univariate distributions of each variable. This type of chart is commonly employed in exploratory data analysis (EDA) to intuitively grasp the relationship and the distribution of variables. The plots on the diagonal represent the univariate distribution of each variable. For instance, the distribution of accommodations indicates that most properties can accommodate 2 to 4 people, while bathrooms show that most properties have 1 or 1.5 bathrooms. The review scores rating reveals that most properties have high ratings, concentrated between 90 and 100.
The bivariate scatter plots exhibit some significant correlations: a positive correlation between accommodates and bathrooms, a positive correlation between review scores rating and log price, and a trend indicating a positive relationship between bedrooms and log price. Additionally, beds and log prices also demonstrate a positive correlation, though the rental price increase rate decelerates as the number of beds rises. Other correlations between the two variables shown in Figure 6, such as the dots representing bathrooms and review scores rating, are more dispersed.
From Figure 6, we can clearly discern various relationships between the variables: accommodates, bedrooms, and bathrooms are positively correlated with log price, and review scores rating is positively correlated with log price, while the relationship involving beds and other variables is more complex. These insights provide a crucial foundation for subsequent statistical analysis and model building.
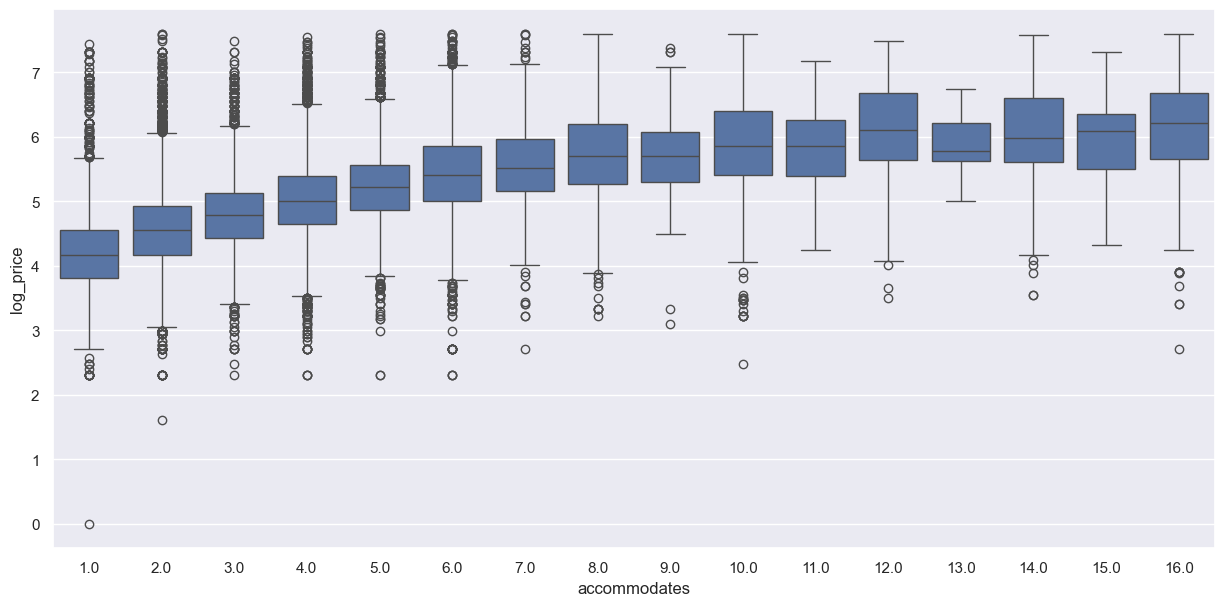
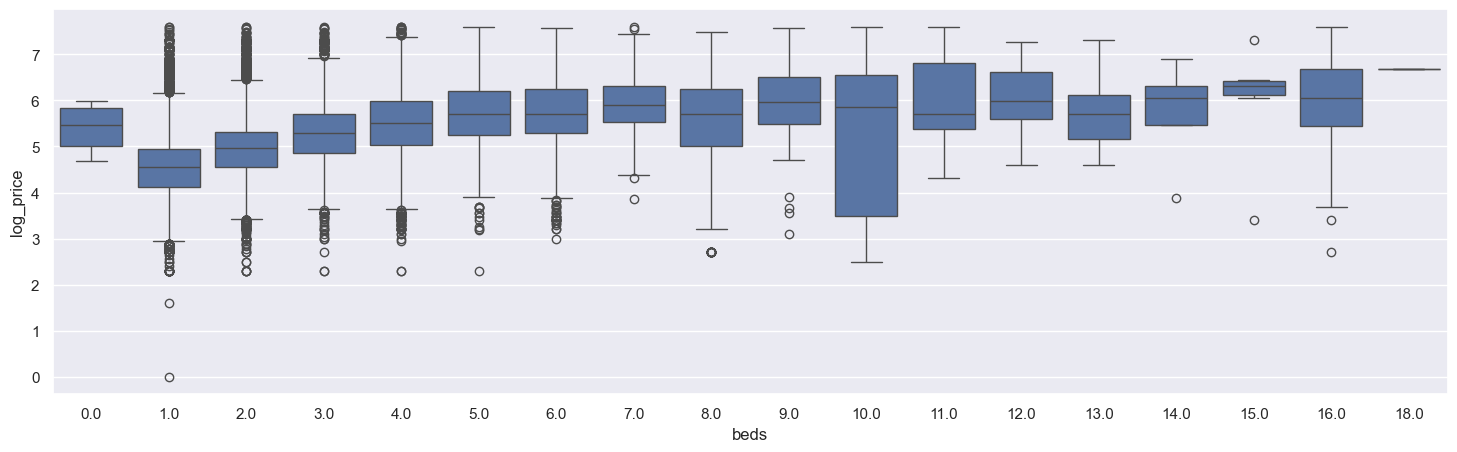
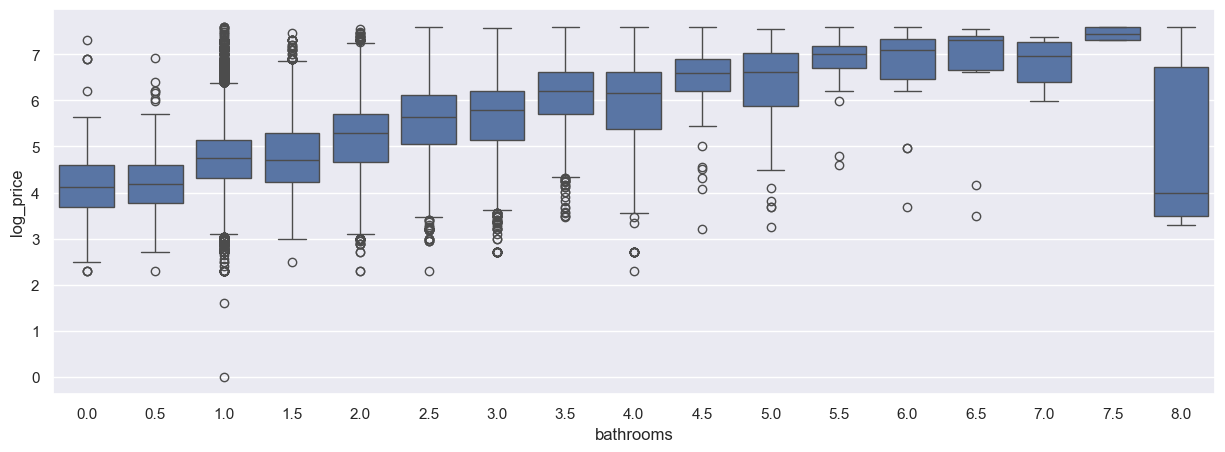
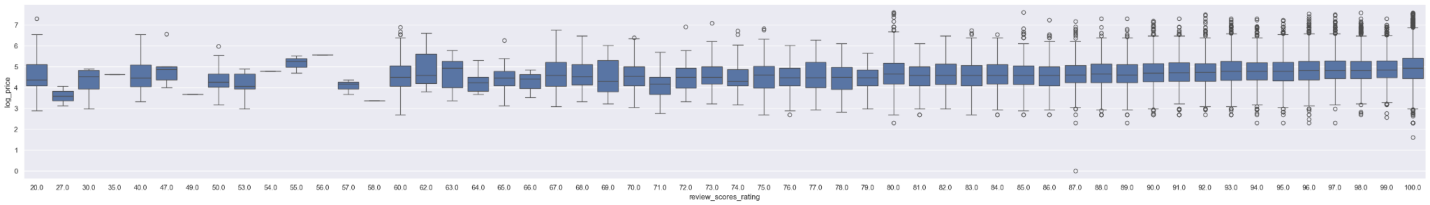
Figures 7 to 11 present box plots illustrating the relationships between accommodates, bedrooms, beds, bathrooms, and review scores rating with the log price.
Figure 37 illustrates the positive relationship between the number of people a property can accommodate and its corresponding log price. Notably, when the accommodation capacity ranges from 1 to 8 individuals, there is a substantial increase in the log price. Beyond an accommodation capacity of 8, the increase in log price becomes marginal, approaching a horizontal trend. This indicates that properties capable of hosting more occupants are generally priced higher, though the marginal effect diminishes after reaching a certain capacity.
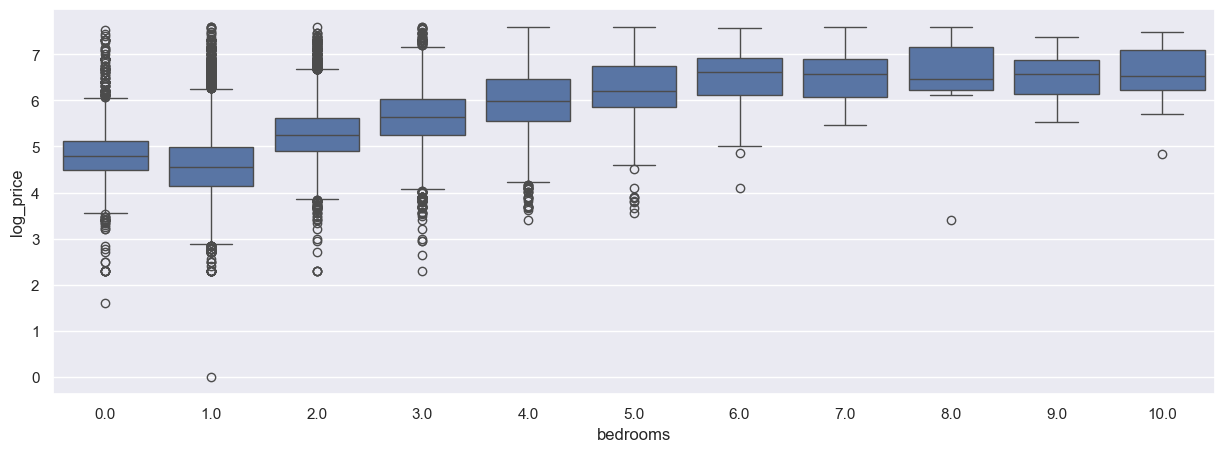
Figure 8 examines the correlation between the number of bedrooms and log_price. The data reveal a gradual increase in the log price as the number of bedrooms rises. Specifically, the most significant increase occurs as the number of bedrooms increases from 1 to 5. Beyond 5 bedrooms, the growth in log price tapers off, suggesting that additional bedrooms contribute less to price escalation. This trend indicates that properties with more bedrooms tend to be more expensive, but their influence on price diminishes after surpassing a certain threshold.
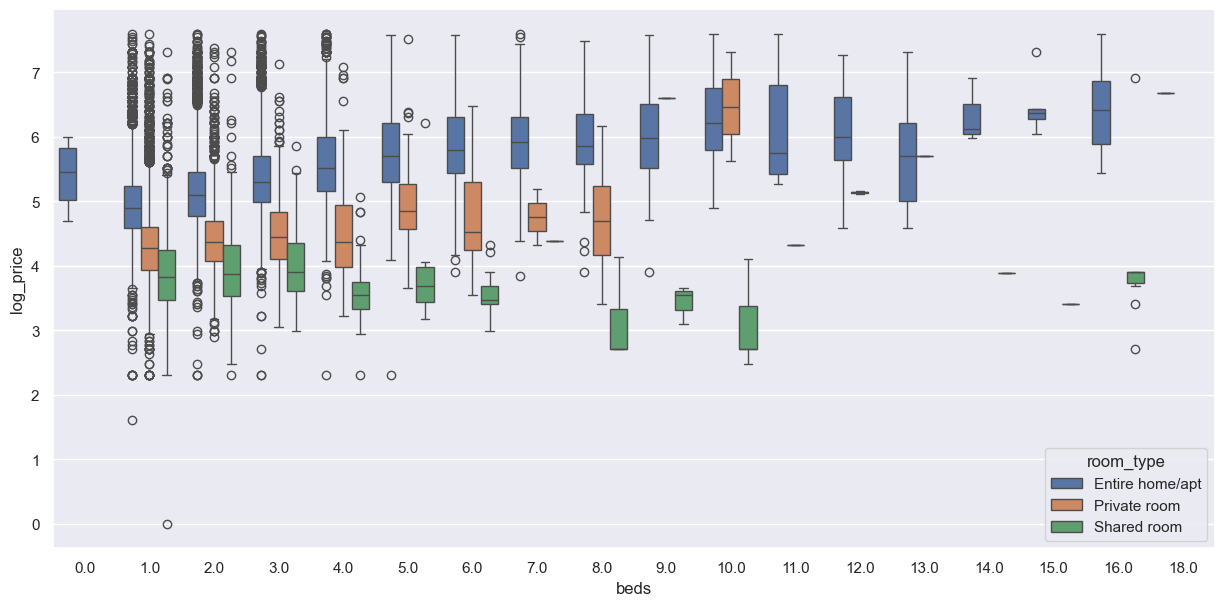
In Figure 9, the boxplot depicts the association between the number of beds and the log price. For properties with 1 to 7 beds, the log price tends to increase with the number of beds. However, for properties with 0 or more than 7 beds, the median log price exhibits fluctuations, indicating the minimal impact of bed count on price. Connecting the median points across bins reveals an almost horizontal line, further indicating that bed count has limited influence on pricing.
Figure 10 illustrates the relationship between the number of bathrooms and its corresponding log price, showing a positive correlation. As the number of bathrooms increases, the median of the log price also tends to rise. Properties with 0.5, 1, 2, and 2.5 bathrooms show higher variability in the log price, with wider interquartile ranges and numerous outliers. In contrast, properties with 7.5 and 8 bathrooms exhibit more consistent pricing and fewer outliers. Notable outliers are present across all categories, particularly in properties with 1 to 2.5 bathrooms, indicating a broader price range. High-end properties with more bathrooms (5.5, 6, 7.5, and 8) generally exhibit higher and more stable log prices, suggesting a more homogeneous buyer group in these segments.
Figure 11 explores the relationship between the review scores and the log price. The overall trend indicates that higher review scores correlate with higher log prices, although the correlation is less pronounced compared to other figures. Properties with review scores between 35 and 55 exhibit higher variability in log prices. As review scores increase, the variability stabilizes, especially for scores between 70 and 85. Outliers are present in most review score categories, with higher concentrations in the lower (30 to 50) and higher (90 to 100) score ranges. This suggests a wide range of pricing within these score brackets. Properties with higher review scores (85 and above) tend to have more stable and higher log prices, implying that the market may assign a premium to well-reviewed properties.
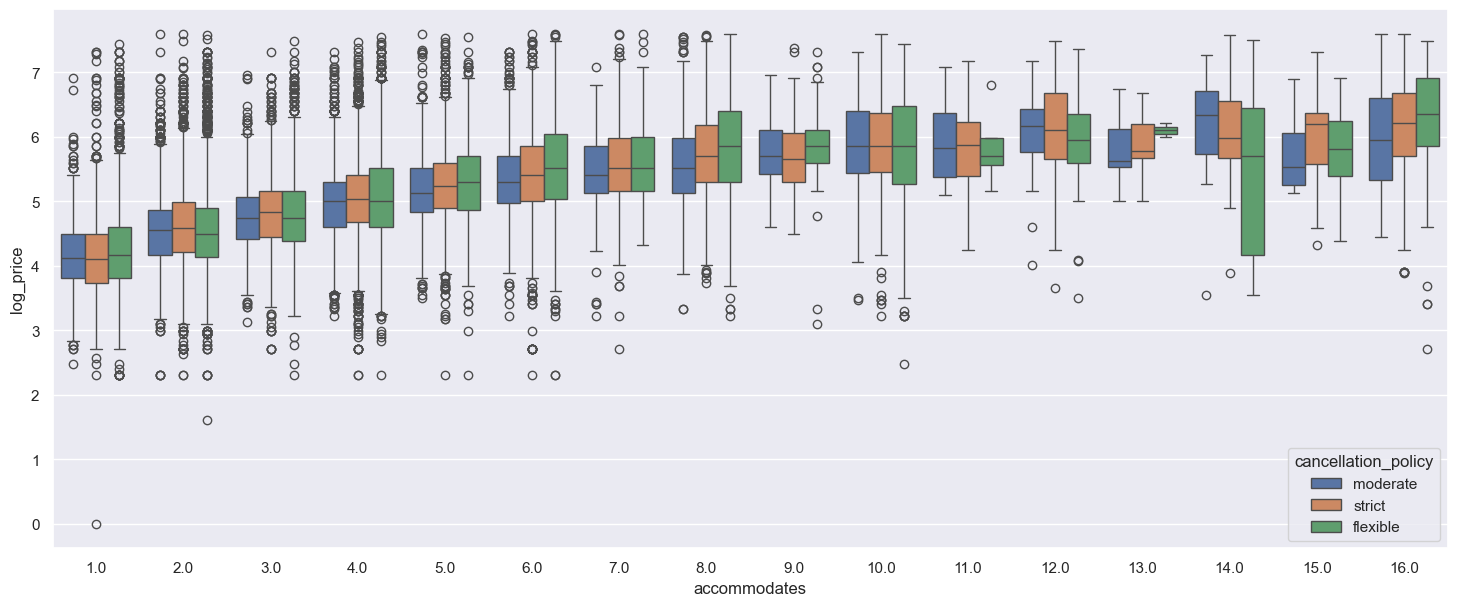
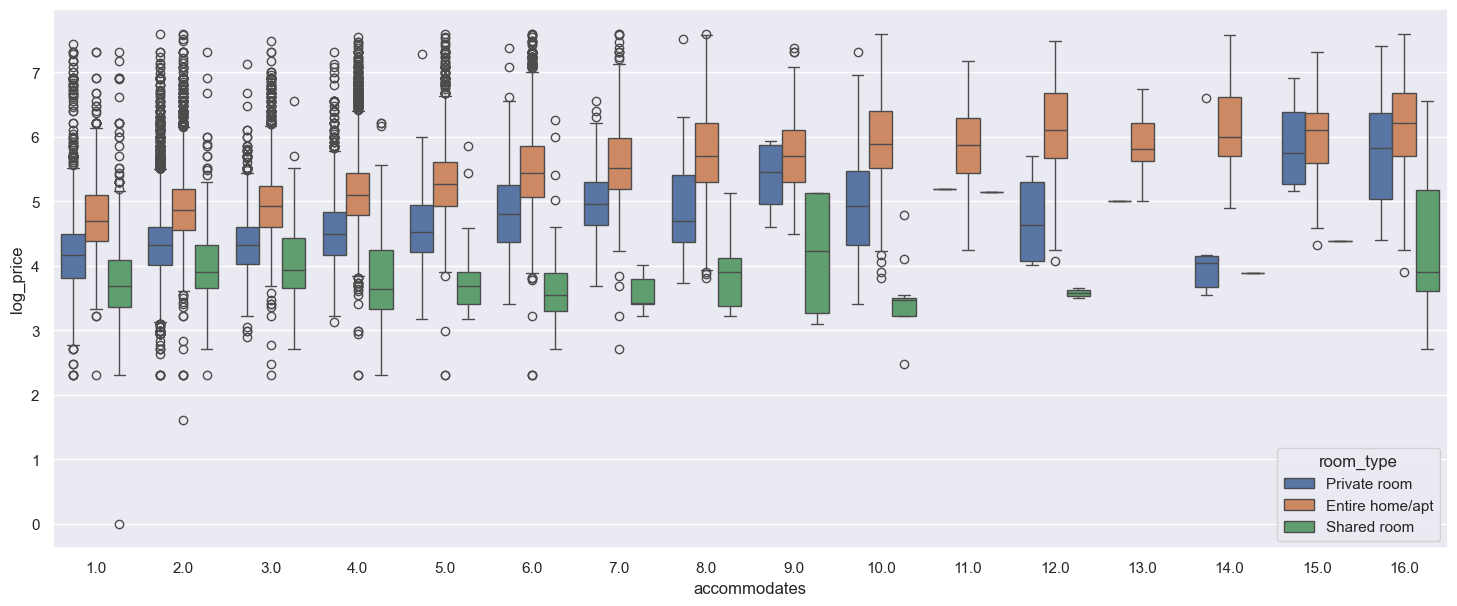
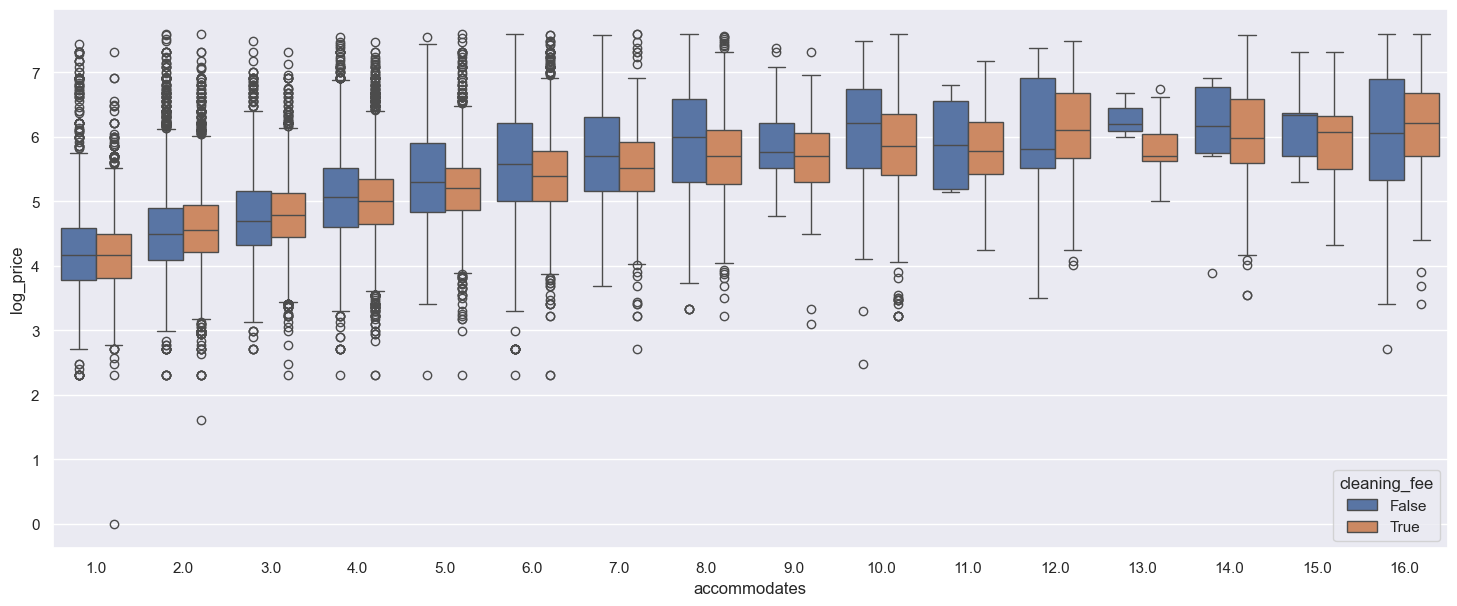
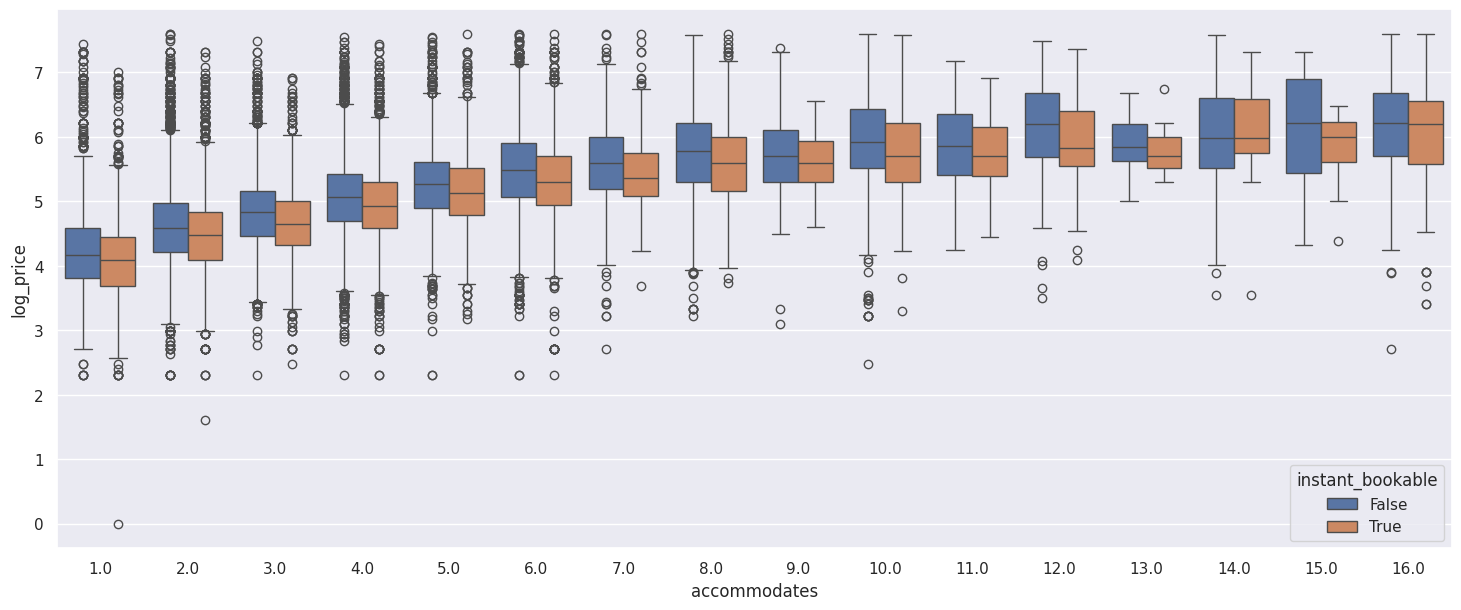
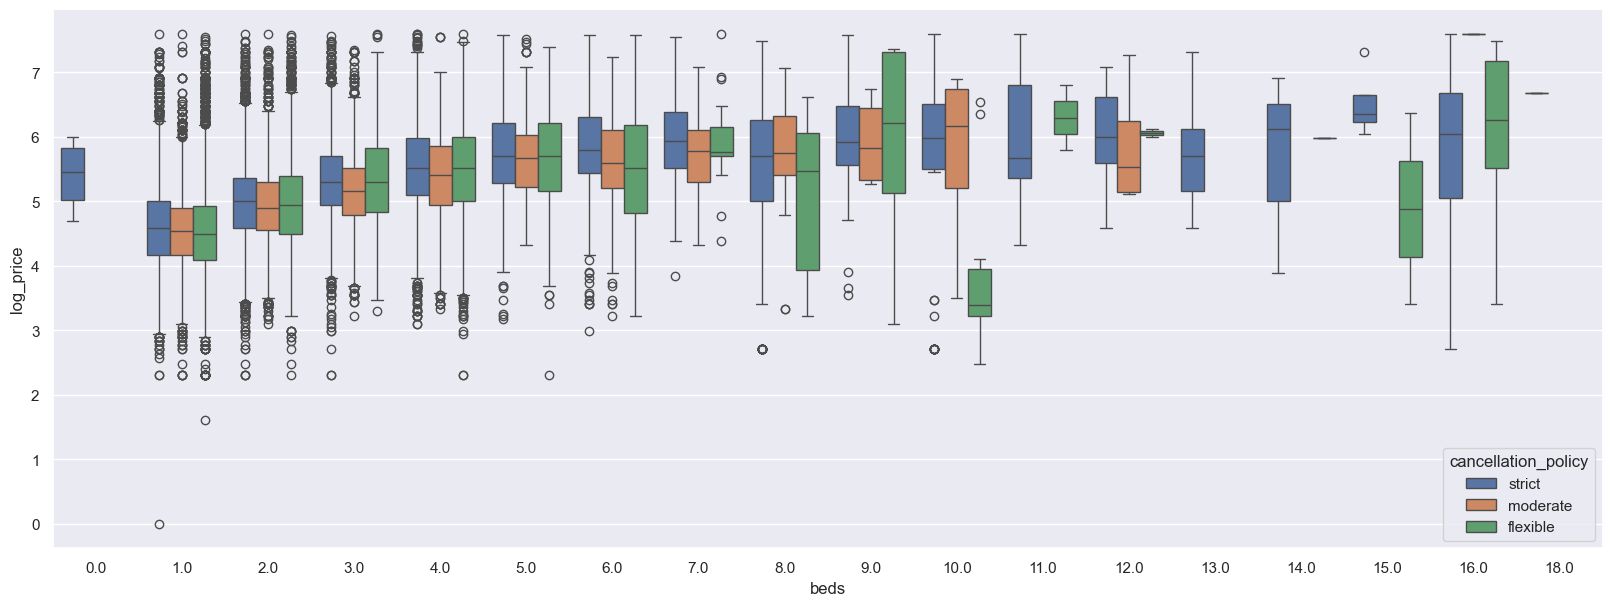
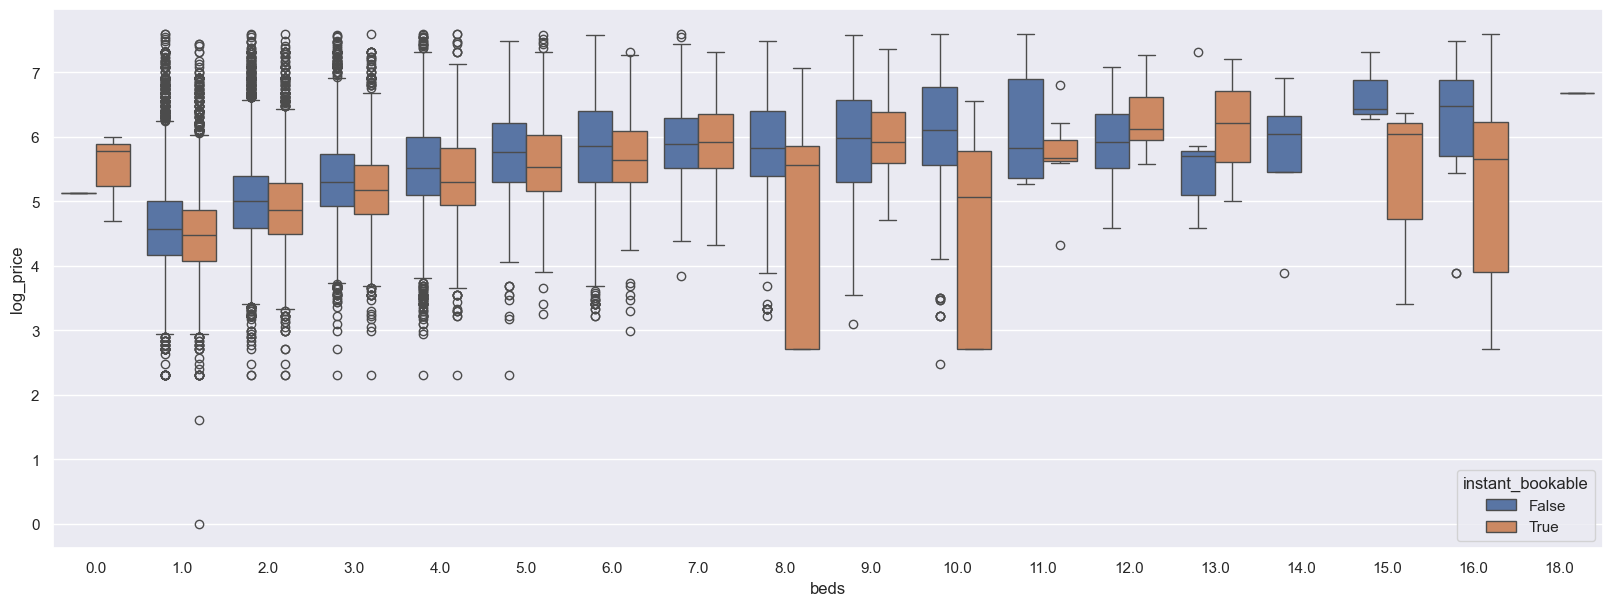
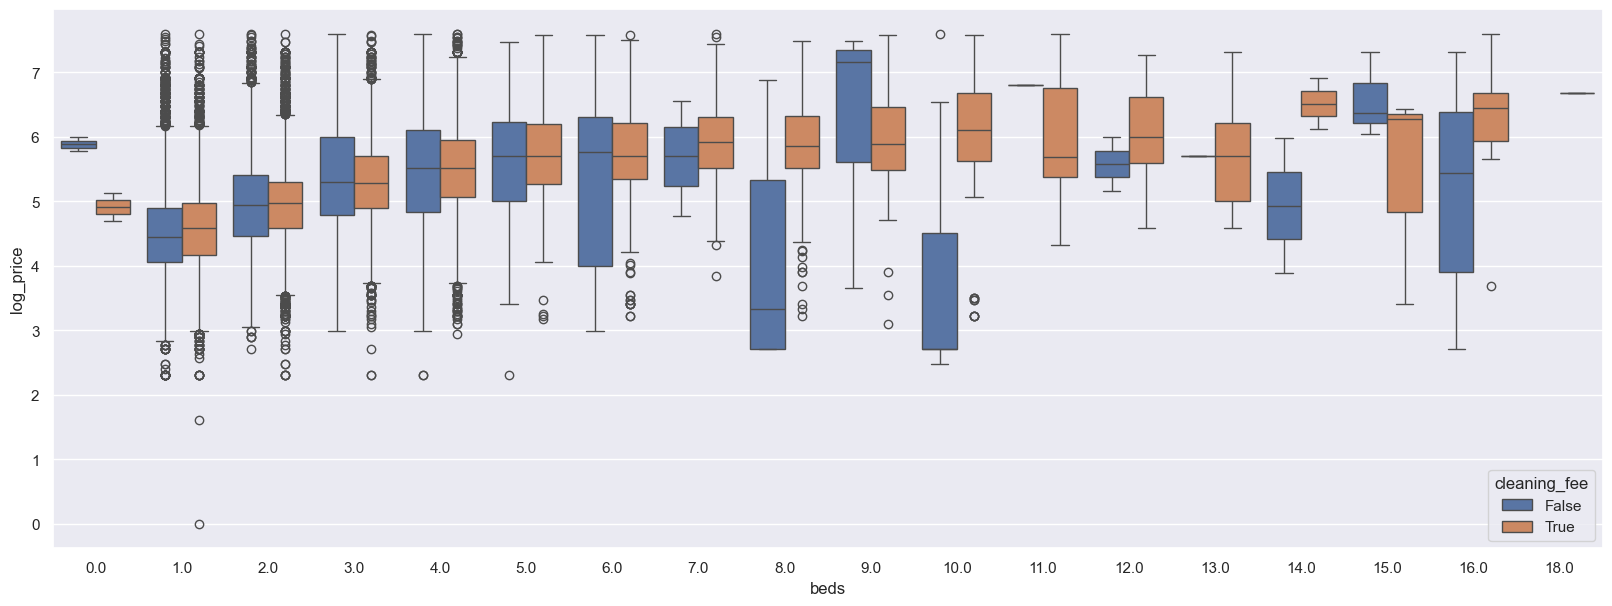
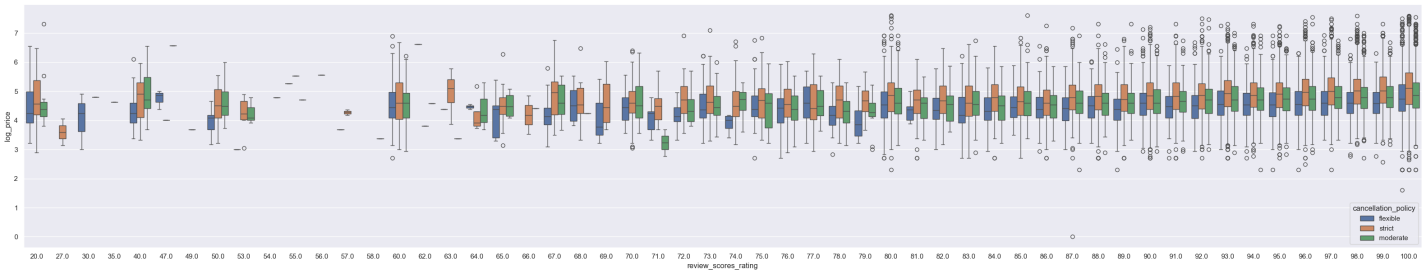
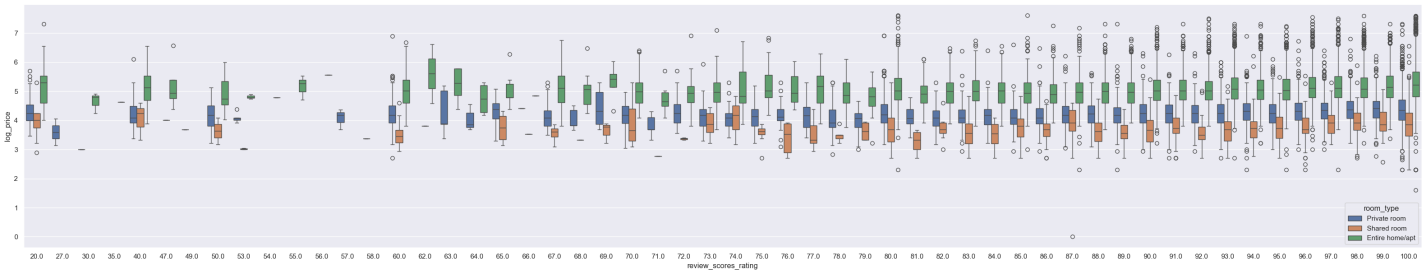
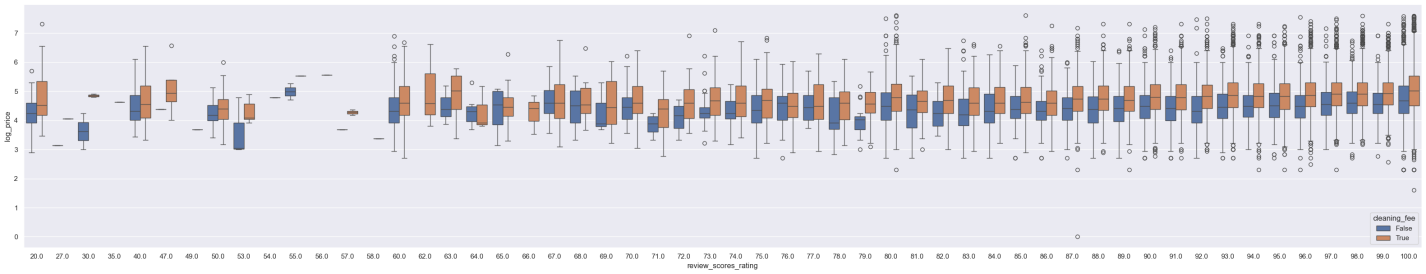
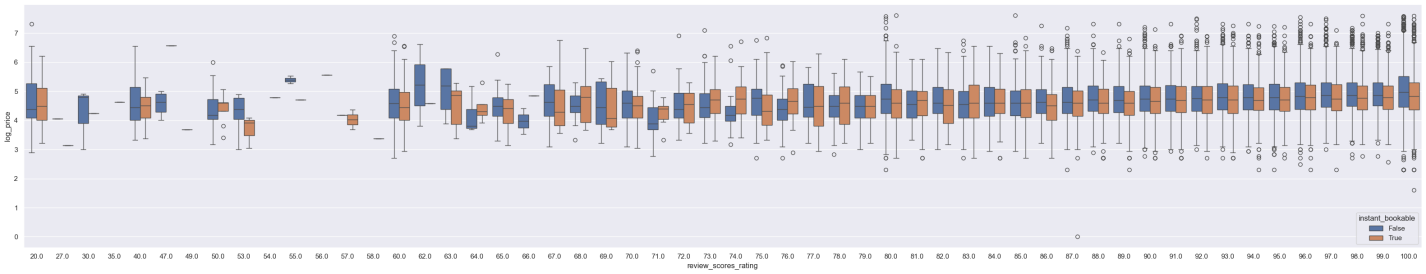
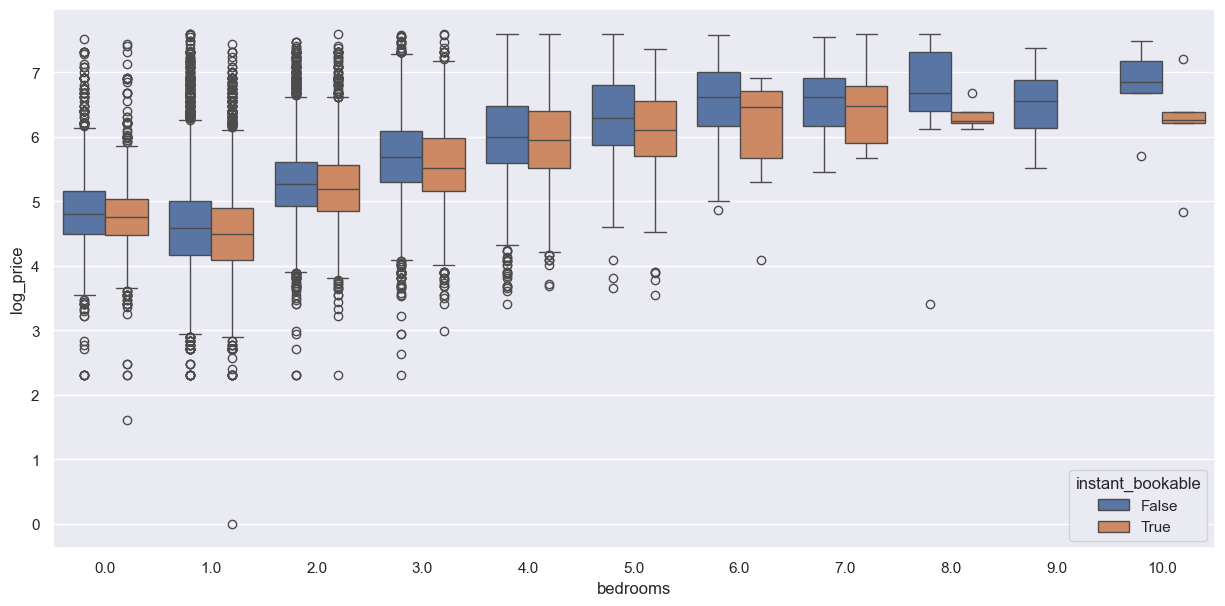
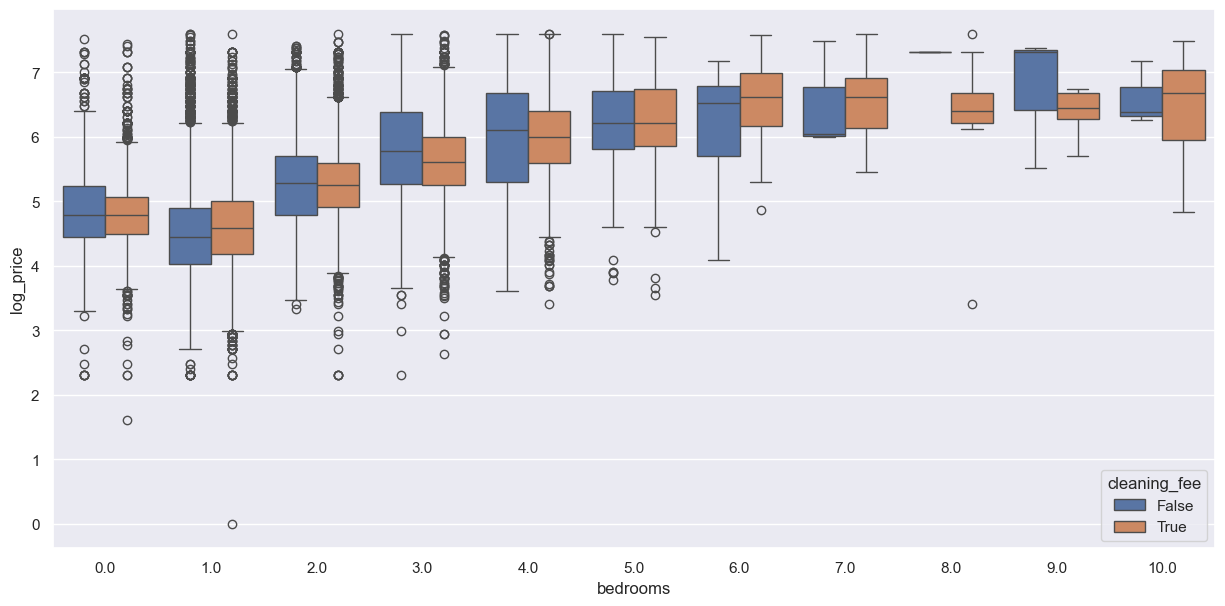
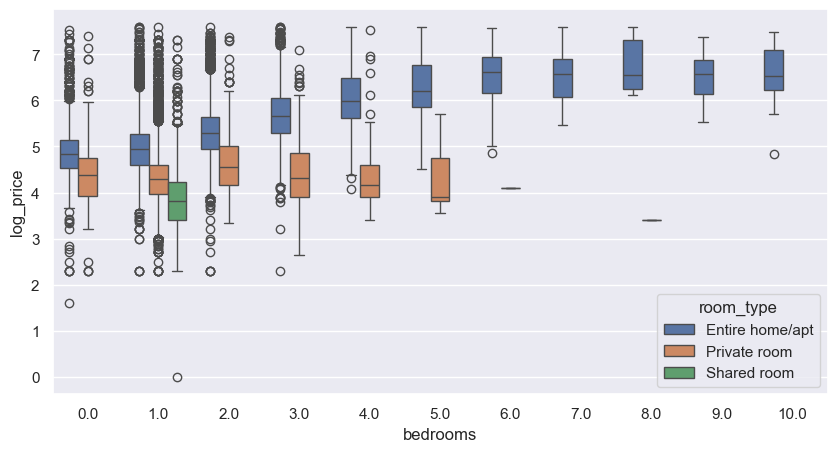
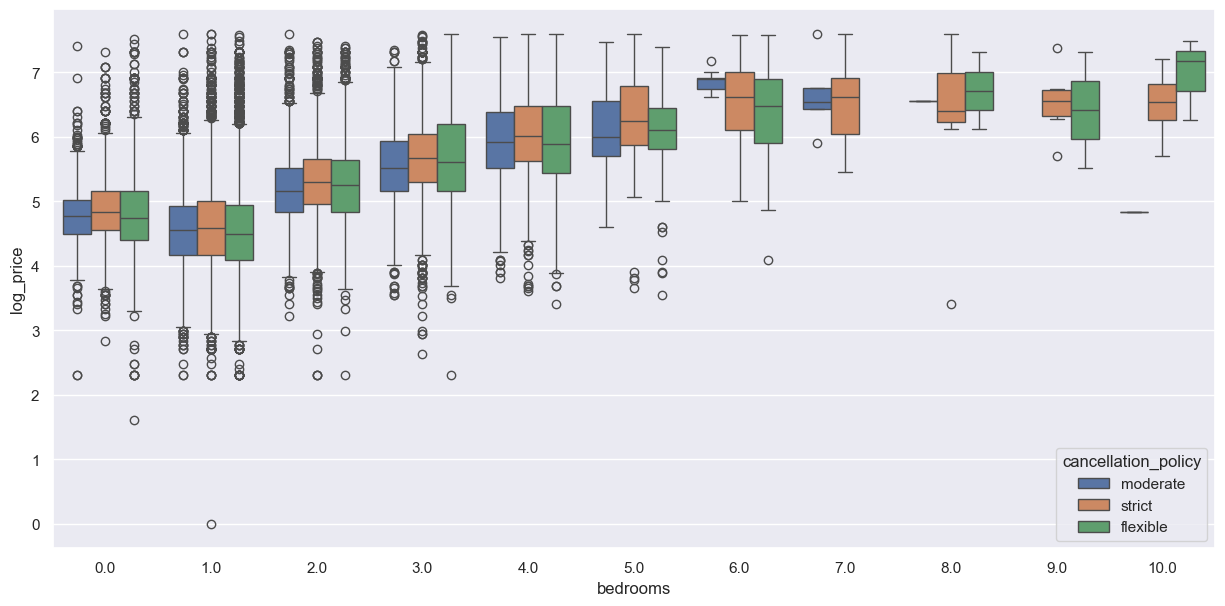
Figures 12 to 27 illustrate the relationships between accommodates, bedrooms, beds, bathrooms, review scores rating, and log price, with further analysis based on categorical variables such as cancellation policy, instant bookable, and cleaning fee. The findings reveal that accommodates is positively correlated with the log price. As the log price increases, the number of accommodations rises. Different cancellation policies (moderate, strict, flexible) and instant booking availability (true, false) exert some influence on price, though the overall trends remain similar. Listings with instant booking typically command slightly higher prices. An increase in the number of bedrooms consistently leads to higher log prices, particularly evident in listings with 3 to 5 bedrooms, regardless of instant booking and cleaning fee options. Similarly, listings with more beds exhibit higher log prices, with less variation due to cancellation policies and instant booking options, though some differences persist. Higher review ratings are generally associated with higher log prices, but this correlation is weaker compared to other variables. However, highly rated properties demonstrate more stable log prices. Additionally, the increase in the number of bathrooms leads to higher log prices, especially in higher-end properties with more bathrooms, where prices tend to be more stable and elevated. Overall, these factors collectively influence Airbnb listing prices, providing constructive insights for optimizing the pricing strategies for housing rentals.
2.4. Linear regression
Linear regression was selected for the analysis of Airbnb pricing due to its simplicity and interpretability, offering clear insights into the relationship between a predictor and a target variable. It is also computationally efficient for large datasets and serves as a robust baseline model for comparison with more complex analytical methods [4,5].
Through using Python, we performed several data preprocessing steps. First, the duplicate values were removed from the dataset. We then eliminated rows with missing values in categorical variables and imputed missing values in numerical columns using the median. Specified Boolean columns (cleaning fee and instant bookable) were converted to integer types. Finally, outliers in the data were addressed using the Interquartile Range (IQR) method. After data preprocessing, linear regression can be used to build and analyze the linear regression model.
Model Specification: The linear regression model was specified as follows:
where:
•
•
•
•
•
3. Results
|
coef |
std err |
t |
P>|t| |
[0.025 |
0.975] |
|
|
const |
3.230 |
0.052 |
61.706 |
0.000 |
3.128 |
3.333 |
|
accommodates |
0.093 |
0.003 |
31.482 |
0.000 |
0.087 |
0.099 |
|
bathrooms |
0.178 |
0.007 |
24.552 |
0.000 |
0.164 |
0.193 |
|
cleaning_fee |
-0.067 |
0.007 |
-10.309 |
0.000 |
-0.08 |
-0.054 |
|
instant_bookable |
-0.063 |
0.006 |
-10.97 |
0.000 |
-0.075 |
-0.052 |
|
review_scores_rating |
0.013 |
0.001 |
25.369 |
0.000 |
0.013 |
0.015 |
|
bedrooms |
0.158 |
0.005 |
31.692 |
0.000 |
0.148 |
0.168 |
|
beds |
-0.047 |
0.005 |
-8.629 |
0.000 |
-0.058 |
-0.036 |
|
room_type_Private room |
-0.609 |
0.007 |
-89.923 |
0.000 |
-0.623 |
-0.596 |
|
room_type_Shared room |
-1.063 |
0.015 |
-69.491 |
0.000 |
-1.093 |
-1.033 |
|
cancellation_policy_moderate |
-0.065 |
0.007 |
-8.77 |
0.000 |
-0.08 |
-0.051 |
|
cancellation_policy_strict |
-0.003 |
0.007 |
-0.455 |
0.649 |
-0.016 |
0.01 |
From Table 3, it is evident that for each additional unit of 'accommodates', the logarithmic price (log_price) increases by 0.093. Similarly, for each additional unit of bathrooms, log_price increases by 0.178, and for each additional unit of bedrooms, the price increases by 0.158. An increase of one unit in review scores rating leads to an increase of 0.013 in log price. However, adding one more bed results in a decrease of 0.047 in the log price.
In terms of categorical variables, compared to houses without cleaning fees, the log price of the houses requiring cleaning fees decreases by 0.067. For houses supporting instant booking, the log price decreases by 0.063 compared to those that do not. Compared to entire home/apartment listings, private room listings see a reduction of 0.609 in log price, while shared room listings see a reduction of 1.063. Additionally, properties with moderate cancellation policies have the log price reduced by 0.065 compared to those with flexible policies, and properties with strict policies have the log price reduced by 0.003.
Most variables are statistically significant at p < 0.001, with the exception of the strict cancellation policy variable, which does not significantly impact the price. The confidence intervals for all variables exclude zero, indicating reliable estimates.
|
RMSE |
MAE |
R-squared |
Adj. R-squared |
|
|
Train |
0.515 |
0.400 |
0.509 |
0.509 |
|
Test |
0.515 |
0.398 |
0.508 |
0.507 |
The linear regression model's performance on the training set demonstrates the extent to which each variable explains variations in housing prices. Table 4 indicates that the model explains approximately 50% of the variance in housing prices, underscoring the importance of each predictor. The test set performance closely mirrors that of the training set, suggesting that the model generalizes well to new, unseen data.
The Root Mean Squared Error (RMSE) of approximately 0.51 and the Mean Absolute Error (MAE) of approximately 0.40 reflect the model's high predictive accuracy for the logarithmic transformation of rental prices. The lower MAE indicates that the model has smaller errors and higher efficiency in predicting housing prices.
4. Conclusion
4.1. For Airbnb hosts
Maximize Accommodation Capacity: Hosts can draw more interest by increasing the number of people their properties can accommodate. It can be done with renovations by adding flexible sleeping options like sofa beds, bunk beds, or rollaway beds.
Highlight Positive Customer Reviews: Although review scores have a low correlation with price, customer reviews and high ratings still have an impact on booking rates. Highlighting positive reviews and high ratings to build trust and attract more bookings from customers also has the possibility to boost pricing values.
4.2. For Airbnb housing strategies
Incorporate Key Variables into Pricing Algorithms: Airbnb has the possibility to improve its pricing prediction models by integrating variables having a strong correlation with housing prices, such as the number of accommodates, beds, and bathrooms. By enriching its dataset and models, Airbnb is able to further help hosts optimize their pricing strategies, resulting in more accurate and competitive prices and providing customers a better service.
Acknowledgement
Gengyuan Zeng, Ningning Huo and Xinhe Zhang contributed equally to this work and should be considered co-first authors.
References
[1]. Xie, K., & Mao, Z. (2017). The impacts of quality and quantity attributes of airbnb hosts on listing performance. International Journal of Contemporary Hospitality Management, 29(9), 2240-2260. doi: https: //doi.org/10.1108/IJCHM-07-2016-0345
[2]. Glusac, E. (2016) Hotels vs. Airbnb: Let the Battle Begin. New York Times. Retrieved from https: //www.proquest.com/newspapers/hotels-vs-airbnb-let-battle-begin/docview/1809640061/se-2
[3]. WEED, & JULIE. (2015). Hotels view airbnb as hardly a threat, for now. New York Times, 164(56864), B4-B4.
[4]. Worzala, E., Lenk, M., Silva, A. (1995) An Exploration of Neural Networks and Its Application to Real Estate Valuation. Journal of Real Estate Research, 10: 185–201. https: //doi.org/10.1080/10835547.1995.12090782.
[5]. Nguyen, N., Cripps, A. (2001) Predicting Housing Value: A Comparison of Multiple Regression Analysis and Artificial Neural Networks. The Journal of Real Estate Research, 22: 313-336. Retrieved from https: //www.proquest.com/scholarly-journals/predicting-housing-value-comparison-multiple/docview/200301026/se-2.
Cite this article
Zeng,G.;Huo,N.;Zhang,X. (2025). Research on Different Factors Affecting Airbnb Housing Prices. Advances in Economics, Management and Political Sciences,202,37-49.
Data availability
The datasets used and/or analyzed during the current study will be available from the authors upon reasonable request.
Disclaimer/Publisher's Note
The statements, opinions and data contained in all publications are solely those of the individual author(s) and contributor(s) and not of EWA Publishing and/or the editor(s). EWA Publishing and/or the editor(s) disclaim responsibility for any injury to people or property resulting from any ideas, methods, instructions or products referred to in the content.
About volume
Volume title: Proceedings of the 3rd International Conference on Financial Technology and Business Analysis
© 2024 by the author(s). Licensee EWA Publishing, Oxford, UK. This article is an open access article distributed under the terms and
conditions of the Creative Commons Attribution (CC BY) license. Authors who
publish this series agree to the following terms:
1. Authors retain copyright and grant the series right of first publication with the work simultaneously licensed under a Creative Commons
Attribution License that allows others to share the work with an acknowledgment of the work's authorship and initial publication in this
series.
2. Authors are able to enter into separate, additional contractual arrangements for the non-exclusive distribution of the series's published
version of the work (e.g., post it to an institutional repository or publish it in a book), with an acknowledgment of its initial
publication in this series.
3. Authors are permitted and encouraged to post their work online (e.g., in institutional repositories or on their website) prior to and
during the submission process, as it can lead to productive exchanges, as well as earlier and greater citation of published work (See
Open access policy for details).
References
[1]. Xie, K., & Mao, Z. (2017). The impacts of quality and quantity attributes of airbnb hosts on listing performance. International Journal of Contemporary Hospitality Management, 29(9), 2240-2260. doi: https: //doi.org/10.1108/IJCHM-07-2016-0345
[2]. Glusac, E. (2016) Hotels vs. Airbnb: Let the Battle Begin. New York Times. Retrieved from https: //www.proquest.com/newspapers/hotels-vs-airbnb-let-battle-begin/docview/1809640061/se-2
[3]. WEED, & JULIE. (2015). Hotels view airbnb as hardly a threat, for now. New York Times, 164(56864), B4-B4.
[4]. Worzala, E., Lenk, M., Silva, A. (1995) An Exploration of Neural Networks and Its Application to Real Estate Valuation. Journal of Real Estate Research, 10: 185–201. https: //doi.org/10.1080/10835547.1995.12090782.
[5]. Nguyen, N., Cripps, A. (2001) Predicting Housing Value: A Comparison of Multiple Regression Analysis and Artificial Neural Networks. The Journal of Real Estate Research, 22: 313-336. Retrieved from https: //www.proquest.com/scholarly-journals/predicting-housing-value-comparison-multiple/docview/200301026/se-2.