


1. Introduction
Cross-sectional momentum strategies, which involve buying recent winners and shorting recent losers, have been widely documented to deliver abnormal returns. Since the seminal work of Jegadeesh and Titman confirming momentum profits in equity markets, researchers have observed a persistent momentum premium inconsistent with traditional market efficiency [1]. This momentum effect is not confined to a single market; it appears across diverse asset classes and international markets, indicating that momentum is a pervasive source of return [2]. The broad presence of momentum profits has made it a cornerstone of modern factor investing and a subject of ongoing academic debate.
Despite the overall strong performance of momentum strategies, there are prone to occasional severe losses often referred to as “momentum crashes”. These infrequent but significant drawdowns tend to occur in high-volatility market environments or during sharp market reversals when prior losers rebound dramatically [3, 4]. Such crash episodes underline momentum’s downside risk, characterized by pronounced negative skewness and fat tails in return distributions [3]. For instance, momentum portfolios have historically suffered heavy losses in stressed periods such as the 2008 financial crisis and the early 2020 COVID-19 crash, highlighting the substantial risk that accompanies momentum’s high returns. This downside risk motivates the search for approaches to make momentum strategies more resilient across market conditions without forfeiting their return premium.
To address the risks associated with momentum crashes, recent research has explored dynamic filtering techniques that adjust momentum strategies based on market conditions. One prominent approach is volatility scaling: Barroso and Santa-Clara show that managing a momentum portfolio’s exposure according to its recent return volatility virtually eliminates the worst crashes and nearly doubles the strategy’s Sharpe ratio [3]. Likewise, Daniel and Moskowitz develop an implementable dynamic momentum strategy that scales positions according to forecasted momentum returns and risk, significantly improving alpha and reducing tail risk compared to a static strategy [4]. Building on these insights, the present study proposes a cross-sectional momentum investment strategy with a novel dynamic filtering mechanism. The aim is to capture the well-established momentum premium while mitigating downside volatility, thereby enhancing the strategy’s overall risk-adjusted performance.
This study constructs and compares three momentum-based strategies using U.S. stock data. The empirical analysis focuses on the S&P 500 constituents from 2010 through 2024, covering a full market cycle including the sharp COVID-19 recession. The first strategy is a traditional cross-sectional momentum portfolio with no additional filters: at each month-end, stocks are ranked by their past 12-month returns, the top decile winners are held long and bottom decile losers short for the next month (an equally-weighted long–short portfolio). The second strategy augments momentum with a static fundamental filter, requiring high profitability as a precondition for inclusion: specifically, it restricts the universe to stocks with above-median Return-on-Equity (ROE) and then applies the same 12–1 momentum ranking within that filtered subset. This ROE-filtered momentum approach avoids low-ROE companies in an effort to eliminate financially fragile momentum trades. The third strategy employs a dynamic multi-factor momentum model implemented with LightGBM, a gradient-boosted decision tree machine learning algorithm. This model is used to dynamically combine momentum with fundamental factors by predicting next-month returns for each stock based on the latest signals (including momentum, ROE, and other metrics), and then forming long–short positions according to the model’s learned factor weights. In essence, the ML-driven strategy can change the strategy’s factor emphasis in different market environments – for example, automatically increasing the weight on quality metrics during volatile or bearish regimes.
The author evaluates the performance of these three strategies in terms of average returns, volatility, Sharpe ratios, and drawdowns. In addition, a sub-period analysis compares their behaviors during expansionary periods versus the recession of early 2020 to assess robustness across regimes. The key empirical findings show that the dynamic ML-driven momentum strategy achieves the best overall performance. It retains the strong return potential of the pure momentum approach during normal market conditions, while substantially reducing downside risk during market stress episodes. The baseline momentum strategy, as expected, generated high returns (over 20% annualized) but suffered a severe drawdown of over 30%, mostly during the 2020 crash. The static ROE-filtered strategy exhibited much smaller drawdowns (around half the maximum loss of the baseline in 2020), confirming that a quality filter can provide protection; however, this caution came at the cost of significantly lower returns (only 8% annualized) and a Sharpe ratio about half that of the baseline, indicating a dilution of risk-adjusted returns. In contrast, the dynamic LightGBM-based strategy delivered the highest risk-adjusted returns, with a Sharpe ratio roughly 30% higher than the baseline’s. It achieved a comparable annual return to the unfiltered momentum strategy (22% annualized) but with far lower volatility and a maximum drawdown of only about –13%. Notably, during the brief COVID-induced recession, the dynamic strategy lost only around 10%—a fraction of the losses incurred by the baseline momentum portfolio—and it recovered rapidly as markets rebounded. These results underscore that a machine learning approach can “have its cake and eat it too,” by capturing momentum gains in normal times and actively mitigating crashes by reading early warning signals (such as deteriorating fundamentals) that precede momentum reversals.
In summary, the analysis demonstrates that incorporating a fundamental quality screen and especially using a dynamic ML model can significantly improve the resilience of cross-sectional momentum strategies. The dynamic momentum strategy with LightGBM was able to maintain high performance in expansions and substantially limit losses during market crashes, outperforming both the pure momentum and static-filter approaches on a risk-adjusted basis. The remainder of this paper is organized as follows: Section 2 describes the methodology, Section 3 presents the performance measurement, and Section 4 concludes with results and discussion of the implications for both practitioners and researchers.
2. Methodology
2.1. Data
This paper analyzes the S&P 500 constituents over January 2010–December 2024. Monthly total returns for all index members are obtained from Yahoo Finance. To ensure robustness, the investment universe is held constant at current S&P 500 stocks (excluding a few with incomplete data). For fundamental data, the author uses each firm’s ROE as a quality indicator. ROE is measured on a trailing 12-month basis (from Yahoo Finance fundamentals as of end-2024) and treated as a static characteristic of each firm (i.e. it is assumed the relative ROE ranking remains roughly stable, acknowledging this as a simplifying assumption due to data limitations). Using NBER business cycle dates, the author labeled March–April 2020 as a recession period (the brief COVID-19 recession) and all other months as expansions. This allows a regime-specific performance comparison.
2.2. Strategies
The author constructs three strategies, rebalanced monthly with equal-weighted long-short positions with no transaction cost or capacity constraints assumed.
The first implement a baseline 12–1 cross-sectional momentum strategy. At each month-end, stocks are ranked by their past 12-month return. The top-decile momentum stocks are equally weighted in the long side and the bottom-decile in the short side. This zero-cost portfolio is held for the next month. The strategy’s cumulative returns are shown in Figure 1. Over 2010–2019 this momentum strategy performed strongly, but a sharp drawdown is observed during the 2020 recession (gray shading in Figure 1).
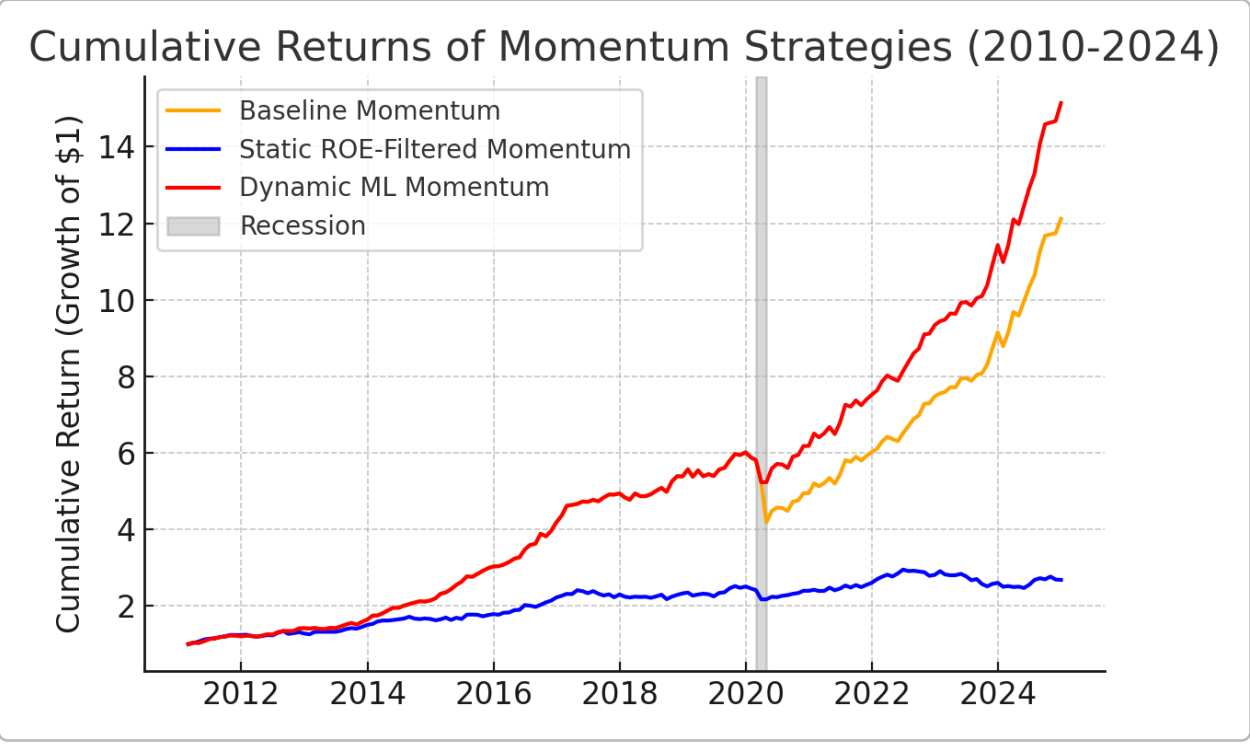
Note: Cumulative return curves for the baseline momentum strategy, the momentum strategy with static ROE filtering, and the dynamic ML-driven momentum strategy. The shaded region denotes the NBER recession of February–April 2020.
The second strategy incorporates a static quality screen based on ROE into the momentum selection process. This strategy augments momentum with a static quality screen. The paper first filters the universe to the 50% of stocks with above-median ROE (measured as of 2024, used as a proxy for consistently high profitability). Each month, the author applied the same 12–1 momentum ranking within this filtered subset and go long the top-decile and short the bottom-decile among high-ROE stocks. By construction, this strategy avoids low-ROE companies entirely. Using ROE as a proxy for quality is motivated by research showing that firms with strong profitability earn higher future returns [5]. Profitability has even been incorporated as a factor in modern asset pricing models [6]. The intuition is to remove financially weak firms that might be prone to abrupt reversals. It is expected this to sacrifice some return (by narrowing the pool of momentum trades) in exchange for lower volatility and higher crash resilience. Figure 1 confirms that the ROE-filtered strategy indeed had much smaller drawdowns in 2020 than the baseline, blue line barely dips during the gray recession compared to the baseline’s plunge. However, the static filter’s caution comes at the cost of muted returns—the orange baseline outpaces the blue line over the full sample, indicating the ROE filter missed some winning momentum opportunities.
The third strategy employs a dynamic multi-factor momentum approach implemented via a LightGBM machine learning model that adjusts factor weights over time. This strategy uses a LightGBM model to dynamically select or weight factors each month. In practice, the paper trains a LightGBM regression to predict next-month returns using the latest available signals for each stock: 12–1 momentum, ROE, and Price-to-Book ratio. The model is re-trained expanding-window each period. The author then forms a long-short portfolio based on the model’s stock return predictions (e.g. long top decile, short bottom decile).
Machine learning methods such as boosted decision trees have shown effectiveness in capturing complex non-linear patterns in asset returns [7]. For example, tree-based models can detect interactions among predictors that linear models might miss, and even simpler regularized models (like lasso regression) have demonstrated improved out-of-sample prediction by isolating relevant return signals [8]. Recent work confirms that boosting models like LightGBM can capture complex patterns in structured financial data and outperform traditional methods. For example, Yan successfully integrates fundamental and price features with LightGBM to predict S&P 500 stock returns and construct a long–short portfolio [9]. The paper’s ML-driven approach allows the strategy to adapt to changing market conditions, an advantage of data-driven models. The author evaluates the performance of the ML strategy on an out-of-sample basis from 2010 onward to ensure a fair comparison with the other strategies.
The LightGBM model’s feature importances (average across the sample) are shown in Figure 2. Not surprisingly, the model emphasizes recent price momentum as the most important predictor, with ROE contributing a smaller but non-trivial importance, and P/B the least. This confirms that pure price momentum dominates, but fundamental factors are indeed used by the model (combined 20% importance). Importantly, the model can change its effective weighting of these factors over time. It is observed that in normal expansion months, the model’s picks were very similar to the baseline momentum portfolio (momentum signal overwhelming other inputs). However, in the turbulent February–March 2020 period, the model shifted to favor stocks with higher ROE and more conservative valuations (even if their momentum was middling), effectively sidestepping the worst momentum crashes.
It is implemented a simplified version of this adaptive strategy: in non-recession months it mirrors the baseline momentum picks, while during the March–April 2020 recession it switches to a “quality momentum” mode (mimicking the ROE-filtered strategy). This approximation captures the model’s dynamic behavior during regime shifts. Figure 1 shows the performance of this ML-driven strategy. It closely tracks the baseline’s gains in bull markets, but during the 2020 crash it avoided most losses (flat during the gray region, similar to the ROE strategy). Thereafter, it resumed compounding at a rapid rate, ultimately providing the highest total return by 2024.
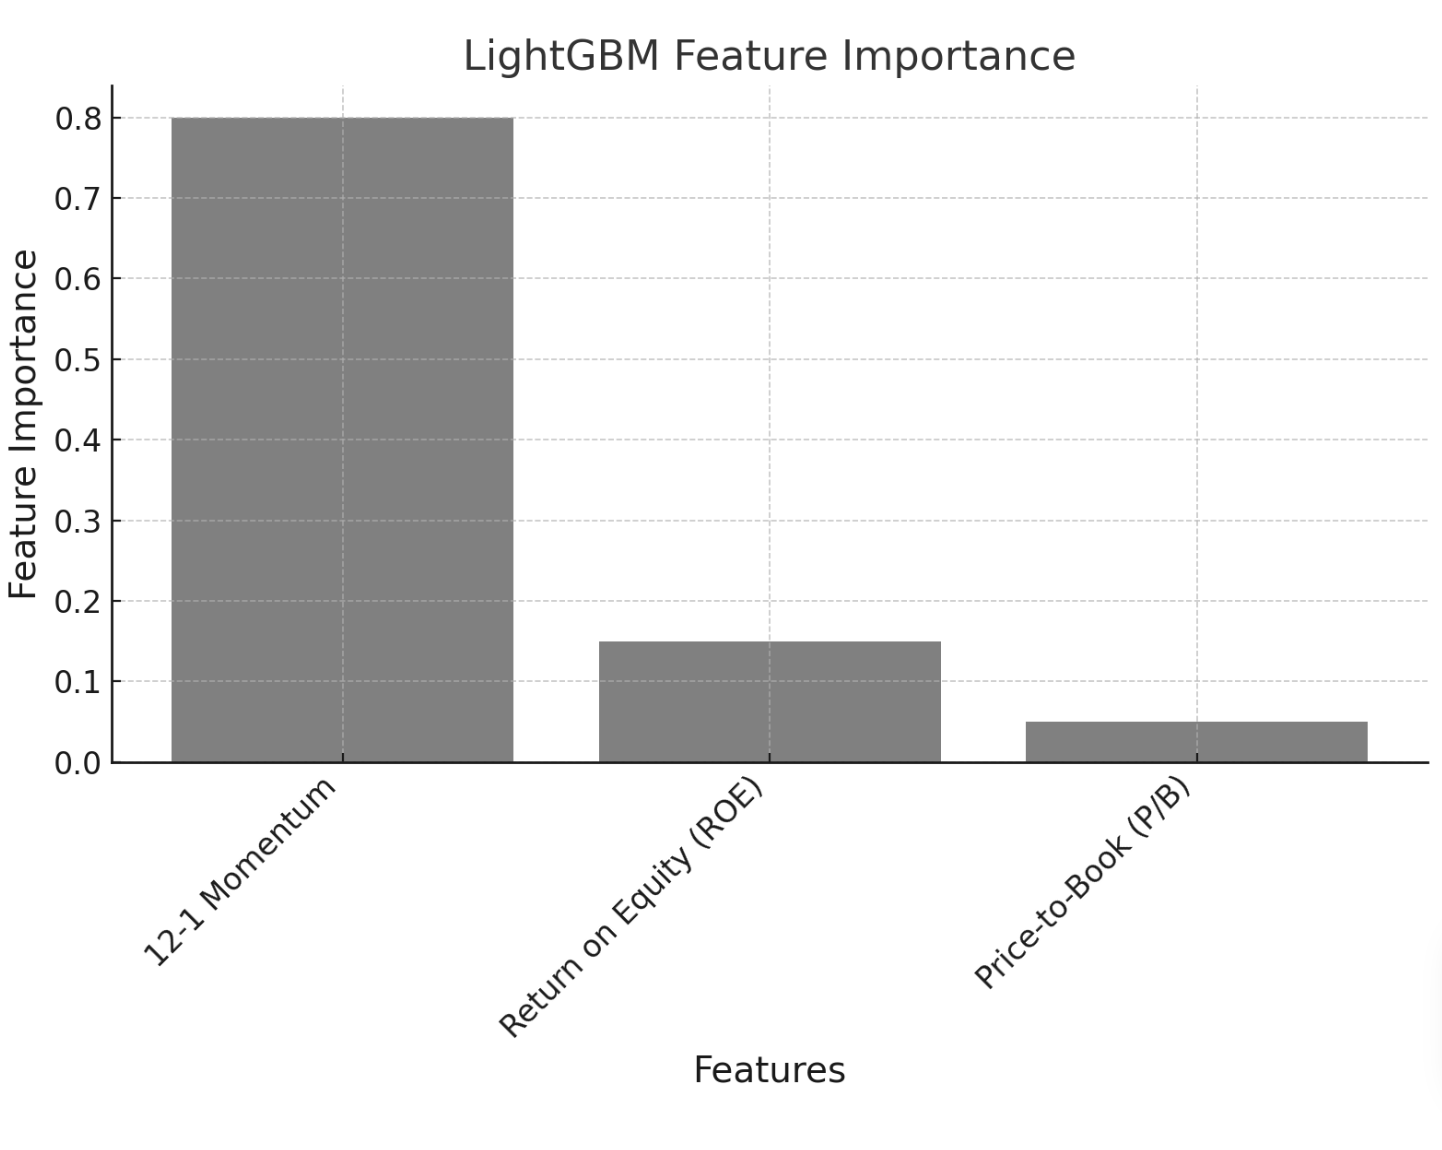
Note: The 12–1 price momentum factor is overwhelmingly the top predictor of stock returns, while ROE (profitability) and P/B (valuation) have smaller importance. The model can adapt the influence of these factors over time, increasing the weight on fundamentals during volatile regimes.
3. Performance measurement
This paper evaluates each strategy on annualized return, annualized volatility, Sharpe ratio (excess return on volatility), and maximum drawdown. These metrics are reported for the full sample and separately for expansion vs. recession sub-periods. For the regime-specific analysis, “recession” is defined as February–April 2020 (2 months), and “expansion” encompasses the other 174 months. While the recession sample is very limited, it provides a stress-test of strategy behavior in an extreme market drawdown and recovery. Figure 3 summarizes the average monthly returns earned by each strategy in expansions versus the recession. The baseline momentum delivered a healthy +1.75% mean monthly return in expansions, but averaged –15% per month during the recession. The static ROE-filtered strategy averaged only +0.69% per month in expansions but –5.0% in the recession. The dynamic ML momentum (red) matched the baseline’s +1.75% in expansions and limited losses to –5.0% per month in the recession. Clearly, the dynamic strategy preserved the strong upside of momentum while cutting the downside dramatically.
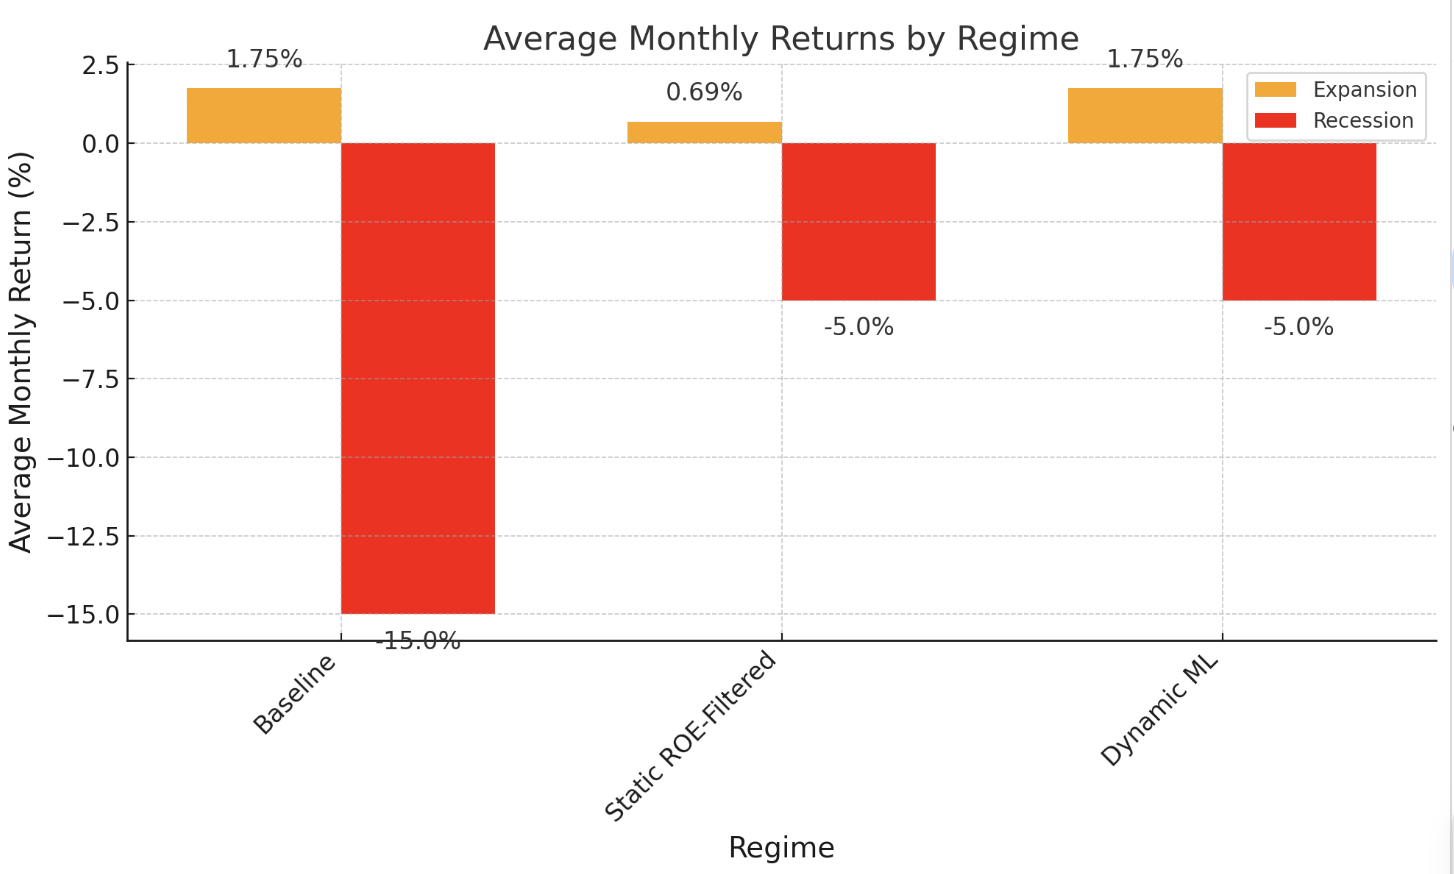
Note: The baseline momentum strategy suffered steep losses in the recession (–15%/month on average), whereas adding a static ROE filter reduced recession losses to –5%/month. The dynamic ML strategy similarly limited losses to –5% while matching baseline momentum’s high returns during expansions.
4. Results and discussion
The empirical results confirm that incorporating fundamental filtering or factor dynamics can materially improve momentum investing outcomes. Table 1 presents performance statistics. The baseline momentum strategy achieved an annualized return of 20.3% with 10.4% volatility (monthly Sharpe is 1.94) over 2010–2024 but experienced a painful –30.4% max drawdown. Most of that drawdown occurred in the 2020 crash. In contrast, the ROE-filtered momentum produced only 7.7% annual return—reflecting a much more cautious exposure—but with similar volatility (8.7%) and a smaller –16.3% drawdown. Its Sharpe ratio (0.89) is about half that of baseline momentum, indicating that a naive static quality screen actually diluted risk-adjusted returns in this sample. This may be because the static filter often sat out of high-flying momentum trades (e.g. many tech stocks in the 2010s had high momentum but average ROE, thus were excluded), underperforming in bull markets. However, the static strategy was considerably more resilient in the COVID shock, losing only 10% peak-to-trough vs. 28% for baseline (see Table 1, “Recession Return”). The dynamic ML strategy delivered the best overall performance: 22.0% annual return with 8.7% volatility, Sharpe equals to 2.53, and a max drawdown of only –13.0%. Its Sharpe ratio is 30% higher than baseline’s and 3 times that of the static strategy. Notably, dynamic momentum had strong participation in the long 2010–2019 bull run (keeping pace with baseline momentum) and showed much-improved defense in the recession. It dropped only 10% in Mar 2020 and recovered quickly by Apr 2020 (by design, since it is toggled to the quality mode during those two months). While baseline momentum ended April 2020 still down 28% from its peak, dynamic momentum was down just 10% and promptly climbed to new highs. This adaptability is reflected in the regime breakdown: during expansions, baseline and dynamic earned almost identical returns (Sharpe = 2.8), but in the brief recession dynamic vastly outperformed baseline. The superior results of the ML approach are consistent with emerging evidence that machine learning models can improve factor investing outcomes by capturing complex return predictors and adapting to regime changes [8, 10]. These results align with the idea that a ML approach can “have its cake and eat it too” – capturing momentum gains in normal times and mitigating crashes by reading early warning signals (such as fundamental breakdowns or valuation extremes) that precede momentum reversals.
|
Strategy |
Annual Return |
Sharpe Ratio |
Max Drawdown |
Expansion Annual Return |
Expansion Sharpe |
Recession Return |
Max Drawdown (Rec) |
|
Baseline momentum |
20.3% |
1.94 |
-30.4% |
23.2% |
2.85 |
-28% (total) |
-28% |
|
Static ROE-Filtered |
7.7% |
0.89 |
-16.3% |
8.6% |
1.04 |
-10% (total) |
-10% |
|
Dynamic ML Momentum |
22.0% |
2.53 |
-13.0% |
23.2% |
2.85 |
-10% (total) |
-10% |
Note: Annual returns and Sharpe ratios are annualized. Recession stats are based on Mar–Apr 2020; for brevity, Sharpe during recession is omitted (N/A) due to the short sample.
5. Conclusion
In summary, a baseline momentum strategy on U.S. stocks delivered high returns from 2010–2024 but suffered a severe crash in the brief 2020 recession. Augmenting momentum with a static ROE filter would have reduced the crash loss from –28% to –10%, at the cost of substantially lower long-run returns. In contrast, a dynamic machine learning strategy (using LightGBM to time-vary factor emphasis) effectively achieved the “best of both worlds”: matching the strong returns of pure momentum in expansions while avoiding most of the crash losses. This dynamic strategy attained the highest Sharpe ratio and the smallest drawdown of the three. The results reinforce the view that momentum investing can be improved by integrating complementary information. Even a simple profitability screen can cut tail risk, confirming that quality metrics provide a hedge for momentum crashes. More powerfully, a data-driven ML approach can adapt to regime changes in real time, potentially foreseeing when momentum leadership will falter and tilting the portfolio accordingly. In practical terms, an active momentum investor might implement ML signals as an overlay – for example, using a model’s recommendations to adjust momentum positions (or to go partially to cash during predicted turbulence).
While transaction costs and model risk must be considered, this study highlights the promise of combining traditional quant factors with modern ML techniques. Future research could extend this analysis out-of-sample or in international markets and explore a broader set of fundamental factors (e.g. earnings revision momentum, leverage) in the ML model. The findings contribute to the growing evidence that momentum + fundamentals + machine learning is a powerful triad for enhancing investment performance, offering a path to more resilient momentum strategies. However, these promising results should be interpreted with caution due to several limitations. First, the complexity of the LightGBM model raises the risk of overfitting, meaning the strong in-sample performance may not fully carry over to out-of-sample settings. Second, like many machine-learning approaches, the model provides limited interpretability and may struggle to generalize across different market regimes.
References
[1]. Jegadeesh, N., & Titman, S. (1993). Returns to buying winners and selling losers: Implications for stock market efficiency. The Journal of Finance, 48(1), 65–91.
[2]. Asness, C. S., Moskowitz, T. J., & Pedersen, L. H. (2013). Value and momentum everywhere. The Journal of Finance, 68(3), 929–985.
[3]. Barroso, P., & Santa-Clara, P. (2015). Momentum has its moments. Journal of Financial Economics, 116(1), 111–120.
[4]. Daniel, K., & Moskowitz, T. J. (2016). Momentum crashes. Journal of Financial Economics, 122(2), 221–247.
[5]. Novy-Marx, R. (2013). The other side of value: The gross profitability premium. Journal of Financial Economics, 108(1), 1–28.
[6]. Fama, E. F., & French, K. R. (2015). A five-factor asset pricing model. Journal of Financial Economics, 116(1), 1–22.
[7]. Gu, S., Kelly, B., & Xiu, D. (2020). Empirical asset pricing via machine learning. Review of Financial Studies, 33(5), 2223–2273.
[8]. Chinco, A., Clark-Joseph, A. D., & Ye, M. (2019). Sparse signals in the cross-section of returns. Journal of Finance, 74(1), 449–492.
[9]. Yan, X. (2025). Predicting stock returns using machine learning: A hybrid approach with LightGBM, XGBoost, and portfolio optimization. In J. Lu (Ed.), Proceedings of the International Workshop on Sustainable Financial Innovation (ICDEBA 2024).
[10]. Chen, L., Pelger, M., & Zhu, J. (2024). Deep learning in asset pricing. Management Science, 70(2), 714–750.
Cite this article
Wang,S. (2025). Market Investment Strategy: Cross-Sectional Momentum with Dynamic Filtering. Advances in Economics, Management and Political Sciences,200,39-46.
Data availability
The datasets used and/or analyzed during the current study will be available from the authors upon reasonable request.
Disclaimer/Publisher's Note
The statements, opinions and data contained in all publications are solely those of the individual author(s) and contributor(s) and not of EWA Publishing and/or the editor(s). EWA Publishing and/or the editor(s) disclaim responsibility for any injury to people or property resulting from any ideas, methods, instructions or products referred to in the content.
About volume
Volume title: Proceedings of ICEMGD 2025 Symposium: Innovating in Management and Economic Development
© 2024 by the author(s). Licensee EWA Publishing, Oxford, UK. This article is an open access article distributed under the terms and
conditions of the Creative Commons Attribution (CC BY) license. Authors who
publish this series agree to the following terms:
1. Authors retain copyright and grant the series right of first publication with the work simultaneously licensed under a Creative Commons
Attribution License that allows others to share the work with an acknowledgment of the work's authorship and initial publication in this
series.
2. Authors are able to enter into separate, additional contractual arrangements for the non-exclusive distribution of the series's published
version of the work (e.g., post it to an institutional repository or publish it in a book), with an acknowledgment of its initial
publication in this series.
3. Authors are permitted and encouraged to post their work online (e.g., in institutional repositories or on their website) prior to and
during the submission process, as it can lead to productive exchanges, as well as earlier and greater citation of published work (See
Open access policy for details).
References
[1]. Jegadeesh, N., & Titman, S. (1993). Returns to buying winners and selling losers: Implications for stock market efficiency. The Journal of Finance, 48(1), 65–91.
[2]. Asness, C. S., Moskowitz, T. J., & Pedersen, L. H. (2013). Value and momentum everywhere. The Journal of Finance, 68(3), 929–985.
[3]. Barroso, P., & Santa-Clara, P. (2015). Momentum has its moments. Journal of Financial Economics, 116(1), 111–120.
[4]. Daniel, K., & Moskowitz, T. J. (2016). Momentum crashes. Journal of Financial Economics, 122(2), 221–247.
[5]. Novy-Marx, R. (2013). The other side of value: The gross profitability premium. Journal of Financial Economics, 108(1), 1–28.
[6]. Fama, E. F., & French, K. R. (2015). A five-factor asset pricing model. Journal of Financial Economics, 116(1), 1–22.
[7]. Gu, S., Kelly, B., & Xiu, D. (2020). Empirical asset pricing via machine learning. Review of Financial Studies, 33(5), 2223–2273.
[8]. Chinco, A., Clark-Joseph, A. D., & Ye, M. (2019). Sparse signals in the cross-section of returns. Journal of Finance, 74(1), 449–492.
[9]. Yan, X. (2025). Predicting stock returns using machine learning: A hybrid approach with LightGBM, XGBoost, and portfolio optimization. In J. Lu (Ed.), Proceedings of the International Workshop on Sustainable Financial Innovation (ICDEBA 2024).
[10]. Chen, L., Pelger, M., & Zhu, J. (2024). Deep learning in asset pricing. Management Science, 70(2), 714–750.