


1. Introduction
As digital platforms increasingly moderate what and how we consume, food choices are no longer made on sidewalks but through screens. In the booming food delivery economy, platforms like Uber Eats, DoorDash, and Pandas have reshaped not only what we eat, but how we decide what to eat. Globally, food delivery orders now exceed tens of billions annually. In China, the average number of delivery orders per person per day has surpassed two [1], while Uber Eats has onboarded over one million merchants and reached more than 50 million monthly active users worldwide [2].
In this vast and intensely competitive digital ecosystem, visual presentation has emerged as a powerful key factor. Food images are no longer decorative—they are the first point of interaction between restaurants and consumers. From thoroughly styled burgers to AI-generated sushi imagery, food photos now serve as the restaurant’s digital storefront. Consumers make split-second decisions based on what they see, often before they read text descriptions or explore restaurant details. A well-composed, vibrant image can mean the difference between a click and a scroll-past.
While it is intuitive that appealing visuals can drive engagement, the mechanisms by which image attributes influence consumer responses remain underexplored. Neuroscientific evidence shows that food images automatically activate distinct brain networks associated with hedonic value and inhibitory control, offering a physiological basis for how visuals influence eating behavior [3]. Do visual elements such as brightness, color saturation, and layout significantly impact sales performance? What makes one image more persuasive than another in a sea of similar options? As visual marketing becomes a core battleground in digital commerce, these questions become increasingly urgent—particularly in image-heavy platforms like Uber Eats.
Existing research has shown that image quality can enhance appetite, increase click-through rates, and influence purchase intentions [4,5]. Some studies using large-scale data and machine learning have demonstrated the predictive power of visual content in online consumer decisions [6]. However, much of this work remains either experimental or rooted in subjective visual preferences, with limited attention to the operational impact of specific, measurable image features in real-world food delivery platforms.
To further explore this topic, this study focuses on the Uber Eats platform and investigates how quantifiable visual attributes of restaurant display photos affect sales performance. We analyze data from 1538 restaurants in the United States where different branches typically use unique food images for online presentation. This large-scale, real-world dataset captures authentic platform dynamics and provides a solid foundation for empirical analysis.
We extract 12 image features using computer vision techniques and conceptually group them into three dimensions. The first is visual composition, which describes the spatial organization and balance of visual elements within the image, including features such as diagonal dominance, rule of thirds, visual balance intensity, and visual balance color [7]. The second is color and brightness perception, which encompasses chromatic and luminance attributes such as warm hue, saturation, brightness, and brightness contrast, all of which shape the food’s perceived appeal and emotional impact [8]. The third is the figure-ground relationship, capturing how distinctly the food stands out from its background through features like size difference, color difference, texture difference, and image clarity [9]. These feature dimensions have been widely applied in studies of food marketing, hospitality design, and digital persuasion [10,11].
To quantify the relationship between image features and restaurant performance, we employ multiple linear regression controlling for a set of restaurant-specific characteristics. Results indicate that image features have a strong influence on review volume—likely because visual cues shape initial ordering decisions. Visual elements such as color temperature and contrast may enhance perceptions of freshness and appeal, prompting users to click on the restaurant or place an order. Our findings show that specific visual features—particularly color contrast, brightness, and figure-ground separation—play a key role in attracting consumer attention and increasing review volume, highlighting the operational value of visual optimization in food delivery.
This study contributes both theoretically and practically. Theoretically, it expands the literature by incorporating unstructured image data into sales modeling, moving beyond traditional predictors such as price [12,13]. Drawing on image perception theory and Gestalt visual principles, we develop a quantitative framework for analyzing how food images influence decision-making. Practically, the findings offer actionable insights for restaurants and platforms, such as enhancing color saturation and clarity to increase visual appeal [14], applying compositional rules like the Rule of Thirds to guide viewer focus [15], and avoiding cluttered backgrounds to reduce distraction and improve cognitive fluency [16]. Through data-driven visual optimization, restaurants can boost consumer engagement, improve conversion rates, and enhance brand competitiveness in the platform economy.
2. Literature review
2.1. The impact of image features on sales
Extensive research highlights the critical role of image features in consumer decision-making, particularly in online markets and visually driven environments. In sectors like tourism and food service, visual presentation—such as composition, color, and figure-ground relationship—has been shown to significantly influence consumer engagement and purchase intent [17,18]. For instance, studies on Airbnb properties indicate that images with well-composed layouts, warm color tones, and high clarity significantly enhance consumer engagement, ultimately driving booking rates [10]. However, while visual presentation is equally crucial in the food delivery industry, its influence mechanisms may be more complex, given the interplay of other factors shaping consumer decisions.
Existing research generally categorizes the image attributes influencing consumer purchasing decisions into three main dimensions. The first is composition, including diagonal dominance, rule of thirds, visual balance color, and visual balance intensity [19]. Theoretically, well-structured compositions enhance visual satisfaction, thereby increasing purchase intent. However, empirical findings suggest that this effect is not always straightforward. compositionally optimized images in Airbnb listings increased booking rates by 8.98% [10] Yet similar effects in the food delivery sector tend to be diluted by factors such as price sensitivity and delivery speed. Studies have shown that, in food delivery contexts, consumer decision-making is more strongly influenced by price perception and delivery reliability than by visual composition or aesthetics [20,21]. After all, for consumers seeking a quick meal, brand perception, affordability, and food freshness often take precedence over whether a dish adheres to the golden ratio of visual presentation [5,11]. Consequently, in the highly competitive food delivery market, the independent effect of composition features may be diminished.
The next key factor is color, including warm hue, saturation, brightness, brightness contrast, and image clarity. Research in color psychology has demonstrated that these attributes can directly influence consumer emotions and purchasing intentions [22,23]. Reference [24] highlights that color not only enhances consumer perception but also accelerates decision-making processes. This effect is particularly pronounced in the food delivery industry, where highly saturated and bright food images tend to increase menu click-through rates and order conversions [4,5]. However, the present study finds that excessively high brightness contrast may have the opposite effect. Three possible reasons account for this phenomenon: first, visual fatigue, as prolonged exposure to high-contrast images can cause discomfort [25]; second, visual discomfort, as intense brightness variations may strain the eyes, making it difficult to focus on the food itself [26]; and third, loss of detail, as extreme brightness contrast can obscure the texture of the food, preventing consumers from intuitively assessing its freshness, thereby reducing purchase intentions [27]. These findings suggest that while visual impact is crucial, presenting food in a natural and textured manner may be the key to effectively engaging consumers.
The final critical factor lies in the figure-ground relationship—specifically, the contrast between the foreground and background in terms of size, color, and texture. These visual elements determine how prominently the food stands out in the image [23,28]. A strong size difference helps viewers quickly focus on the core content, enhancing cognitive efficiency in product recognition [29]. Meanwhile, color difference plays a key role in triggering emotional responses—vivid food images not only capture more attention but also stimulate appetite, thereby increasing purchase intentions [30].
Texture difference is equally important. Clearly visible food textures enhance the sense of authenticity, enabling consumers to almost “imagine the mouthfeel,” which in turn boosts the likelihood of placing an order [31]. This is especially true in the food service industry. As stated in Reference [32], “we eat first with our eyes.” In other words, the visual presentation of food images shapes the consumer’s first impression—and may ultimately determine whether they decide to order [28,31].
Recent studies have further revealed that high-brightness, high-saturation, and high-resolution food images on menus can significantly increase click-through and conversion rates. For instance, high-quality food imagery markedly improves visual attention and overall user experience[4]. On visually crowded food delivery platforms, a single well-crafted image may speak louder than a thousand words.
2.2. Visual design and crossmodal experience
Visual design not only shapes consumers’ aesthetic perception but also influences purchasing intentions through crossmodal correspondences. Crossmodal experience refers to the interaction between different sensory modalities, where visual cues can affect taste, smell, and touch, ultimately shaping consumers’ subjective perception of food quality and flavor [33].
Research highlights the crucial role of high-quality visual design in food marketing. Vibrant colors and well-composed food images enhance consumers’ taste expectations and increase purchase intentions [23]. Similarly, high-contrast and high-saturation images reinforce expectations of food texture; for example, increased brightness can make food appear fresher, while rich colors may amplify perceptions of sweetness or saltiness [19]. Additionally, reference [28] emphasized that the visual expressiveness of food images not only affects immediate purchasing decisions but also shapes long-term brand perceptions. For instance, smooth and glossy surfaces often convey a sense of premium quality, whereas low-resolution images may undermine consumer trust in food quality.
Notably, reference [32] pointed out that visual attributes such as color, texture, and shape can trigger synesthesia-like responses, meaning that consumers infer food texture and flavor based on visual cues. For example, red is commonly associated with sweetness, while darker-colored foods may suggest a richer taste. This indicates that in the food delivery industry, visual elements not only form consumers’ first impressions but may also influence final purchasing decisions through crossmodal effects.
2.3. Key research in the food delivery industry
Current research in the food delivery industry primarily focuses on consumer behavior, algorithm optimization, and food safety [34]. Key factors that influence consumer decision-making include delivery speed, service quality, price sensitivity, and food hygiene. For instance, reference [35] developed a graph neural network (GNN) model and found that reducing expected delivery time by just 10 minutes can increase the order conversion rate by up to 18%. Additionally, reference [34] reported that displaying well-sealed food packaging images significantly boosts consumer trust in hygiene, with hygiene ratings improving more than twofold.
In terms of visual presentation, reference [23] discovered that warm-toned and highly saturated food images evoke pleasant emotions, which in turn reduce price sensitivity and increase purchase motivation. Cultural differences also play an important role. Reference [36] found that users from different cultural backgrounds perceive menu complexity differently, with Asian consumers showing fewer negative reactions to complex menus than Western users.
As visual marketing becomes more important on food delivery platforms such as Uber Eats, the quality of food images is gaining more attention. Studies show that high-resolution, high-contrast, and well-composed menu images can significantly boost click-through rates (CTR) and order conversions [4]. Moreover, incorporating visual features into personalized recommendation systems has been shown to improve CTR by over 21%, highlighting the strong impact of image-driven signals on user engagement [37]. While artificial intelligence (AI)-generated food images are effective at attracting new users, user-generated, real-life food photos have been found to be more effective in encouraging repeat purchases [38].
Based on the synthesis of prior research, this study identifies three key visual dimensions—composition, color, and figure-ground relationship—as potential drivers of consumer engagement. Accordingly, the following hypotheses are formulated:
Hypothesis 1. On the Uber Eats platform, restaurant food images with optimized visual attributes—particularly those featuring pronounced texture difference and high color saturation, while avoiding excessively high brightness contrast—can significantly increase order volume.
Hypothesis 2. The impact of visual composition optimization (such as applying the rule of thirds and enhancing visual balance intensity) is more substantial for high-ticket restaurants, whereas the effect is relatively weaker for low-ticket restaurants.
2.4. Theoretical framework and hypotheses
Building on visual saliency theory [39] and authenticity heuristics [6], we hypothesize that image attributes related to visual prominence—such as Texture Difference and Saturation—positively influence consumer engagement by capturing attention and stimulating sensory perception. Conversely, attributes that appear overly artificial or curated—such as rule-of-thirds composition or excessive Image Clarity—may undermine consumer trust and reduce behavioral responses, especially in food-related contexts where “edible authenticity” is valued over visual perfection.
The table below maps each image attribute to its corresponding theoretical role and expected effect direction:
|
Image Feature |
Theoretical Lens |
Underlying Mechanism |
Expected Effect |
|
Texture Difference |
Visual Saliency Theory |
Visual complexity enhances attention and appetitive cues |
Positive |
|
Saturation |
Sensory Imagery Perspective |
Vivid colors simulate freshness and taste |
Positive |
|
Warm hue |
Color Psychology |
Warm colors evoke comfort, familiarity |
Positive (weaker) |
|
Brightness |
Visual Saliency / Aesthetic |
Brighter visuals increase perceived cleanliness |
Positive (weak/moderate) |
|
Image Clarity |
Authenticity Heuristic |
Overly sharp images may appear artificial or edited |
Negative |
|
Rule of Thirds |
Authenticity Heuristic |
Highly structured compositions may look “over-staged” |
Negative |
|
Size Difference |
Figure-Ground Contrast |
Subtle differences improve focal clarity; extremes may confuse viewers |
Curvilinear or Negative |
|
Color Difference |
Visual Attention Cue |
Strong contrast can signal object salience |
Neutral to Positive |
|
Brightness Contrast |
Cognitive Load Theory |
High contrast may increase visual strain |
Negative (in overload) |
|
Visual Balance (Color) |
Aesthetic Harmony |
Color symmetry supports aesthetic judgment |
Weak Positive or Neutral |
|
Visual Balance (Intensity) |
Aesthetic Harmony |
Symmetrical layout may look “too perfect” under low-trust conditions |
Weak Positive or Neutral |
|
Diagonal Dominance |
Composition Aesthetics |
Diagonal structures can guide eye movement but may seem artificial |
Mixed |
In summary, visual elements do much more than just enhance appearance—they play a critical role in shaping consumers’ immediate purchasing behavior, building brand perception, strengthening trust, and ultimately driving the long-term competitiveness of food delivery platforms.
3. Data
3.1. Data source and structure
In this study, the unit of observation is defined at the restaurant × city level, meaning each record represents the operational status of a specific restaurant in a specific city on the Uber Eats platform. The dataset encompasses various dimensions of information, including basic restaurant attributes, platform display content, user review data, pricing strategies, and promotional activity indicators. For each restaurant, we collected its name, address, and a direct URL to its Uber Eats page. Through this link, we accessed and extracted the first image shown to users on the platform, which typically serves as the restaurant's primary visual display.
The primary dependent variable in our study is restaurant sales performance. As actual transaction-level data is not publicly accessible on the Uber Eats platform, we follow established literature by using online review volume as a proxy. Prior studies have shown that Review Countis highly correlated with actual purchase behavior in digital marketplaces, particularly when no explicit sales figures are available [40,41]. This proxy has been widely applied in platform research to approximate consumer demand. To further enhance its validity, we control for potential confounding factors such as average rating, promotion presence, and delivery time, and conduct robustness checks to ensure that the proxy does not introduce systematic bias.
The key independent variables are visual features derived from each restaurant’s first displayed image. These features are extracted using computer vision techniques and are conceptually grouped into three dimensions (see Section 3.2 for details). Drawing on prior studies that underscore the persuasive power of food visuals in digital settings [42], we examine how Composition, Color, and Figure-Ground Relationship influence user engagement.
To improve the model’s explanatory power, we also include several control variables: the restaurant’s average price level, estimated delivery time, and whether promotional tags are displayed. These factors have been shown to influence consumer decision-making [30], and are thus included to isolate the effect of visual image attributes more accurately.
3.2. Image feature construction and extraction
3.2.1. Selection of cover images
In food delivery platforms, images often serve as the first point of consumer interaction and play a critical role in shaping initial impressions. A growing body of research has shown that visual stimuli—such as clarity, composition style, and color dynamics—can significantly influence consumer attention, perceived quality, and purchase decisions [43,44]. In this study, we focus on the primary display image of each restaurant as shown on the Uber Eats platform, since this image is the most prominent and typically appears in search results and menu previews. Visual features of this image are expected to directly impact user engagement and click-through behavior [44].
Figure 1 presents a typical interface from the Uber Eats homepage. Cover images are centrally featured and often accompanied by promotional tags, emphasizing their combined influence on consumer decision-making.
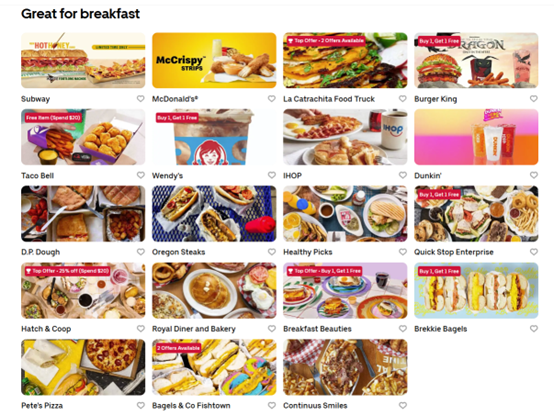
We extract twelve visual attributes from each restaurant’s primary image using computer vision techniques (see Figure 1). These features are theoretically grounded and categorized into three perceptual dimensions—composition, color, and figure-ground relationship—which are commonly studied in visual cognition, digital marketing, and hospitality research [10,23].
3.2.1.1. Composition
This dimension captures the spatial arrangement of elements in the image, which influences perceived harmony, visual guidance, and aesthetic coherence.
(1)Diagonal Dominance
Diagonal Dominance is known to guide the viewer’s eye more dynamically. This feature quantifies the alignment of visual components along the diagonals of the image by comparing gradient energy along diagonal versus non-diagonal paths, computed using Sobel filters. Diagonally composed images have been shown to enhance visual flow and capture attention more effectively [6,45].
(2)Rule of Thirds
This feature measures how well the main food subject aligns with the intersections of a 3×3 compositional grid, following the classic Rule of Thirds. Adherence to this compositional principle has been associated with longer viewing times, better user engagement, and more favorable impressions in food-related content [10,15].
(3)Visual Balance Intensity
This feature evaluates the symmetry and distribution of Brightness and contrast across the image. A well-balanced image conveys a sense of professional quality and stability. The metric is derived from spatial analysis of luminance and pixel contrast [5,46].
(4)Visual Balance Color
Color balance is assessed by comparing average RGB values across different image regions. Harmoniously distributed colors contribute to a more aesthetically pleasing experience and enhance the perceived reliability and quality of the food [24,46].
3.2.1.2. Color
This dimension reflects the emotional and sensory appeal of the image through its chromatic and luminance properties, both of which play a critical role in triggering appetite and emotional response.
(5)Warm Hue
Color temperature, particularly warm hues, plays a pivotal role in appetite stimulation and emotional priming. This metric calculates the proportion of warm-colored pixels (e.g., red, orange, yellow) based on HSV color space transformation. Warm hues are known to stimulate appetite, induce emotional warmth, and drive consumer interest in food imagery [22,23].
(6)Saturation
Saturation measures the intensity and vividness of colors. We calculate average pixel Saturation to assess how vibrant the image appears. High Saturation levels have been linked to greater perceived freshness, tastiness, and higher visual appeal [19,23].
(7)Brightness
Brightness is defined as the average pixel luminance after converting the image to grayscale. Brighter images tend to convey cleanliness and freshness, which are positively correlated with purchase intent in food-related contexts [23].
(8)Brightness Contrast
This feature captures the variation between light and dark regions in the image, measured as the standard deviation of grayscale values. Appropriate Brightness Contrast improves visual readability and product distinctiveness. However, excessive Brightness Contrast—manifested as dramatic luminance differences—can induce visual discomfort and reduce interpretability, as described in studies of indoor lighting and glare [47,48].
(9)Image Clarity
This feature captures the sharpness and fine-grained details of the image, which are essential for accurate food recognition. It is quantified using the Canny edge detection algorithm, with the proportion of edge pixels serving as a proxy for clarity. Higher clarity has been shown to enhance perceived product quality and influence consumer decision-making [49].
3.2.1.3. The figure-ground relationship
This dimension focuses on how distinctly the food stands out from its background, which directly affects visual salience, user attention, and interpretability of the image.
(10)Size Difference
This metric evaluates the Size Difference between different objects in the image—particularly between the food and its surrounding elements. Object sizes are standardized based on contour detection algorithms, allowing us to quantify the relative prominence of the food item within the frame. Prior research suggests that larger visual representations of food lead to higher visual dominance and greater appeal [10,50].
(11)Color Difference
This feature measures the Color Difference between the food and its background, computed in LAB color space for perceptual accuracy. Strong color separation helps the food stand out, attracts user attention, and enhances visual clarity [19,30].
(12)Texture Difference
Texture Difference is captured using features from the Gray-Level Co-occurrence Matrix (GLCM), such as contrast and homogeneity. Rich and distinct textural differences between foreground and background increase visual interest, convey freshness, and encourage consumer engagement [51,52].
3.2.2. Feature distribution overview
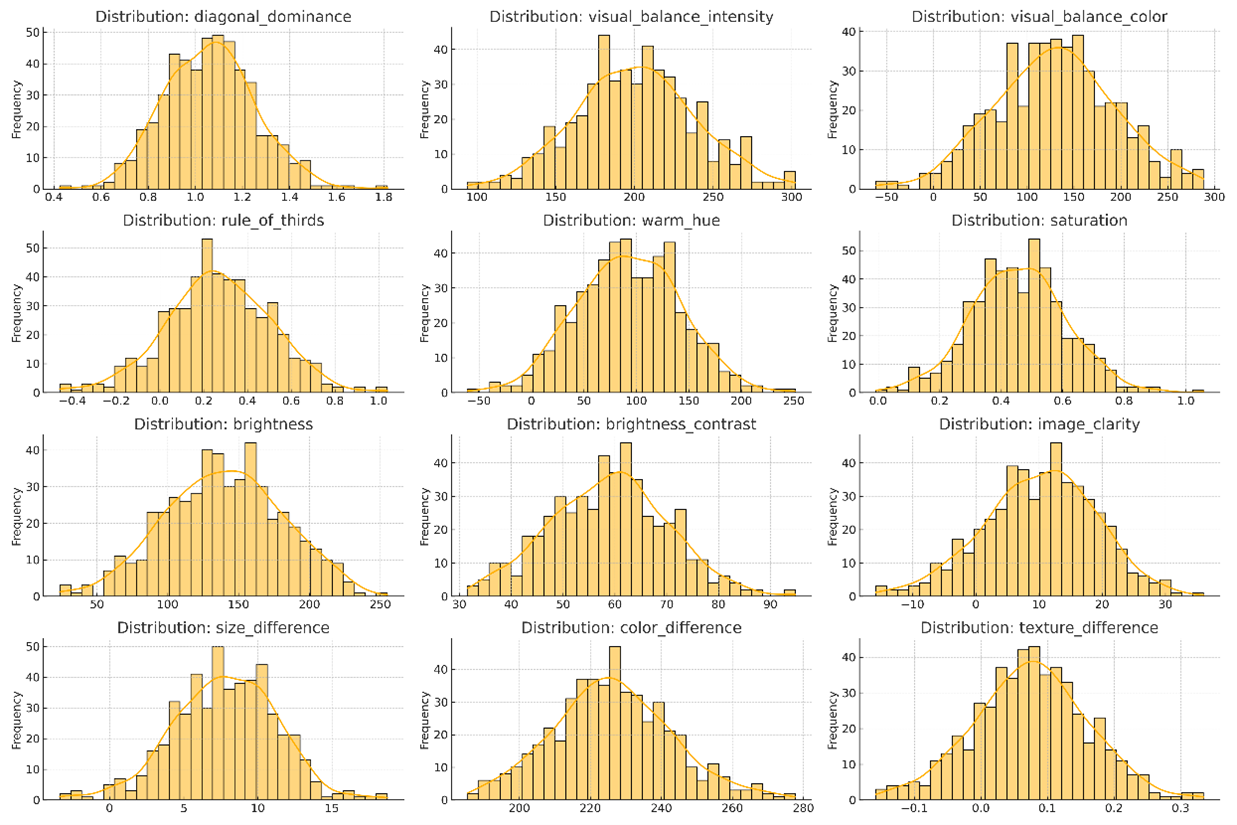
Figure 2 displays the distribution of the twelve extracted visual features across all restaurants in the dataset. Most features exhibit relatively concentrated, bell-shaped distributions, indicating shared visual practices among restaurants on the Uber Eats platform. However, certain variables—such as Warm Hue, Brightness, and Color Difference—show signs of skewness or outliers, reflecting stylistic variation in image design. Understanding these distributions is essential for proper feature scaling, identifying non-linear relationships, and informing model specification in subsequent regression analysis.
3.3. Summary statistics
3.3.1. Platform field statistics
This study analyzes 1,538 restaurants listed on the Uber Eats platform. To better understand differences in performance, structure, and visual presentation, we carried out a basic statistical analysis of both platform-related variables (such as review count and promotion) and image features (such as composition, color, and figure-ground relationship).
Restaurants received an average of 31.49 reviews (SD = 13.32), with a long-tail distribution—most have review numbers close to the average, while a few popular ones have far more.
Only 13.96% of restaurants showed promotions, based on whether the text included phrases like “Spend $25, Save $5” or “Free Item.” This suggests that Promotions are not common on the platform and are mostly used by individual restaurants. This aligns with [10] found: that promotions can increase clicks and purchases.
When we examined the twelve image features, we found notable variations in how restaurants visually present their food. For instance, diagonal dominance and rule of thirds showed relatively large standard deviations (0.1961 and 0.2444), indicating differences in visual quality and style. Many images seem casually taken without refined composition, which connects to Gestalt psychology’s principle of “good continuation,” where diagonal dominance helps guide visual attention [53].
Warm hue values reach as high as 237.75, suggesting that many restaurants use warm color tones to enhance food appeal. Brightness (mean = 140.63) and brightness contrast (mean = 59.10) are also relatively high, indicating that most images are well-lit and visually prominent. This supports reference [54], who highlight the importance of light-dark contrasts in fast-scrolling environments.
Image clarity also varies substantially (mean = 10.96, range = 0.12–59.95), implying that while some photos are sharply focused, others are blurry. Reference [22] suggests that clearer images may foster greater trust, potentially influencing ordering behavior.
We also observed wide variation in texture difference and size difference between the food and background, indicating different levels of visual emphasis. According to [10], clear and focused images can facilitate quicker decision-making on visually crowded platforms.
In short, both platform data and image features exhibit considerable heterogeneity across restaurants, providing a foundation for further modeling and analysis. Descriptive statistics are summarized in Table 2.
|
Variables |
Obs |
Mean |
Std_Dev |
Min |
Max |
|
Review Count |
1538 |
31.4915 |
13.3192 |
11 |
98 |
|
Diagonal Dominance |
1538 |
1.0609 |
0.1961 |
0.46 |
2.26 |
|
Visual Balance Intensity |
1538 |
199.4790 |
39.0542 |
56.89 |
314.19 |
|
Visual Balance Color |
1538 |
122.6903 |
63.5418 |
0 |
448.52 |
|
Rule of Thirds |
1538 |
0.2629 |
0.2444 |
0 |
1 |
|
Warm hue |
1538 |
93.1762 |
50.9299 |
0.01 |
237.75 |
|
Saturation |
1538 |
0.4533 |
0.1549 |
0.04 |
0.91 |
|
Brightness |
1538 |
140.6290 |
39.8743 |
6.52 |
249.28 |
|
Brightness Contrast |
1538 |
59.1048 |
11.0127 |
23.9 |
110.26 |
|
Image Clarity |
1538 |
10.9620 |
8.8975 |
0.12 |
59.95 |
|
Size Difference |
1538 |
7.8020 |
3.5122 |
0 |
21.85 |
|
Color Difference |
1538 |
226.8642 |
17.3382 |
189 |
282.3 |
|
Texture Difference |
1538 |
0.0800 |
0.0816 |
0 |
1 |
4. Model
4.1. Main effect of images features on sales
To systematically evaluate how visual features influence consumer engagement, we focus on review count as the primary outcome variable. Review count is widely used as a proxy for restaurant sales performance on digital platforms, given its high correlation with consumer purchasing behavior [40,41]. We apply multiple linear regression models to examine this relationship. This method ensures structural clarity and interpretability while being computationally efficient, making it suitable for large-scale platform data [55,56].
To address the right-skewed distribution of review count, we apply a logarithmic transformation. The key explanatory variables are twelve standardized image features extracted from each restaurant’s main image—such as brightness, image clarity, diagonal dominance, and texture difference. We also include a binary variable indicating whether a promotion is shown (1 = promotion, 0 = none).
To isolate the effects of image features from other observable restaurant characteristics, we introduce a set of control variables. Specifically, we account for the average price tier of the restaurant and the estimated delivery time displayed on the platform—both of which are visible to users and may independently influence engagement. These variables help disentangle visual influence from operational and pricing-related factors.
Given that many unobserved but stable restaurant-level attributes (e.g., location, brand reputation, chain status) may confound the results, we incorporate restaurant fixed effects. This controls for within-restaurant variation and improves the causal interpretation of visual effects. The baseline regression model is expressed as:
We estimate the following fixed-effects model to capture within-restaurant variation in visual strategies:
Where
Our choice of linear regression is grounded in three main considerations. First, the key independent variables are twelve standardized visual features extracted from each restaurant’s cover image, capturing aspects such as brightness, image clarity, diagonal dominance, and texture difference. Second, we include a binary indicator for promotion (1 = promotion shown, 0 = none), as promotional visibility may confound image effectiveness. Finally, we control for non-visual attributes shown on the platform, including estimated delivery time and average price tier. These controls help isolate the visual effects from operational or pricing-related influences.
Our use of linear regression is based on its interpretability and ability to estimate marginal effects—allowing platforms and merchants to identify which visual strategies most effectively enhance consumer engagement.
To ensure the robustness of our model, we conduct several diagnostic tests. Variance inflation factors (VIF) are used to detect multicollinearity, while the Shapiro-Wilk and Breusch-Pagan tests assess residual normality and heteroscedasticity, respectively. Model fit is evaluated using both R2 and adjusted R2, and five-fold cross-validation is applied to assess generalizability. Together, these checks confirm that our model is statistically sound and practically informative. These diagnostic procedures are aligned with best practices in econometrics and statistical modeling [57,58], ensuring the validity and generalizability of the model.
4.2. The moderation effect of promotion on image features to sales
To further explore whether promotion moderates the relationship between image features and restaurant performance, we extend the base model by introducing interaction terms between each visual feature and the promotion variable, resulting in the following moderation model:
This approach allows us to assess whether the effectiveness of visual strategies changes depending on the promotional context. For instance, certain image features such as texture or saturation may become more (or less) salient when accompanied by a discount.
As in the baseline model, we include the same control variables—estimated delivery time and price tier—and apply restaurant fixed effects to account for unobserved heterogeneity. All VIF values remain below 4, and residual diagnostics confirm the model's validity. The adjusted R2 of 0.214 indicates reasonable explanatory power given the inclusion of fixed effects and multiple interaction terms.
These findings provide empirical support for visual-marketing interaction effects. While sensory-rich features such as saturation or texture enhance performance under both conditions, other elements (e.g., structured composition or overly clear images) may trigger skepticism in the presence of promotions—highlighting the nuanced dynamics between visual design and consumer trust.
4.3. Robustness check
To assess the robustness of our findings against extreme values and non-normal residuals, we re-estimate the main-effects model using Huber regression, which down-weights the influence of outliers by applying a piecewise loss function. This approach offers a more conservative view of marginal effects, especially in the presence of a heavy-tailed outcome distribution.
As shown in Table 3, most coefficients shrink substantially in magnitude compared to the OLS estimates, and the overall model fit decreases sharply (R²=–0.028). For instance, while OLS suggests that features like Texture Difference, Saturation, and Visual Balance Intensity are significant drivers of review count, their effects vanish under Huber regression.
These results suggest two key insights. First, review count on Uber Eats exhibits a heavy-tailed distribution, where a small number of high-performing restaurants account for a large share of consumer engagement. Second, the influence of visual features may be amplified among top-ranked restaurants with greater exposure, but appear negligible for average merchants once outliers are adjusted.
In this light, Huber regression does not contradict our earlier findings; rather, it situates them within platform dynamics, highlighting that visual strategies may have context-dependent effectiveness. Merchants seeking to optimize imagery should recognize that visual refinement alone may not offset structural exposure disparities.
|
Image Feature |
OLS Coefficient |
Huber Coefficient |
|
Brightness |
0.0046 |
–1.00e–08 |
|
Image_Clarity |
–0.0003 |
5.68e–10 |
|
Diagonal_Dominance |
0.0006 |
9.25e–11 |
|
Texture_Difference |
0.0467 |
1.77e–09 |
|
Saturation |
–0.0584 |
–6.81e–09 |
|
Visual_Balance_Intensity |
–0.0661 |
1.33e–08 |
|
Visual_Balance_Color |
–0.0317 |
–3.29e–09 |
|
Warm_Hue |
0.0380 |
3.66e–09 |
|
Rule_of_Thirds |
–0.0395 |
3.89e–10 |
|
Brightness_Contrast |
0.0257 |
–6.39e–09 |
|
Size_Difference |
–0.0320 |
–8.86e–10 |
|
Color_Difference |
0.0265 |
–2.23e–09 |
5. Results
5.1. Main effects of image attributes
To examine the effects of visual features on restaurant performance, we estimate a linear regression model that includes both main effects and interactions with promotion, controlling for restaurant fixed effects.
Tables 4 and 5 present the regression results. Table 4 reports the main effects of image attributes on review count, while Table 5 presents their interactions with promotion.
We find that several visual features—such as Texture Difference, Saturation, and Image Clarity—show statistically significant associations with consumer engagement, either positively or negatively.
The following discussion elaborates on these findings, highlighting how different image attributes shape restaurant performance, both independently and in combination with promotional cues.
|
Variable |
Coefficient |
Standard Error |
|
Diagonal Dominance |
30.5497*** |
(7.446) |
|
Visual Balance Intensity |
-0.0603 |
(0.213) |
|
Visual Balance Color |
-0.0498 |
(0.088) |
|
Rule of Thirds |
-48.6377*** |
(7.989) |
|
Warm Hue |
-0.0601 |
(0.045) |
|
Saturation |
30.3171** |
(15.319) |
|
Brightness |
0.2440 |
(0.163) |
|
Brightness Contrast |
-0.2503 |
(0.243) |
|
Image Clarity |
-2.8187*** |
(0.468) |
|
Size Difference |
-3.4223*** |
(0.706) |
|
Color Difference |
-0.3979 |
(0.486) |
|
Texture Difference |
523.7679*** |
(74.072) |
|
Interaction Term |
Coefficient |
Std. Error |
|
Diagonal Dominance × Promotion |
-1406.9096 |
(2521.072) |
|
Visual Balance Intensity × Promotion |
-232.3142 |
(421.674) |
|
Visual Balance Color × Promotion |
8.8785 |
(15.648) |
|
Rule of Thirds × Promotion |
-2.1419 |
(30.637) |
|
Warm Hue × Promotion |
-2.2271 |
(3.388) |
|
Saturation × Promotion |
-5483.1090 |
(9849.262) |
|
Brightness × Promotion |
205.0337 |
(372.041) |
|
Brightness Contrast × Promotion |
218.1351 |
(395.114) |
|
Image Clarity × Promotion |
-180.7738 |
(350.862) |
|
Size Difference × Promotion |
-36.6132 |
(66.707) |
|
Color Difference × Promotion |
25.1692 |
(46.489) |
|
Texture Difference × Promotion |
18320.0000 |
(35700.000) |
|
Promotion (Dummy) |
2645.8171 |
(4654.302) |
|
Restaurant Fixed Effects |
Yes |
|
|
Observations |
1538 |
|
|
Adjusted R² |
0.214 |
We find that several image features have statistically significant effects on restaurant performance, as measured by review count. Most notably, Texture Difference shows a strong positive association with Review Count(β = 523.77, p < 0.001), suggesting that visual complexity and richness in texture can effectively capture consumer attention. This aligns with visual saliency theory, which posits that prominent visual features are more likely to draw viewer focus [39].
Saturation also demonstrates a significant positive effect (β = 30.32, p = 0.009), supporting the sensory imagery perspective—vivid colors can stimulate perceptions of freshness or taste, thereby enhancing purchase intentions [24,30].
In contrast, both Image Clarity and the Rule of Thirds composition exhibit significant negative effects (both p < 0.001). These results suggest that overly sharp or carefully structured images may be perceived as too artificial or curated, diminishing perceived authenticity and trust [59]. This finding supports the authenticity heuristic, which posits that consumers may prefer more natural, less-edited visuals, especially in food-related contexts [6].
Similarly, Size Difference—the contrast in scale between food and background—may reduce effectiveness if the focal item appears overwhelmed by its surroundings, or if the image lacks a clear figure-ground structure, impeding cognitive processing of the product.
Together, these findings highlight a key insight: the effectiveness of image features depends not only on visual appeal, but also on how they align with user expectations in fast-paced, low-involvement decision settings. Features that suggest realism, texture, and naturalness appear more effective than those associated with visual perfection or editorial curation.
5.2. Moderating effects of promotion
While visual features independently influence consumer behavior, their effects are not uniform across contexts. Promotions, in particular, act as moderating signals that shape how users interpret visual stimuli. Table 5 reports the interaction terms between image attributes and promotion, illustrating how the persuasive power of visual elements shifts in discounted settings.
The interaction regression results in Table 5 show that the influence of visual features on review count varies significantly depending on whether a promotion is present. Some features become more persuasive under discounts, while others lose their effectiveness—or even show negative effects. This reflects a shift in consumer interpretation of visual cues: under discounted conditions, users focus more on signals of authenticity and value, rather than idealized marketing visuals [24,60]. While the main effect of promotion itself is not statistically significant, its interactions with visual features substantially alter their influence on consumer engagement.
Notably, the interaction between Texture Difference × promotion is significantly positive (β = 18320.00, p < 0.01), indicating that food images with stronger Texture Difference perform better when combined with a discount. This effect likely stems from a dual-signal mechanism, where texture difference implies richness and realism, while promotion signals affordability. Together, they enhance the impression that the food is both desirable and worth its price [61]. This finding echoes [10], who showed that authentic-looking images led to greater consumer engagement when combined with price incentives.
In contrast, although the interaction terms for Saturation × Promotion and Image Clarity × Promotion are both negative (β = -5483.11 and -180.77), these effects are statistically insignificant. The pattern may hint that over-edited images—those that are too vivid or sharp—could raise doubts about freshness or authenticity, especially when paired with discounts. This aligns with the theory of visual signal conflict, where polished images contradict pricing cues and lead to consumer resistance [62].
From a practical standpoint, restaurants running promotions should emphasize textured, warm-toned, and natural-looking food images. Visuals that appear both appetizing and authentic are more persuasive than overly edited or idealized ones. Excessive editing—especially in discounted settings—may undermine brand credibility.
Taken together, these findings suggest that image aesthetics function as contextual signals whose persuasive power depends on surrounding price cues. Businesses should therefore optimize visual content not only for attractiveness but also for perceived authenticity—a critical factor during promotional campaigns.
5.3. Visual features: relative impact on engagement
To provide an intuitive comparison of the relative importance of each image feature, Figure 3 presents the standardized regression coefficients and their standard errors based on our main-effects model. Standardization allows us to evaluate which visual features exert stronger marginal impacts on review count—used here as a proxy for sales performance. Error bars denote 95% confidence intervals.
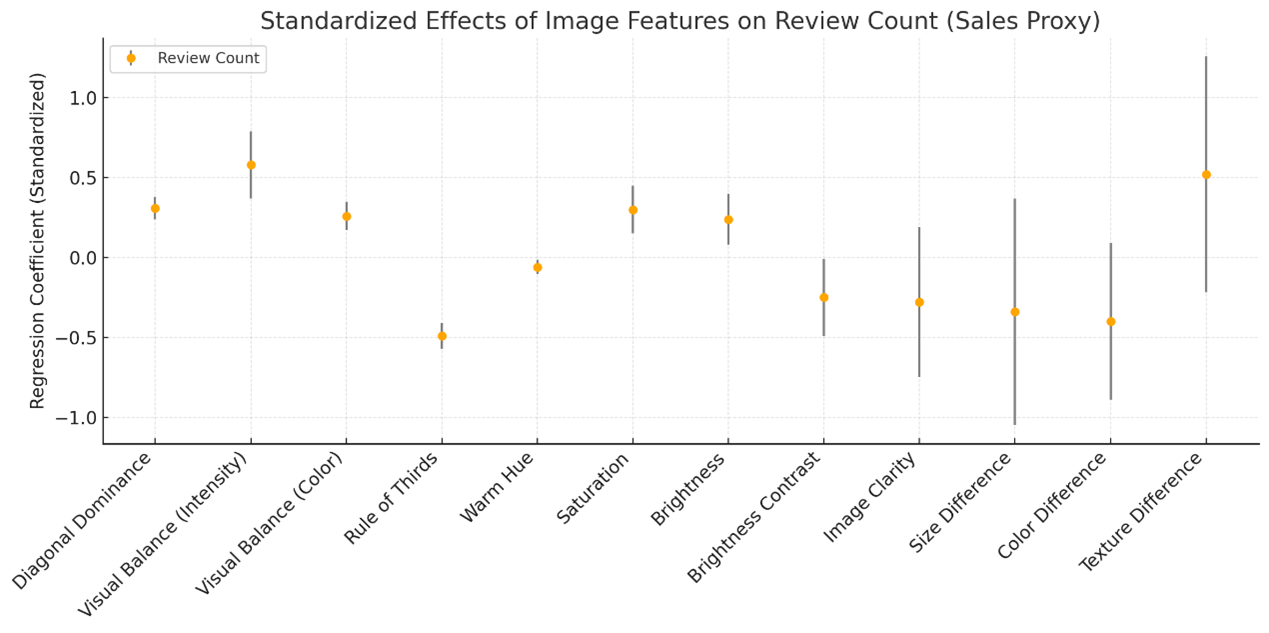
As shown in Figure 3, several sensory-oriented attributes—including texture difference, saturation, and brightness—exhibit relatively strong and consistent effects. These findings lend empirical support to Hypothesis 1, suggesting that image features conveying visual vividness and surface richness play a dominant role in attracting consumer attention and boosting engagement [24,63]. In contrast, brightness contrast shows a weaker or negative effect, consistent with the idea that overly high contrast may induce discomfort or reduce clarity.
Interestingly, compositional features, such as the rule of thirds and visual balance (intensity), show mixed or negligible effects in the main-effects model. However, since Hypothesis 2 posits a moderating role of price tier on the effectiveness of composition optimization, these patterns should be interpreted with caution and further tested in the interaction model (see Section 5.4).
6. Conclusion
This study draws on a dataset of 1538 restaurants from the Uber Eats platform, combining computer vision analysis and econometric modeling to systematically examine how 12 visual features of restaurant cover images—such as Image Clarity, Saturation, and Texture Difference—affect sales. Our findings suggest that aesthetically pleasing images do not always lead to better performance. In fact, photos that are overly sharp or heavily composed can trigger skepticism among users. This aligns with the work of [24], who found that overly saturated food images may reduce perceived authenticity and, in turn, consumer trust.
By contrast, images that appear warm in tone, rich in texture, and naturally styled are more likely to attract clicks and drive orders. When promotions are present on the page, the way users respond to visuals also changes. Features that convey realism—such as strong texture—become even more persuasive under discount conditions, enhancing the perception of value. On the other hand, features like high saturation may backfire, as users begin to question whether the image is overly edited or misleading [64].
From a theoretical perspective, this study brings the topic of how images influence consumer behavior into the context of food delivery platforms—a setting where decisions are made quickly, user attention is brief, and cover images matter more than text. We find that aesthetic principles that work well in traditional e-commerce or hotel booking platforms—such as symmetric composition, high definition, or bright lighting—do not necessarily apply here, and may even backfire [64,65]. This extends existing visual persuasion theories and offers a new lens for understanding consumer behavior in mobile-first, image-driven environments [66].
From a practical perspective, our findings offer clear guidance for restaurant owners, marketers, and platform designers. When it comes to attracting real orders—not just likes—overly edited or perfectly polished food images may backfire. Studies have shown that highly saturated visuals, especially when paired with discounts, can reduce consumers' sense of authenticity and raise doubts about quality [24]. Instead, images that appear warm in tone, close-up, naturally lit, and rich in texture are more effective in drawing user attention and prompting action [64]. Platforms can leverage these features to enhance recommendation algorithms and improve both user experience and conversion rates. Above all, building visual trust is essential—users respond better when promotions feel real and the visuals reflect that consistency [60].
Of course, this study has its limitations. We used Review Count as a proxy for sales, which, while common, is still an indirect measure. Also, all image features were extracted algorithmically—future research could combine user gaze data or A/B tests to better understand what truly catches attention. Lastly, cultural preferences matter: what works in the U.S. might not work in China or Japan. Future research can explore regional or cross-cultural differences in food image preferences.
Building on these insights, we propose the concept of “Edible Authenticity” to describe a perceptual mechanism by which consumers favor food images that convey naturalness, realism, and textural integrity over visual perfection. In fast-paced, mobile-first food delivery environments, images that appear overly polished may disrupt trust or suggest artificiality. By contrast, visuals that reflect sensory realism—such as warm tones, visible textures, and organic layouts—activate both emotional engagement and perceived credibility. This concept bridges visual aesthetics with cognitive fluency and authenticity heuristics, offering a novel framework for understanding consumer responses to food imagery. Future research can further develop this construct and test its applicability across platforms, cuisines, and cultural contexts.
References
[1]. Vasan, S., Rao, A. A., & Gupta, N. (2025). Investigating the opportunities and challenges influencing consumer purchase behaviors and media influence in online food ordering: a thematic analysis. British Food Journal, 127(6), 1984-1998.
[2]. The Times. (2024, October 31). Uber takes hit as weekend customers spoil the party. Retrieved June 20, 2025, from https: //www.thetimes.com/business-money/technology/article/uber-takes-hit-as-weekend-customers-spoil-the-party-9g385bwqj?region=global
[3]. Avery, J. A., Carrington, M., Ingeholm, J. E., Darcey, V., Simmons, W. K., Hall, K. D., & Martin, A. (2025). Automatic engagement of limbic and prefrontal networks in response to food images reflects distinct information about food hedonics and inhibitory control.Communications Biology, 8(1), 270.
[4]. Dong, Yifan, et al. "The effect of picture attributes of online ordering pages on visual attention and user experience."International Journal of Industrial Ergonomics96 (2023): 103477.
[5]. Lee, Jinha, and Heejin Lim. "Visual aesthetics and multisensory engagement in online food delivery services."International Journal of Retail & Distribution Management51.8 (2023): 975-990.
[6]. Zhang, M., & Luo, L. (2023). Can consumer-posted photos serve as a leading indicator of restaurant survival? Evidence from Yelp.Management Science, 69(1), 25-50.
[7]. Leyssen, M. H., Linsen, S., Sammartino, J., & Palmer, S. E. (2012). Aesthetic preference for spatial composition in multiobject pictures.i-Perception, 3(1), 25-49.
[8]. Satcharoen, K. (2017, November). The influence of colour on intention to adopt food delivery service mobile app. InProceedings of the 3rd International Conference on Communication and Information Processing(pp. 87-91).
[9]. Sari, N. L. D. I. D., Negara, I. N. S., & Dewi, A. K. (2018, November). Packaging Design Of Betutu Chicken Special Merchandise From Bali. In3rd International Conference on Creative Media, Design and Technology (REKA 2018)(pp. 108-112). Atlantis Press.
[10]. Zhang, S., Lee, D., Singh, P. V., & Srinivasan, K. (2022). What makes a good image? Airbnb demand analytics leveraging interpretable image features.Management Science, 68(8), 5644-5666.
[11]. Vermeir, I., & Roose, G. (2020). Visual design cues impacting food choice: A review and future research agenda.Foods, 9(10), 1495.
[12]. Bajari, P., Cen, Z., Chernozhukov, V., Manukonda, M., Vijaykumar, S., Wang, J., ... & Wan, S. (2023). Hedonic prices and quality adjusted price indices powered by AI.arXiv preprint arXiv: 2305.00044.
[13]. Saad, A. T. (2021). Factors affecting online food delivery service in Bangladesh: an empirical study.British Food Journal, 123(2), 535-550.
[14]. Vindytia, M., & Balqiah, T. E. (2024). AI Marketing Impact on Consumer Behavior: An SOR Model Analysis of Online Food Delivery Services.JDM (Jurnal Dinamika Manajemen), 15(2), 215-228.
[15]. Amirshahi, S. A., Hayn-Leichsenring, G. U., Denzler, J., & Redies, C. (2014). Evaluating the rule of thirds in photographs and paintings.Art & Perception, 2(1-2), 163-182.
[16]. Gritz, W., Hoppe, A., & Ewerth, R. (2025, April). Unraveling the Impact of Visual Complexity on Search as Learning. InEuropean Conference on Information Retrieval(pp. 17-33). Cham: Springer Nature Switzerland.
[17]. Li, J., Xu, L., Tang, L., Wang, S., & Li, L. (2018). Big data in tourism research: A literature review.Tourism management, 68, 301-323.
[18]. Xiang, Z., Du, Q., Ma, Y., & Fan, W. (2017). A comparative analysis of major online review platforms: Implications for social media analytics in hospitality and tourism.Tourism Management, 58, 51-65.
[19]. Obrist, M. (2021). Multisensory Experiences: Where the Senses Meet Technology. InHuman-Computer Interaction–INTERACT 2021: 18th IFIP TC 13 International Conference, Bari, Italy, August 30–September 3, 2021, Proceedings, Part I 18(pp. 9-13). Springer International Publishing.
[20]. Ma, B., Wong, Y. D., Teo, C. C., & Sun, S. (2024). Quantifying consumers’ cost-value trade-offs on on-demand food delivery services: Value-of-time framework and partitioned pricing.Journal of Retailing and Consumer Services, 81, 104027.
[21]. Tavitiyaman, P., Tsang, W. S. L., & Lo, S. K. J. (2024). Customers’ perceived values and purchase intention through satisfaction: Differences based on food delivery application platform and buying power.International Journal of Hospitality & Tourism Administration, 25(4), 709-737.
[22]. Chatterjee, A. (2003). Prospects for a cognitive neuroscience of visual aesthetics.
[23]. Spence, C., Okajima, K., Cheok, A. D., Petit, O., & Michel, C. (2016). Eating with our eyes: From visual hunger to digital satiation.Brain and cognition, 110, 53-63.
[24]. Liu, S. Q., Wu, L. L., Yu, X., & Huang, H. (2022). Marketing online food images via color saturation: A sensory imagery perspective.Journal of business research, 151, 366-378.
[25]. Thorud, H. M. S., Helland, M., Aarås, A., Kvikstad, T. M., Lindberg, L. G., & Horgen, G. (2012). Eye-related pain induced by visually demanding computer work.Optometry and vision science, 89(4), E452-E464.
[26]. Garber Jr, L. L., Hyatt, E. M., & Starr Jr, R. G. (2000). The effects of food color on perceived flavor.Journal of Marketing Theory and Practice, 8(4), 59-72.
[27]. Michel, C., Velasco, C., Fraemohs, P., & Spence, C. (2015). Studying the impact of plating on ratings of the food served in a naturalistic dining context.Appetite, 90, 45-50.
[28]. Peng, Y., & JEMMOTT III, J. B. (2018). Feast for the eyes: Effects of food perceptions and computer vision features on food photo popularity.International Journal of Communication (19328036), 12.
[29]. Pieters, R., Wedel, M., & Batra, R. (2010). The stopping power of advertising: Measures and effects of visual complexity.Journal of marketing, 74(5), 48-60.
[30]. Labrecque, L. I., & Milne, G. R. (2013). To be or not to be different: Exploration of norms and benefits of color differentiation in the marketplace.Marketing Letters, 24, 165-176.
[31]. Zellner, D. A., Lankford, M., Ambrose, L., & Locher, P. (2010). Art on the plate: Effect of balance and color on attractiveness of, willingness to try and liking for food.Food Quality and Preference, 21(5), 575-578.
[32]. Delwiche, J. F. (2012). You eat with your eyes first.Physiology & behavior, 107(4), 502-504.
[33]. Lee, B. P., & Spence, C. (2022). Crossmodal correspondences between basic tastes and visual design features: A narrative historical review.i-Perception, 13(5), 20416695221127325.
[34]. Carvalho, J. S., Oliveira, J. D. S. C., & SÃO JOSÉ, J. F. B. D. (2022). Consumers’ knowledge, practices, and perceptions about conventional and sustainable food packaging.Food Science and Technology, 42, e06722.
[35]. Zhao, W., Wu, Q., Yang, C., & Yan, J. (2023). Proceedings of the 29th ACM SIGKDD Conference on Knowledge Discovery and Data Mining, KDD'23.
[36]. Lu, A. C. C., & Gursoy, D. (2015). A conceptual model of consumers’ online tourism confusion.International Journal of Contemporary Hospitality Management, 27(6), 1320-1342.
[37]. He, R., & McAuley, J. (2016, February). VBPR: visual bayesian personalized ranking from implicit feedback. InProceedings of the AAAI conference on artificial intelligence(Vol. 30, No. 1).
[38]. Azman, F. A. M., & Mustaffa, N. (2023). The impact of user generated content on food purchase intention through Tiktok platform.Al-i’lam-Journal of Contemporary Islamic Communication and Media, 3(2).
[39]. Itti, L., & Koch, C. (2000). A saliency-based search mechanism for overt and covert shifts of visual attention.Vision research, 40(10-12), 1489-1506.
[40]. Chevalier, J. A., & Mayzlin, D. (2006). The effect of word of mouth on sales: Online book reviews.Journal of marketing research, 43(3), 345-354.
[41]. Luca, M. (2016). Reviews, reputation, and revenue: The case of Yelp. com.Com (March 15, 2016). Harvard Business School NOM Unit Working Paper, (12-016).
[42]. Hou, Y., Yang, W., & Sun, Y. (2017). Do pictures help? The effects of pictures and food names on menu evaluations.International Journal of Hospitality Management, 60, 94-103.
[43]. Celona, L., Leonardi, M., Napoletano, P., & Rozza, A. (2022). Composition and style attributes guided image aesthetic assessment.IEEE Transactions on Image Processing, 31, 5009-5024.
[44]. Li, X., Wang, M., & Chen, Y. (2014). The impact of product photo on online consumer purchase intention: an image-processing enabled empirical study.
[45]. Liu, L., Chen, R., Wolf, L., & Cohen‐Or, D. (2010, May). Optimizing photo composition. InComputer graphics forum(Vol. 29, No. 2, pp. 469-478). Oxford, UK: Blackwell Publishing Ltd.
[46]. Gambetti, A., & Han, Q. (2022). Camera eats first: exploring food aesthetics portrayed on social media using deep learning.International journal of contemporary hospitality management, 34(9), 3300-3331.
[47]. Juricevic, I., Land, L., Wilkins, A., & Webster, M. A. (2010). Visual discomfort and natural image statistics.Perception, 39(7), 884-899.
[48]. Quek, G., Wienold, J., Khanie, M. S., Erell, E., Kaftan, E., Tzempelikos, A., ... & Andersen, M. (2021). Comparing performance of discomfort glare metrics in high and low adaptation levels.Building and environment, 206, 108335.
[49]. Tahir, G. A., & Loo, C. K. (2021, December). A comprehensive survey of image-based food recognition and volume estimation methods for dietary assessment. InHealthcare(Vol. 9, No. 12, p. 1676). MDPI.
[50]. Yarlagadda, S. K., Montserrat, D. M., Güera, D., Boushey, C. J., Kerr, D. A., & Zhu, F. (2021). Saliency-aware class-agnostic food image segmentation.ACM Transactions on Computing for Healthcare, 2(3), 1-17.
[51]. Ferreira, B. M. (2019). Packaging texture influences product taste and consumer satisfaction.Journal of Sensory Studies, 34(6), e12532.
[52]. Matz, S. C., Segalin, C., Stillwell, D., Müller, S. R., & Bos, M. W. (2019). Predicting the personal appeal of marketing images using computational methods.Journal of consumer psychology, 29(3), 370-390.
[53]. Wagemans, J., Elder, J. H., Kubovy, M., Palmer, S. E., Peterson, M. A., Singh, M., & Von der Heydt, R. (2012). A century of Gestalt psychology in visual perception: I. Perceptual grouping and figure–ground organization.Psychological bulletin, 138(6), 1172.
[54]. Kostyk, A., & Huhmann, B. A. (2021). Perfect social media image posts: Symmetry and contrast influence consumer response.European Journal of Marketing, 55(6), 1747-1779.
[55]. Al Maalouf, N. J., Sayegh, E., Makhoul, W., & Sarkis, N. (2025). Consumers' attitudes and purchase intentions toward food ordering via online platforms.Journal of Retailing and Consumer Services, 82, 104151.
[56]. Thalji, Z. (2022). Using Multiple linear regression model to predict The Customers’ Purchase Decision based on After-Sales Services.
[57]. Kutner, M. H., Nachtsheim, C. J., Neter, J., & Li, W. (2005).Applied linear statistical models. McGraw-hill.
[58]. Wooldridge, J. M. (2016).Introductory Econometrics: A Modern Approach 6rd ed. Cengage learning.
[59]. Long, J. A., Xiao, J., McCray, S., Ağaoğlu, E., Alajmi, A. M., Akalonu, C., & Xu, Y. Artificial Impressions: Trust and Credibility in AI-Enhanced Profile Pictures.
[60]. Pillai, S. G., Kim, W. G., Haldorai, K., & Kim, H. S. (2022). Online food delivery services and consumers' purchase intention: Integration of theory of planned behavior, theory of perceived risk, and the elaboration likelihood model.International journal of hospitality management, 105, 103275.
[61]. Qi, M., Ono, K., Mao, L., Watanabe, M., & Huang, J. (2024). The effect of short-form video content, speed, and proportion on visual attention and subjective perception in online food delivery menu interfaces.Displays, 82, 102671.
[62]. Chan, I. C. C., Chen, Z., & Leung, D. (2023). The more the better? Strategizing visual elements in social media marketing.Journal of Hospitality and Tourism Management, 54, 268-289.
[63]. Karimi, S., & Wang, F. (2017). Online review helpfulness: Impact of reviewer profile image.Decision Support Systems, 96, 39-48.
[64]. Cai, R., & Leung, X. Y. (2020). Mindset matters in purchasing online food deliveries during the pandemic: The application of construal level and regulatory focus theories.International journal of hospitality management, 91, 102677.
[65]. Kapoor, A. P., & Vij, M. (2018). Technology at the dinner table: Ordering food online through mobile apps.Journal of retailing and consumer services, 43, 342-351.
[66]. King, A., Niederdeppe, J., & Dahl, E. (2021). Visual juxtapositions as exemplars in messages promoting healthy dietary behavior.Health Communication, 36(10), 1200-1215.
Cite this article
Zhao,P. (2025). Feast Your Eyes: How Image Features Serves Up Sales on UberEats. Advances in Economics, Management and Political Sciences,203,23-43.
Data availability
The datasets used and/or analyzed during the current study will be available from the authors upon reasonable request.
Disclaimer/Publisher's Note
The statements, opinions and data contained in all publications are solely those of the individual author(s) and contributor(s) and not of EWA Publishing and/or the editor(s). EWA Publishing and/or the editor(s) disclaim responsibility for any injury to people or property resulting from any ideas, methods, instructions or products referred to in the content.
About volume
Volume title: Proceedings of ICEMGD 2025 Symposium: Resilient Business Strategies in Global Markets
© 2024 by the author(s). Licensee EWA Publishing, Oxford, UK. This article is an open access article distributed under the terms and
conditions of the Creative Commons Attribution (CC BY) license. Authors who
publish this series agree to the following terms:
1. Authors retain copyright and grant the series right of first publication with the work simultaneously licensed under a Creative Commons
Attribution License that allows others to share the work with an acknowledgment of the work's authorship and initial publication in this
series.
2. Authors are able to enter into separate, additional contractual arrangements for the non-exclusive distribution of the series's published
version of the work (e.g., post it to an institutional repository or publish it in a book), with an acknowledgment of its initial
publication in this series.
3. Authors are permitted and encouraged to post their work online (e.g., in institutional repositories or on their website) prior to and
during the submission process, as it can lead to productive exchanges, as well as earlier and greater citation of published work (See
Open access policy for details).
References
[1]. Vasan, S., Rao, A. A., & Gupta, N. (2025). Investigating the opportunities and challenges influencing consumer purchase behaviors and media influence in online food ordering: a thematic analysis. British Food Journal, 127(6), 1984-1998.
[2]. The Times. (2024, October 31). Uber takes hit as weekend customers spoil the party. Retrieved June 20, 2025, from https: //www.thetimes.com/business-money/technology/article/uber-takes-hit-as-weekend-customers-spoil-the-party-9g385bwqj?region=global
[3]. Avery, J. A., Carrington, M., Ingeholm, J. E., Darcey, V., Simmons, W. K., Hall, K. D., & Martin, A. (2025). Automatic engagement of limbic and prefrontal networks in response to food images reflects distinct information about food hedonics and inhibitory control.Communications Biology, 8(1), 270.
[4]. Dong, Yifan, et al. "The effect of picture attributes of online ordering pages on visual attention and user experience."International Journal of Industrial Ergonomics96 (2023): 103477.
[5]. Lee, Jinha, and Heejin Lim. "Visual aesthetics and multisensory engagement in online food delivery services."International Journal of Retail & Distribution Management51.8 (2023): 975-990.
[6]. Zhang, M., & Luo, L. (2023). Can consumer-posted photos serve as a leading indicator of restaurant survival? Evidence from Yelp.Management Science, 69(1), 25-50.
[7]. Leyssen, M. H., Linsen, S., Sammartino, J., & Palmer, S. E. (2012). Aesthetic preference for spatial composition in multiobject pictures.i-Perception, 3(1), 25-49.
[8]. Satcharoen, K. (2017, November). The influence of colour on intention to adopt food delivery service mobile app. InProceedings of the 3rd International Conference on Communication and Information Processing(pp. 87-91).
[9]. Sari, N. L. D. I. D., Negara, I. N. S., & Dewi, A. K. (2018, November). Packaging Design Of Betutu Chicken Special Merchandise From Bali. In3rd International Conference on Creative Media, Design and Technology (REKA 2018)(pp. 108-112). Atlantis Press.
[10]. Zhang, S., Lee, D., Singh, P. V., & Srinivasan, K. (2022). What makes a good image? Airbnb demand analytics leveraging interpretable image features.Management Science, 68(8), 5644-5666.
[11]. Vermeir, I., & Roose, G. (2020). Visual design cues impacting food choice: A review and future research agenda.Foods, 9(10), 1495.
[12]. Bajari, P., Cen, Z., Chernozhukov, V., Manukonda, M., Vijaykumar, S., Wang, J., ... & Wan, S. (2023). Hedonic prices and quality adjusted price indices powered by AI.arXiv preprint arXiv: 2305.00044.
[13]. Saad, A. T. (2021). Factors affecting online food delivery service in Bangladesh: an empirical study.British Food Journal, 123(2), 535-550.
[14]. Vindytia, M., & Balqiah, T. E. (2024). AI Marketing Impact on Consumer Behavior: An SOR Model Analysis of Online Food Delivery Services.JDM (Jurnal Dinamika Manajemen), 15(2), 215-228.
[15]. Amirshahi, S. A., Hayn-Leichsenring, G. U., Denzler, J., & Redies, C. (2014). Evaluating the rule of thirds in photographs and paintings.Art & Perception, 2(1-2), 163-182.
[16]. Gritz, W., Hoppe, A., & Ewerth, R. (2025, April). Unraveling the Impact of Visual Complexity on Search as Learning. InEuropean Conference on Information Retrieval(pp. 17-33). Cham: Springer Nature Switzerland.
[17]. Li, J., Xu, L., Tang, L., Wang, S., & Li, L. (2018). Big data in tourism research: A literature review.Tourism management, 68, 301-323.
[18]. Xiang, Z., Du, Q., Ma, Y., & Fan, W. (2017). A comparative analysis of major online review platforms: Implications for social media analytics in hospitality and tourism.Tourism Management, 58, 51-65.
[19]. Obrist, M. (2021). Multisensory Experiences: Where the Senses Meet Technology. InHuman-Computer Interaction–INTERACT 2021: 18th IFIP TC 13 International Conference, Bari, Italy, August 30–September 3, 2021, Proceedings, Part I 18(pp. 9-13). Springer International Publishing.
[20]. Ma, B., Wong, Y. D., Teo, C. C., & Sun, S. (2024). Quantifying consumers’ cost-value trade-offs on on-demand food delivery services: Value-of-time framework and partitioned pricing.Journal of Retailing and Consumer Services, 81, 104027.
[21]. Tavitiyaman, P., Tsang, W. S. L., & Lo, S. K. J. (2024). Customers’ perceived values and purchase intention through satisfaction: Differences based on food delivery application platform and buying power.International Journal of Hospitality & Tourism Administration, 25(4), 709-737.
[22]. Chatterjee, A. (2003). Prospects for a cognitive neuroscience of visual aesthetics.
[23]. Spence, C., Okajima, K., Cheok, A. D., Petit, O., & Michel, C. (2016). Eating with our eyes: From visual hunger to digital satiation.Brain and cognition, 110, 53-63.
[24]. Liu, S. Q., Wu, L. L., Yu, X., & Huang, H. (2022). Marketing online food images via color saturation: A sensory imagery perspective.Journal of business research, 151, 366-378.
[25]. Thorud, H. M. S., Helland, M., Aarås, A., Kvikstad, T. M., Lindberg, L. G., & Horgen, G. (2012). Eye-related pain induced by visually demanding computer work.Optometry and vision science, 89(4), E452-E464.
[26]. Garber Jr, L. L., Hyatt, E. M., & Starr Jr, R. G. (2000). The effects of food color on perceived flavor.Journal of Marketing Theory and Practice, 8(4), 59-72.
[27]. Michel, C., Velasco, C., Fraemohs, P., & Spence, C. (2015). Studying the impact of plating on ratings of the food served in a naturalistic dining context.Appetite, 90, 45-50.
[28]. Peng, Y., & JEMMOTT III, J. B. (2018). Feast for the eyes: Effects of food perceptions and computer vision features on food photo popularity.International Journal of Communication (19328036), 12.
[29]. Pieters, R., Wedel, M., & Batra, R. (2010). The stopping power of advertising: Measures and effects of visual complexity.Journal of marketing, 74(5), 48-60.
[30]. Labrecque, L. I., & Milne, G. R. (2013). To be or not to be different: Exploration of norms and benefits of color differentiation in the marketplace.Marketing Letters, 24, 165-176.
[31]. Zellner, D. A., Lankford, M., Ambrose, L., & Locher, P. (2010). Art on the plate: Effect of balance and color on attractiveness of, willingness to try and liking for food.Food Quality and Preference, 21(5), 575-578.
[32]. Delwiche, J. F. (2012). You eat with your eyes first.Physiology & behavior, 107(4), 502-504.
[33]. Lee, B. P., & Spence, C. (2022). Crossmodal correspondences between basic tastes and visual design features: A narrative historical review.i-Perception, 13(5), 20416695221127325.
[34]. Carvalho, J. S., Oliveira, J. D. S. C., & SÃO JOSÉ, J. F. B. D. (2022). Consumers’ knowledge, practices, and perceptions about conventional and sustainable food packaging.Food Science and Technology, 42, e06722.
[35]. Zhao, W., Wu, Q., Yang, C., & Yan, J. (2023). Proceedings of the 29th ACM SIGKDD Conference on Knowledge Discovery and Data Mining, KDD'23.
[36]. Lu, A. C. C., & Gursoy, D. (2015). A conceptual model of consumers’ online tourism confusion.International Journal of Contemporary Hospitality Management, 27(6), 1320-1342.
[37]. He, R., & McAuley, J. (2016, February). VBPR: visual bayesian personalized ranking from implicit feedback. InProceedings of the AAAI conference on artificial intelligence(Vol. 30, No. 1).
[38]. Azman, F. A. M., & Mustaffa, N. (2023). The impact of user generated content on food purchase intention through Tiktok platform.Al-i’lam-Journal of Contemporary Islamic Communication and Media, 3(2).
[39]. Itti, L., & Koch, C. (2000). A saliency-based search mechanism for overt and covert shifts of visual attention.Vision research, 40(10-12), 1489-1506.
[40]. Chevalier, J. A., & Mayzlin, D. (2006). The effect of word of mouth on sales: Online book reviews.Journal of marketing research, 43(3), 345-354.
[41]. Luca, M. (2016). Reviews, reputation, and revenue: The case of Yelp. com.Com (March 15, 2016). Harvard Business School NOM Unit Working Paper, (12-016).
[42]. Hou, Y., Yang, W., & Sun, Y. (2017). Do pictures help? The effects of pictures and food names on menu evaluations.International Journal of Hospitality Management, 60, 94-103.
[43]. Celona, L., Leonardi, M., Napoletano, P., & Rozza, A. (2022). Composition and style attributes guided image aesthetic assessment.IEEE Transactions on Image Processing, 31, 5009-5024.
[44]. Li, X., Wang, M., & Chen, Y. (2014). The impact of product photo on online consumer purchase intention: an image-processing enabled empirical study.
[45]. Liu, L., Chen, R., Wolf, L., & Cohen‐Or, D. (2010, May). Optimizing photo composition. InComputer graphics forum(Vol. 29, No. 2, pp. 469-478). Oxford, UK: Blackwell Publishing Ltd.
[46]. Gambetti, A., & Han, Q. (2022). Camera eats first: exploring food aesthetics portrayed on social media using deep learning.International journal of contemporary hospitality management, 34(9), 3300-3331.
[47]. Juricevic, I., Land, L., Wilkins, A., & Webster, M. A. (2010). Visual discomfort and natural image statistics.Perception, 39(7), 884-899.
[48]. Quek, G., Wienold, J., Khanie, M. S., Erell, E., Kaftan, E., Tzempelikos, A., ... & Andersen, M. (2021). Comparing performance of discomfort glare metrics in high and low adaptation levels.Building and environment, 206, 108335.
[49]. Tahir, G. A., & Loo, C. K. (2021, December). A comprehensive survey of image-based food recognition and volume estimation methods for dietary assessment. InHealthcare(Vol. 9, No. 12, p. 1676). MDPI.
[50]. Yarlagadda, S. K., Montserrat, D. M., Güera, D., Boushey, C. J., Kerr, D. A., & Zhu, F. (2021). Saliency-aware class-agnostic food image segmentation.ACM Transactions on Computing for Healthcare, 2(3), 1-17.
[51]. Ferreira, B. M. (2019). Packaging texture influences product taste and consumer satisfaction.Journal of Sensory Studies, 34(6), e12532.
[52]. Matz, S. C., Segalin, C., Stillwell, D., Müller, S. R., & Bos, M. W. (2019). Predicting the personal appeal of marketing images using computational methods.Journal of consumer psychology, 29(3), 370-390.
[53]. Wagemans, J., Elder, J. H., Kubovy, M., Palmer, S. E., Peterson, M. A., Singh, M., & Von der Heydt, R. (2012). A century of Gestalt psychology in visual perception: I. Perceptual grouping and figure–ground organization.Psychological bulletin, 138(6), 1172.
[54]. Kostyk, A., & Huhmann, B. A. (2021). Perfect social media image posts: Symmetry and contrast influence consumer response.European Journal of Marketing, 55(6), 1747-1779.
[55]. Al Maalouf, N. J., Sayegh, E., Makhoul, W., & Sarkis, N. (2025). Consumers' attitudes and purchase intentions toward food ordering via online platforms.Journal of Retailing and Consumer Services, 82, 104151.
[56]. Thalji, Z. (2022). Using Multiple linear regression model to predict The Customers’ Purchase Decision based on After-Sales Services.
[57]. Kutner, M. H., Nachtsheim, C. J., Neter, J., & Li, W. (2005).Applied linear statistical models. McGraw-hill.
[58]. Wooldridge, J. M. (2016).Introductory Econometrics: A Modern Approach 6rd ed. Cengage learning.
[59]. Long, J. A., Xiao, J., McCray, S., Ağaoğlu, E., Alajmi, A. M., Akalonu, C., & Xu, Y. Artificial Impressions: Trust and Credibility in AI-Enhanced Profile Pictures.
[60]. Pillai, S. G., Kim, W. G., Haldorai, K., & Kim, H. S. (2022). Online food delivery services and consumers' purchase intention: Integration of theory of planned behavior, theory of perceived risk, and the elaboration likelihood model.International journal of hospitality management, 105, 103275.
[61]. Qi, M., Ono, K., Mao, L., Watanabe, M., & Huang, J. (2024). The effect of short-form video content, speed, and proportion on visual attention and subjective perception in online food delivery menu interfaces.Displays, 82, 102671.
[62]. Chan, I. C. C., Chen, Z., & Leung, D. (2023). The more the better? Strategizing visual elements in social media marketing.Journal of Hospitality and Tourism Management, 54, 268-289.
[63]. Karimi, S., & Wang, F. (2017). Online review helpfulness: Impact of reviewer profile image.Decision Support Systems, 96, 39-48.
[64]. Cai, R., & Leung, X. Y. (2020). Mindset matters in purchasing online food deliveries during the pandemic: The application of construal level and regulatory focus theories.International journal of hospitality management, 91, 102677.
[65]. Kapoor, A. P., & Vij, M. (2018). Technology at the dinner table: Ordering food online through mobile apps.Journal of retailing and consumer services, 43, 342-351.
[66]. King, A., Niederdeppe, J., & Dahl, E. (2021). Visual juxtapositions as exemplars in messages promoting healthy dietary behavior.Health Communication, 36(10), 1200-1215.