1. Introduction
With the rapid development of science and information technology, big data and digital technology have become an undeniable force in the field of social management. The social management system needs constant innovation and optimization to address increasingly complex social challenges and issues. In this context, big data visualization analysis and digital governance based on big data have emerged as effective approaches to promoting innovation in the social management system. This paper aims to explore how to enhance the efficiency of the social management system through the application of big data visualization analysis and innovative digital governance methods. Firstly, we introduce the concept and application areas of big data technology, with a focus on the functionalities and advantages of platforms like Hadoop and Spark. Next, we emphasize the application of the improved Naive Bayes classification algorithm in the classification and governance of social management event data [1]. By introducing feature weighting and improved calculation methods, this algorithm can classify and predict social management events more accurately. We will conduct experiments and evaluations to verify its practicality and effectiveness in the field of social management. Additionally, we design a big data-driven social management system innovation system and discuss key modules such as data warehousing, data collection, and statistical analysis. Through this system, social managers can better collect, manage, and analyze a large amount of social management data, thus supporting more informed decision-making. In conclusion, this research is of great significance for promoting innovation in the social management system and digital governance based on big data, and it will provide valuable references and guidance for future research [2].
2. Related technologies and theories
2.1. Overview of Hadoop
2.1.1. Introduction to Hadoop
Hadoop is an open source distributed computing framework widely used for big data processing. Traditional data processing tools struggle to handle large-scale and complex data, which led to the emergence of Hadoop as an efficient and reliable solution. This section will provide detailed explanations of the basic principles and core components of Hadoop.
The core idea of Hadoop is to split massive data into chunks and distribute them across multiple machines for parallel processing. This distributed data storage and computing approach forms the foundation for fast and effective big data processing. Hadoop's file system, called HDFS (Hadoop Distributed File System), can divide data into blocks and distribute these data blocks across multiple machines in a distributed manner. This distributed storage method ensures data fault-tolerance and reliability.
MapReduce is the core computational model in Hadoop, which enables parallel processing of large-scale data. MapReduce divides the computation task into smaller subtasks and performs parallel computing by distributing them to different machines. Finally, the results from each computing node are combined to obtain the result. This distributed computing approach significantly improves the efficiency and scalability of data processing [3].
2.1.2. HDFS overview
HDFS (Hadoop Distributed File System) is one of the core components in the Hadoop ecosystem and is a distributed file system used to store massive-scale data. This section will provide a detailed explanation of the concept and features of HDFS. The design goal of HDFS is to store large-scale data with high fault tolerance and scalability. It achieves this by splitting data into blocks and distributing these data blocks across multiple machines, ensuring data reliability. Each data block has multiple replicas stored on different nodes. In the event of a node failure, the system can automatically switch the replicas of the data blocks to other healthy nodes, ensuring data availability.
HDFS utilizes a master-slave architecture consisting of a master node (NameNode) and multiple slave nodes (DataNode). The master node is responsible for managing the metadata of the file system, including information such as the location of files and the distribution of data blocks. The slave nodes are responsible for actually storing the data blocks. The architecture system is shown in Figure 1:
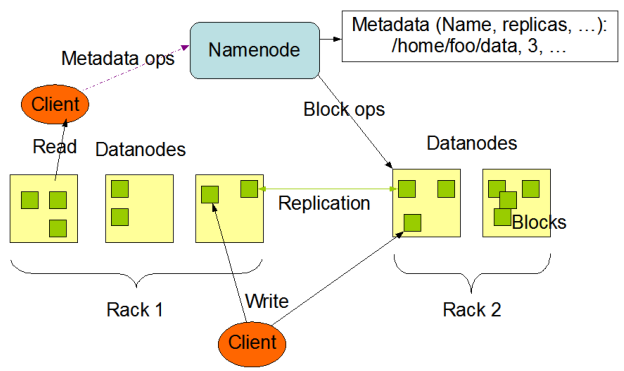
HDFS supports streaming access to data in a way that is suitable for big data processing scenarios. It can efficiently handle write-once, read-many patterns, making it ideal for batch processing tasks on large-scale data sets. At the same time, HDFS also supports random read and append write operations for data, making it adaptable to more data processing needs [4].
2.2. Spark overview
Spark is a fast, general-purpose, scalable distributed computing system that is widely used in big data processing and analysis scenarios. This section describes the concepts and features of Spark in detail.The design goal of Spark is to provide efficient large-scale data processing capabilities. Compared with traditional data processing systems, Spark has higher execution speed and stronger in-memory computation capabilities. It utilizes memory for data computation to reduce disk reads and writes, thus greatly increasing the speed of data processing.
Spark provides an abstraction model called Resilient Distributed Datasets (RDDs) (as shown in Figure 2) for representing and manipulating distributed datasets. RDDs are mutable, partitioned collections of data that can be computed in parallel across a cluster. By caching datasets in memory, Spark offers efficient data sharing and fault tolerance, making it perform exceptionally well in scenarios such as iterative computations and interactive queries. Spark supports multiple programming languages, including Java, Scala, Python, and R, making it convenient for developers to use their preferred language for data processing and analysis. Additionally, Spark provides a rich set of APIs and libraries such as Spark SQL, Spark Streaming, and MLlib. These components allow for the processing of structured data, stream data, and machine learning tasks, providing users with a one-stop solution.
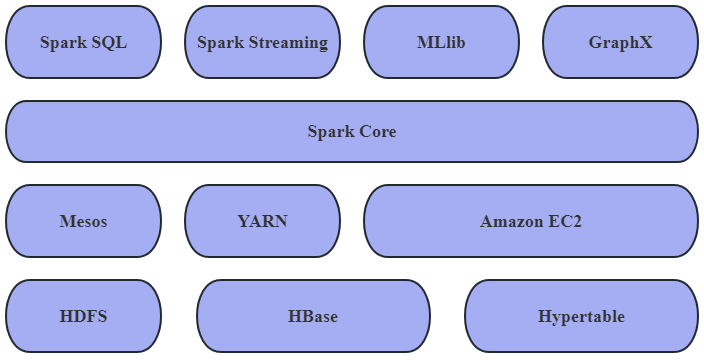
Spark's scalability is also one of its strengths. By horizontally scaling compute nodes in a cluster, it is easy to increase compute and storage capacity to accommodate growing data sizes and workloads.Spark is also tightly integrated with other big data ecosystems, such as Hadoop, Hive, and HBase, and can be seamlessly integrated with existing data platforms and tools.Spark is an efficient, flexible, and scalable distributed computing system that provides powerful features and performance for large-scale data processing and analysis. Its features such as in-memory computing, RDD abstraction and rich APIs make Spark widely used in the big data field [5]. By using Spark, users can process and analyze data more efficiently and gain valuable insights and decision support from it.
2.3. Data visualization
Data visualization is the process of transforming data into an intuitive, easy-to-understand visual form through charts, graphs, and other visual elements. It is an important tool for data analysis and communication, and can help people understand patterns, trends, and relationships in data more clearly. The goal of data visualization is to transform abstract data into visual representations so that users can more easily understand and interpret the data. Using visual elements such as charts, graphs, and maps, data visualization can help people spot patterns and changes in data and derive insights and insights from it.
Data visualization has a wide range of applications in various fields and industries. In the business field, data visualization can help enterprises to conduct sales analysis, market trend prediction and business performance monitoring, etc. In scientific research, data visualization can help scientists to visualize geographic data, biological data, weather data, etc. In the social field, data visualization can help governments and public institutions to conduct public policy analysis and urban planning [6].
3. Big data based algorithms for social management event data classification and governance
3.1. Plain Bayesian classification algorithm
3.1.1. Parsimonious Bayesian classification algorithm
The Plain Bayesian classification algorithm is a simple yet effective machine learning algorithm commonly used for tasks such as text categorization and spam filtering. The algorithm is based on Bayes' theorem and the assumption of feature independence and is able to classify given data. The plain Bayesian classification algorithm assumes that the features are independent of each other, i.e., the contribution of each feature to the classification result is independent of each other. Based on this assumption, the algorithm can compute the conditional probability of each feature for a given category and compute the posterior probability through Bayes' theorem to perform classification.
The training process of the algorithm mainly involves the following steps: Firstly, the frequency of occurrence for each category is counted, and the occurrence frequency of each feature under each category is calculated. Then, the model is established by calculating the conditional probabilities, which are the probabilities of each category given a certain feature. Lastly, the posterior probabilities are computed using Bayes' theorem, and the category with the highest probability is selected as the prediction result. During prediction, the Naive Bayes algorithm calculates the posterior probabilities for each category based on the input feature vector, and the category with the highest probability is chosen as the final classification result. Due to the simple assumption, low computational complexity, and minimal need for training data, the Naive Bayes algorithm performs well in many practical applications [7].
In conclusion, the Naive Bayes classification algorithm is a simple yet effective machine learning algorithm that is suitable for tasks such as text classification and spam filtering. It uses Bayes' theorem and the assumption of feature independence to calculate posterior probabilities for classification. Despite some limitations, the algorithm still has widespread applications in many practical scenarios.
3.1.2. Calculation of simple Bayes
The computational method of the Plain Bayes classification algorithm includes the calculation of the a priori probability and the calculation of the posterior probability. The calculation of a priori probability is shown in Equation (1) as follows.
where n, denotes the number of samples with category i and n denotes the total number of samples. Since there are two types of sample features, continuous and discrete, the corresponding posteriori probabilities are calculated differently.
For discrete feature samples, the a posteriori probability is calculated as shown in Equation (2):
For continuous feature samples, let the random variable X= (A, /C=c;) conform to a normal distribution, i.e., XN (u, o2), and then use the training sample data to estimate the mean u and variance o2 in the distribution of the random variable X.
The sample mean is calculated as shown in Equation (3).
The sample variance is calculated as shown in Equation (4) as follows.
3.1.3. Plain Bayesian text classification algorithm
The Naive Bayes text classification algorithm is a commonly used method for text classification based on the Naive Bayes classification algorithm. It automatically categorizes text data into predefined classes, such as spam classification, sentiment analysis, topic classification, and more. The algorithm begins by establishing a training dataset that contains pre-categorized text samples, with each sample labeled with a corresponding class. From this dataset, the algorithm learns the feature distributions for each class. During the modeling process, the Naive Bayes text classification algorithm assumes that text features are independent of each other. Techniques such as word frequency and bag-of-words models are used to transform text into feature vector representations. Next, utilizing the prior probabilities and conditional probabilities, the algorithm applies Bayes' theorem to compute the posterior probabilities of the text belonging to each class. The class with the highest probability is then selected as the classification result [8].
There are mainly two different implementations of the plain Bayesian text classification algorithm: the multinomial model and the Bernoulli model.
The multinomial model assumes that all items in a document are features of the document, and the same item can occur multiple times. In addition, the posterior probability of the same item is equal. The a posteriori probability in the multinomial model is calculated as shown in Equation (5).
The Bernoulli model assumes that all terms in a document are the result of an n-weight Bernoulli experiment. The Bernoulli model does not care about the number of times a term occurs, it only focuses on whether the term occurs or not. The posterior probability in the Bernoulli model is calculated as shown in Equation (6).
3.2. Improved Plain Bayesian classification algorithm
3.2.1. Feature weighting based simple Bayesian classification algorithm
The feature-weighted Naive Bayes classification algorithm is an improved method of the Naive Bayes algorithm. It introduces the concept of feature weighting to enhance the contribution of features to classification, thus improving classification performance.
In the traditional Naive Bayes algorithm, the assumption is that features are independent of each other, disregarding any correlations among them. However, in practical scenarios, certain features may have a larger or smaller impact on the classification results. To address this issue, the feature-weighted Naive Bayes algorithm incorporates feature weights to explicitly represent the importance of each feature in the classification process. By introducing feature weighting, the algorithm can more accurately measure the contribution of features to classification. It can prioritize attention to important features and reduce the influence of less important features, thereby optimizing classification performance [9]. The improved algorithm flow is illustrated in Figure 3.
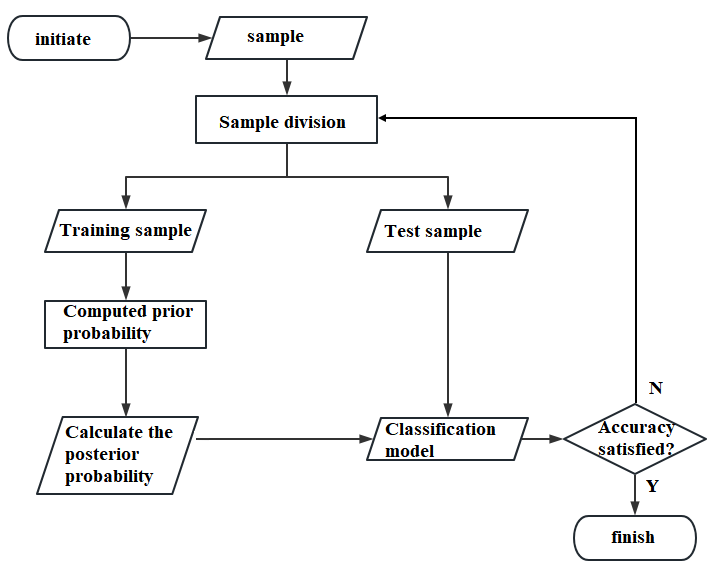
It should be noted that the introduction of feature weighting requires reasonable trade-offs and tuning. Too high weights may lead to overfitting, while too low weights may lead to underfitting. Therefore, in practice, the optimal feature weights can be selected by methods such as cross-validation.
3.3. Experiments on improved simple Bayesian algorithm in a single-computer environment
In order to verify the effectiveness of the improved plain Bayesian algorithm in the classification governance of social management event data, we conducted experiments in a stand-alone environment. The experiments used a dataset containing a large amount of social management event data, including event descriptions, labels, and other information.
3.3.1. Experimental data
The experimental data for this section comes from the UCI database (http://archive.ics.uci.edu/ml/datasets.html). We have chosen three datasets with discrete features. Information about the total number of samples, the total number of features, and the total number of categories for the three datasets is shown in Table 1.
|
Data set |
Sample count |
Feature total |
Class total |
|
balance-scale |
625 |
4 |
3 |
|
nursery |
12960 |
8 |
5 |
|
Chess |
3196 |
36 |
2 |
3.3.2. Experimental results
The performance evaluation metrics selected for the experiments in this section are shown in Section 2.3.4. The experiments were conducted using tenfold cross-validation, and the average of the ten experimental results was taken as the final experimental result. The experimental results using the plain Bayesian classification algorithm and the improved plain Bayesian classification algorithm are shown in Table 2 and Table 3, respectively.
|
Data set |
Macro average accuracy |
Macro average recall rate |
Macro average F1 measure |
|
balance-scale |
0.853 |
0.822 |
0.837 |
|
nursery |
0.861 |
0.817 |
0.838 |
|
Chess |
0.842 |
0.833 |
0.837 |
|
Data set |
Macro average accuracy |
Macro average recall rate |
Macro average F1 measure |
|
balance-scale |
0.892 |
0.858 |
0.875 |
|
nursery |
0.901 |
0.852 |
0.876 |
|
Chess |
0.887 |
0.877 |
0.882 |
The experimental results show that the improved plain Bayesian classification algorithm has high accuracy and effectiveness in classifying social management event data in a single-computer environment. Compared with the traditional plain Bayesian classification algorithm, the improved algorithm is able to better utilize the importance degree information of the features and improve the accuracy of the classification results.
4. Design of social management system innovation system based on big data
4.1. Overall architecture of social management event data management platform
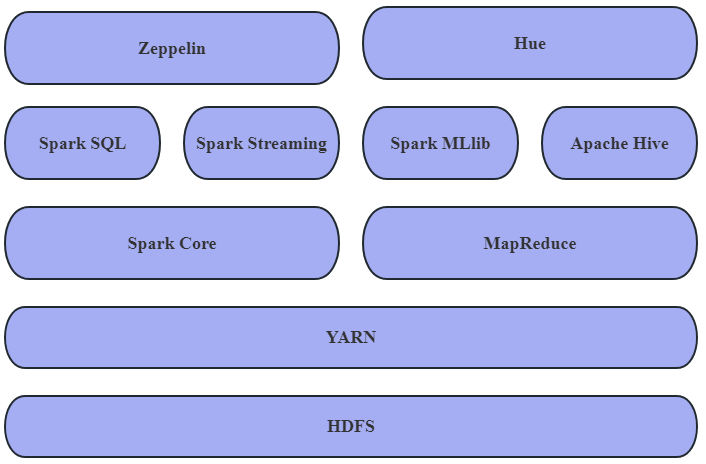
The Social Management Event Data Management Platform is a system designed to collect, store, analyze, and visualize data related to social management events in the field. Its purpose is to assist government departments, public institutions, and decision-makers in better understanding and managing social events to support effective social governance and decision-making. In order to support innovation in social management systems and digital governance based on big data, we have designed a Social Management Event Data Management Platform [10]. The platform consists of three main modules: the data warehouse module, the data collection module, and the statistical analysis module. The architecture of the platform is illustrated in Figure 4.
4.2. Data warehouse module
The data warehouse module is used to store and manage large-scale social management event data. This module utilizes HDFS as the underlying storage technology and utilizes Hadoop for distributed storage and indexing of data. The data warehouse module achieves data integration and cleansing by collecting data from multiple sources and transforming it into a unified format and structure. The module provides efficient data storage and indexing techniques, allowing fast access and querying of a large volume of event data. Additionally, the data warehouse module incorporates data security and permission management capabilities to ensure that only authorized users can access the data. It also monitors data quality and integrity, and offers metadata management functionalities to facilitate data tracking and management.
Through the data warehouse module, the Social Management Event Data Management Platform is able to efficiently store, manage, and analyze a vast amount of social management event data, providing reliable data support for decision-making and business applications.
4.3. Data acquisition module
The data collection module is used to acquire social management event data and import it into the data warehouse. This module can collect data in various ways, including scheduled web scraping, receiving sensor data, and more. The data collection module connects multiple data sources, such as government databases, public institutions' data systems, third-party data service providers, etc., to obtain and integrate data from multiple sources. It leverages automation technologies such as API calls, web crawlers, and data interfaces to periodically or in real-time collect data from the data sources, improving data timeliness and accuracy.
Through the data collection module, the Social Management Event Data Management Platform can efficiently acquire social management event data from multiple sources. After quality assessment and preprocessing, the platform provides a reliable data foundation for subsequent data analysis, decision-making, and business applications.
4.4. Statistical analysis module
The Statistical Analysis Module is used to analyze and visualize social management event data. The module uses Spark for fast computation and distributed processing of data. Through the data visualization technology, the analysis results can be displayed in the form of intuitive charts to help decision makers better understand and analyze social management data. The technical architecture diagram of the statistical analysis module is shown in Figure 5:
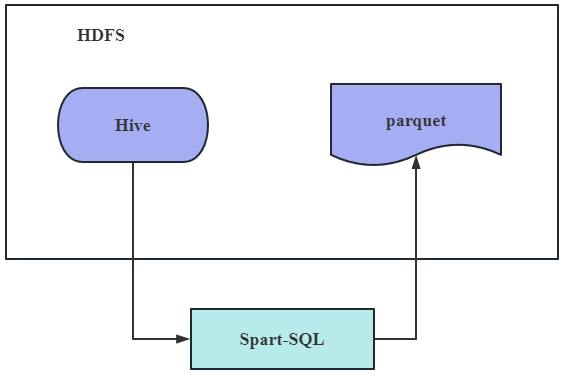
Through the statistical analysis module, the social management event data management platform is able to fully explore and utilize the collected data, provide data-based decision support and insights, and improve the science and accuracy of social management.
5. Conclusion
This paper proposes a method of social management system innovation and digital governance based on big data visualization analysis. By utilizing technologies like Hadoop and Spark, large-scale social management event data can be efficiently processed. The improved Naive Bayes classification algorithm is applied for data classification and governance. The designed Social Management Event Data Management Platform accomplishes data storage, collection, analysis, and visualization, providing robust support and assistance to decision-makers. Further research could focus on optimizing algorithm performance and expanding system functionalities to accommodate more complex and diverse social management needs. Additionally, the introduction of other machine learning algorithms and technologies could enhance the accuracy and effectiveness of data classification governance. Through continual innovation and improvement, research on big data visualization analysis and digital governance will continue to explore and provide more powerful tools and methods for social management system innovation and digitalization.
References
[1]. Hang Z. Research and Design of Real Time Big Data Visualization Analysis Platform Based on Flink [J]. Journal of Physics: Conference Series, 2023(1): 2504.
[2]. Xiaoming L, Wei Y, Guangquan X, et al. MSDA-NMF: A Multilayer Complex System Model Integrating Deep Autoencoder and NMF [J]. Mathematics, 2022: 10-15.
[3]. Li M, Du W, Qian F, et al. Total plant performance evaluation based on big data: Visualization analysis of TE process [J]. Chinese Journal of Chemical Engineering, 2018(8): 26.
[4]. Czaja J S, Boot R W, Charness N, et al. The personalized reminder information and social management system (PRISM) trial: rationale, methods and baseline characteristics [J]. Contemporary Clinical Trials, 2015: 40.
[5]. Mathias D, Steven L. Topological genealogy: a methodology to research transnational digital governance in/through/as change [J]. Journal of Education Policy, 2023(1): 38.
[6]. Lobazova O. Mentality as A Factor of Innovation and Anti-Corruption Behavior in The Social Management System [J]. International Journal of Innovative Technology and Exploring Engineering (IJITEE), 2019: 8-12.
[7]. L.M. G, O.M. B, Y.I. K, et al. Social management systems' modeling based on the synergetic approach: Methods and fundamentals of implementation [J]. Academy of Strategic Management Journal, 2017: 16-18.
[8]. Liu H, Gao Y. Research on Social Management System of Exiting from Land by the New Generation of Migrant Workers [P]. Proceedings of the 3rd International Conference on Science and Social Research, 2014: 11.
[9]. WANG H, FANG W, SHI C. On the Construction of Chinese Government Procurement of Public Service Assessment System [J]. Cross-Cultural Communication, 2015(8): 11.
[10]. Jelovac D, Ljubojević Č, Ljubojević L. HPC in business: the impact of corporate digital responsibility on building digital trust and responsible corporate digital governance [J]. Digital Policy Regulation and Governance, 2022(6): 24.
Cite this article
Chai,M.;Ten,D.W.H. (2025). Innovating Social Management and Digital Governance Through Big Data Visualization and Analytical Techniques. Advances in Economics, Management and Political Sciences,207,32-42.
Data availability
The datasets used and/or analyzed during the current study will be available from the authors upon reasonable request.
Disclaimer/Publisher's Note
The statements, opinions and data contained in all publications are solely those of the individual author(s) and contributor(s) and not of EWA Publishing and/or the editor(s). EWA Publishing and/or the editor(s) disclaim responsibility for any injury to people or property resulting from any ideas, methods, instructions or products referred to in the content.
About volume
Volume title: Proceedings of ICEMGD 2025 Symposium: Innovating in Management and Economic Development
© 2024 by the author(s). Licensee EWA Publishing, Oxford, UK. This article is an open access article distributed under the terms and
conditions of the Creative Commons Attribution (CC BY) license. Authors who
publish this series agree to the following terms:
1. Authors retain copyright and grant the series right of first publication with the work simultaneously licensed under a Creative Commons
Attribution License that allows others to share the work with an acknowledgment of the work's authorship and initial publication in this
series.
2. Authors are able to enter into separate, additional contractual arrangements for the non-exclusive distribution of the series's published
version of the work (e.g., post it to an institutional repository or publish it in a book), with an acknowledgment of its initial
publication in this series.
3. Authors are permitted and encouraged to post their work online (e.g., in institutional repositories or on their website) prior to and
during the submission process, as it can lead to productive exchanges, as well as earlier and greater citation of published work (See
Open access policy for details).
References
[1]. Hang Z. Research and Design of Real Time Big Data Visualization Analysis Platform Based on Flink [J]. Journal of Physics: Conference Series, 2023(1): 2504.
[2]. Xiaoming L, Wei Y, Guangquan X, et al. MSDA-NMF: A Multilayer Complex System Model Integrating Deep Autoencoder and NMF [J]. Mathematics, 2022: 10-15.
[3]. Li M, Du W, Qian F, et al. Total plant performance evaluation based on big data: Visualization analysis of TE process [J]. Chinese Journal of Chemical Engineering, 2018(8): 26.
[4]. Czaja J S, Boot R W, Charness N, et al. The personalized reminder information and social management system (PRISM) trial: rationale, methods and baseline characteristics [J]. Contemporary Clinical Trials, 2015: 40.
[5]. Mathias D, Steven L. Topological genealogy: a methodology to research transnational digital governance in/through/as change [J]. Journal of Education Policy, 2023(1): 38.
[6]. Lobazova O. Mentality as A Factor of Innovation and Anti-Corruption Behavior in The Social Management System [J]. International Journal of Innovative Technology and Exploring Engineering (IJITEE), 2019: 8-12.
[7]. L.M. G, O.M. B, Y.I. K, et al. Social management systems' modeling based on the synergetic approach: Methods and fundamentals of implementation [J]. Academy of Strategic Management Journal, 2017: 16-18.
[8]. Liu H, Gao Y. Research on Social Management System of Exiting from Land by the New Generation of Migrant Workers [P]. Proceedings of the 3rd International Conference on Science and Social Research, 2014: 11.
[9]. WANG H, FANG W, SHI C. On the Construction of Chinese Government Procurement of Public Service Assessment System [J]. Cross-Cultural Communication, 2015(8): 11.
[10]. Jelovac D, Ljubojević Č, Ljubojević L. HPC in business: the impact of corporate digital responsibility on building digital trust and responsible corporate digital governance [J]. Digital Policy Regulation and Governance, 2022(6): 24.


