


1. Introduction
As the main industry of Singapore's economic development, the healthy development of the real estate industry is crucial, and the price and fluctuation of the real estate industry is an important indicator to determine whether the real estate industry is healthy. In the past decade, the real estate prices in Singapore have changed greatly. Nowadays, too many young people have become "house slaves", and the phenomenon of real estate speculation and "house price bubble" behind it may cause financial tsunami similar to the one in 2008. Therefore, the internal operation law of housing price, which is of great significance to prevent the fluctuation of housing price and to guard against the real estate bubble.
Pricing within the real estate sector is a fundamental aspect of its economic theory, defined as the sum of the price of the building itself together with the price of the land it occupies. On the one hand, the real estate price is affected by the prices of materials and labor consumed, and on the other hand, the relationship between supply and demand plays a decisive role. Real estate price is different from other commodity prices and has its own unique features. However, the operation law of real estate price is very complicated and affected by many factors, including economic factors, geographical factors, policy factors and social factors. In terms of economic factors, research shows that factors such as economic growth, interest rates, inflation, job market and population growth have a significant impact on housing prices. Geographical factors include location, transportation convenience, surrounding facilities, etc. Policy factors include government regulation policies, land supply policies and tax policies. Social factors include population structure, social culture and lifestyle. The combined effect of these factors will have an impact on house prices.
The popularization of the Internet and big data is also changing the Singapore's real estate market. By analysing and learning from large amounts of data through algorithmic models, future market movements can be predicted, providing scientific decision support for investors, developers and government departments. Singapore's property market is at the forefront of a technology and data revolution, and these changes will continue to shape the future of the market, improving the customer experience and driving the industry by increasing the ease of transactions, market transparency, and scientific nature of investment decisions. The concept of transformational housing has raised, leading evolving expectations of housing demand, which involves not only housing quality and convenience, but also factors such as community environment, sustainability and intelligence. Moreover, investors can quickly obtain more comprehensive information to help them make informed investment decisions.
Machine Learning (ML), a practical subset of Artificial Intelligence (AI), has been significantly applied in forecasting house prices. Leveraging its prowess as a mathematical statistical model, ML thrives particularly when ample data is available. By employing algorithms, ML analyzes historical house price data, extracts patterns and rules, and utilizes these insights to predict future trends in housing prices. The efficacy of machine learning (ML) models is greatly dependent on skilled feature engineering and meticulous feature selection. Feature engineering, rooted in domain knowledge, involves crafting new features or modifying existing ones to enhance the model's predictive power. Concurrently, feature selection aims to pinpoint the most impactful features while discarding irrelevant or duplicate ones. This combined strategy not only simplifies the model's training and reduces the risk of overfitting but also enhances its interpretability.
This document intends to thoroughly review current ML techniques and introduce specialized models designed for evaluating house prices in Singapore. The study seeks to evaluate the accuracy of various ML methods in predicting property prices and discern the key factors influencing prices for new listings based on the correlation between different product/service features and pricing. Four popular ML models, namely Back Propagation neural network (BP), random forest (RF), seagull optimization algorithm (SOA) and lion swarm optimization-based algorithms (SLSO-BP), will be investigated, with their performance evaluated using R-squared (
The implications of this research extend to potential benefits for housing buyers, enhancing their understanding of pricing mechanisms and facilitating informed decisions in housing purchases and investments. Additionally, the study aims to assist government management departments in making rational decisions regarding the real estate industry, thereby promoting the healthy and stable development of Singapore's real estate market.
Our paper follows this structure: We begin by examining related literature in Section 2, then delve into different models in Section 3. Section 4 offers a thorough overview of the dataset used in our study, followed by an in-depth analysis of our experimental findings in Section 5. Lastly, Section 6 summarizes our conclusions and suggests potential directions for future research.
2. Literature review
This section will mainly review the influencing factors of housing price and housing price forecasting methods.
2.1. Research on influencing factors of housing price
Researchers have studied the factors influencing housing prices from multiple perspectives, including economic, environmental, and societal factors [1]. found that the selling price of commercial housing, per capita income, population size, bank loan interest rate had a certain impact on housing demand [2]. showed that per capita GDP, income and urban population influenced housing prices based on the US housing price data from 1986 to 1994 [3]. studied the big cities in India and found that the degree of urbanization would increase the local housing price and promote the development of local economy [4]. observed the impact of bank interest rates on housing prices [5]. analysed noise sensitivity indices from a micro perspective, finding significant impacts of road noise on housing prices. Numerous studies have been conducted on Singapore's real estate market. For example, [6] identified that the price of construction materials, land price and other factors impacted housing price.
2.2. Research on housing price forecasting methods
Various methods have emerged for predicting housing prices, including economic model-based approaches, statistical model-based techniques, and machine learning-based methods. Economic model-based strategies typically utilize macroeconomic and real estate market indicators, employing models such as VAR, ARIMA, and regression. Statistical model-based approaches commonly employ methodologies such as time series analysis, panel data analysis, and spatial regression analysis. For instance, [7] examined quarterly housing price data from 1979 to 2001 using the transition matrix model, ARIMA model, and GARCH model, with findings favoring the ARIMA model. Machine learning-based methodologies encompass neural networks, support vector machines, and deep learning, among others [8,9]. The increasing adoption of AI in housing price forecasting owes much to the advancement of Machine Learning (ML), a subset of AI that leverages algorithms to analyze historical housing price data, discern patterns and rules, and utilize them for future price predictions. ML functions as a mathematical statistical model particularly effective in scenarios with ample data availability. It represents a relatively novel approach in economics aimed at mitigating uncertainty in predictive problems [10]. In recent years, a plethora of forecasting models have emerged, contributing valuable insights into the housing market [11-13]. employed Random Forest, ridge regression, and linear regression for real estate value forecasting, demonstrating the superiority of Random Forest in mean absolute error (also observed in [14-16]). Similarly, [17] estimated real estate prices using Support Vector Machine (SVM), Random Forest (RF), and gradient boosting machine (GBM), revealing GBM's superior performance in terms of Mean Squared Error (MSE) compared to SVM and RF.
3. Methods
3.1. Random Forest
Random Forest (RF) is an ensemble machine learning approach. RF models are constructed by using a collection of decision trees based on the training data. Instead of taking the target value from a single tree, the Random forest algorithm makes a prediction on the average prediction of a collection of trees. The algorithm first builds a large number of decision tree classifiers separately so that the collection of the classifiers is a forest, and its processing flow chart is shown in Figure 1.
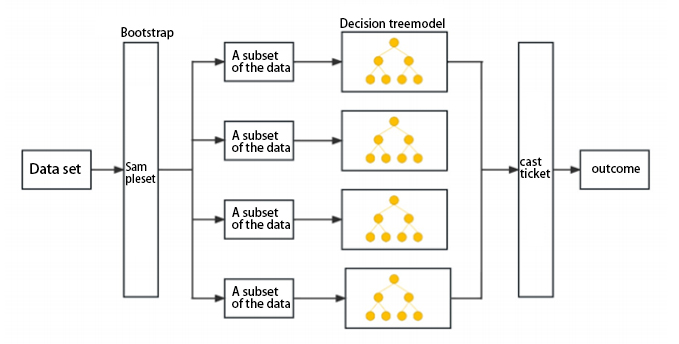
RF is advantageous for its suitability with high-dimensional data, fast training, resistance to overfitting, and insensitivity to missing values, maintaining accuracy even with significant feature absence.
3.2. Back Propagation neural network model
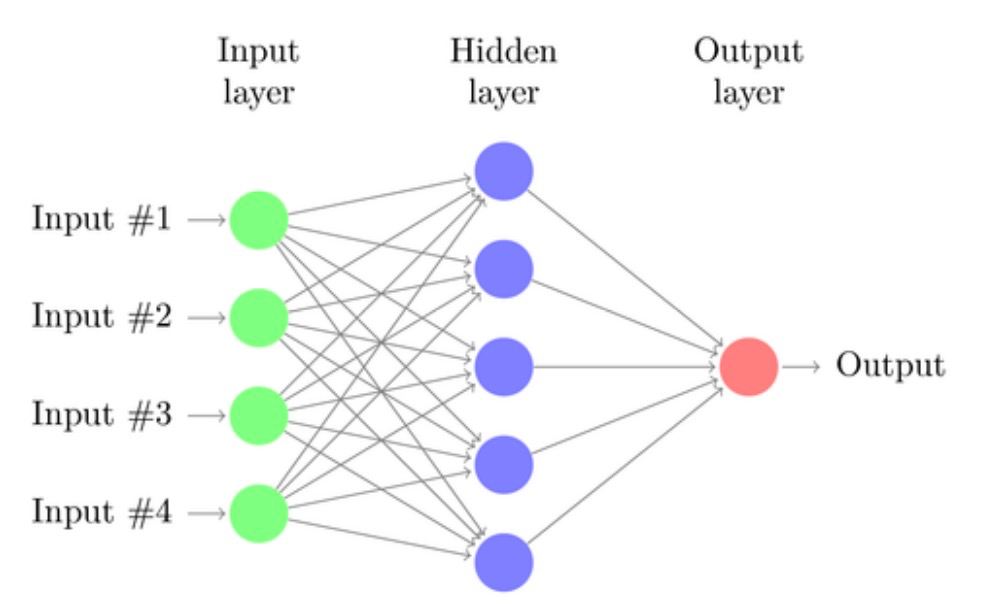
Back Propagation (BP) neural networks is a neural network training method based on chain derivation rule. BP neural networks are usually composed of multiple layers, including an input layer, an output layer, and one or more hidden layers. Each layer is
composed of multiple neuronal nodes, and the layers are connected with each other by a fully connected way, but the neurons in the same layer are independent of each other. The training process of BP neural networks involves constantly adjusting the connection weights to minimize the error between the output result and the desired output, usually using optimization algorithms such as gradient descent.
It plays a key role in the field of neural networks, is often used to simulate human learning thinking ability, and is widely used in various fields, including value assessment and price prediction.
3.3. Seagull Optimization Algorithm (SOA)
The Seagull Optimization Algorithm (SOA) is a nature-inspired optimization algorithm that mimics the foraging behavior of seagulls. The optimization algorithm of seagull mainly includes two stages: migration process and attack process.
The migration process belongs to the global search phase; however, it should meet the following conditions:
avoid collision. In order to avoid collision with neighboring seagulls, A control variable A is introduced in the model to obtain the new position of the seagull.
The above formula represents the new position,  is the number of iterations, and
where  can control the frequency of
  decreases linearly from 2 to 0.
(2) Optimal position direction: When condition (1) is satisfied, they will fly in the direction of the best position.
where  represents the direction of the best position, and parameter
  is the random number responsible for balancing global search and local search.
 is a random number between
where
3.4. Lion swarm optimization algorithm
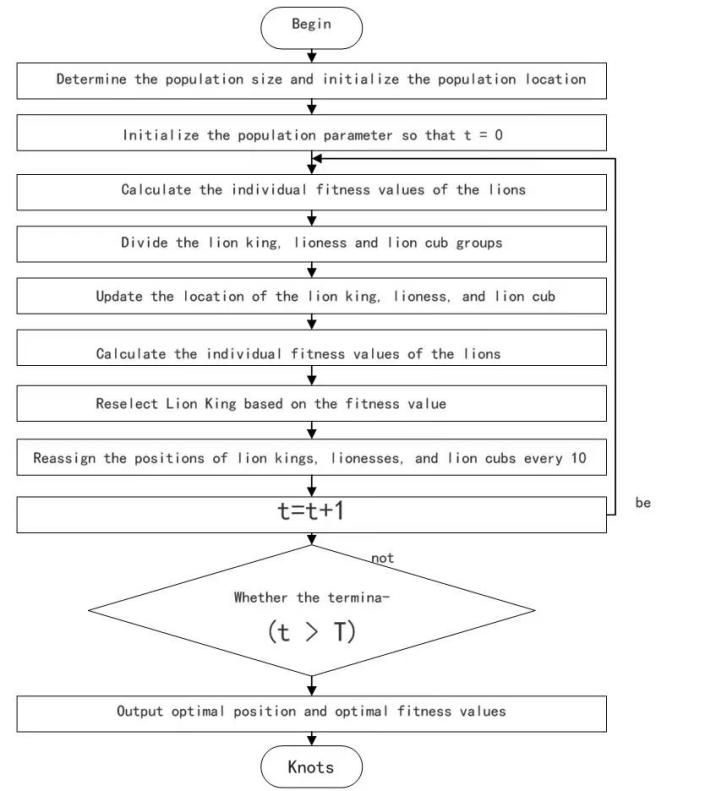
The lion swarm optimization algorithm (LSO) is a type of population-based intelligent optimization algorithm that is modeled on the cooperative hunting behavior of lions. The LSO divides the lion pride into three parts, namely: the lion king, the lion mother, and the lion cub. The lion king is the individual with the best fitness value. A certain number of individuals are assigned to lionesses each lioness, who then collaboratively hunt prey. During the hunting process, they first explore a wide area, and when they get close to the prey, they gradually narrow the circle and kill for food. The lion cubs, also known as shadowing lions, mainly follow the lion king and the lionesses.
The updated formula for the lion king is as follows:
Where  represents the new location generated after the update,
  is the historical optimal position of the
  lion in the
  generation,
  is the optimal position of the
  generation population, and
  is the random number generated according to the normal distribution
The update formula for lioness is as follows:
where for the  lion,
lion,  is the historical optimal position of the
  is the historical optimal position of a collaboration partner randomly selected from the
  generation lioness,
  is the disturbance factor,
  and
and  are the upper and lower mean values of each dimension value range respectively, and
  is the maximum number of iterations. The formula for updating the position of the young lion is as follows:
where  indicates the location of the young lions after the update,
  is the random number generated according to the normal distribution
 is the historical optimal position of the
  lion's
  generation; The best position for the
  generation of lions; In the position far away from the lion,
  is a typical elite reverse learning idea;
  is the maximum number of iterations.
3.5. Model performance evaluation
 is a coefficient used to evaluate the fit of linear regression model coefficients, with a value range of 0 to 1, its value indicates what percentage of
  can be explained by
  . The
. The  can explain
  better, and the better the model fits to the data. We can use the observed value
 , the mean value
  , and the predicted value
  to calculate
  :
:
The mean square error (MSE) can calculate the difference between each predicted value and the observed value, squares it and adds it up, and takes the average. On this basis, adding a square root to it is root of the mean square error (RMSE):
RMSE can evaluate the degree of change of the data. The smaller the value of RMSE, the better the accuracy of the prediction model to describe the experimental data.
4. Data analysis
4.1. Data preprocessing
There are 90503 in the dataset with 22 attributes. Figure 4.1 shows the relationship between house demands (right) as well as prices (left) and the area of houses. We can see that the distribution of area follows a long-heavy tail, which indicates that smaller houses with lower prices exhibit higher demanded.
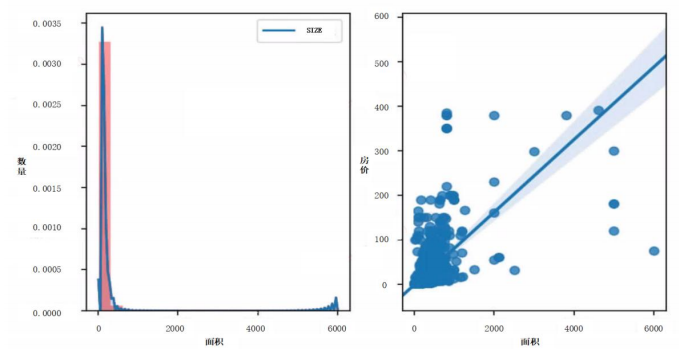
Figure 4 shows regional house demand and price with area drawn by Distplot and Kdeplot. We conduct data preprocessing to make sure data’s accuracy and reliability. It involves various procedures including removing duplicates, filling missing values by 0/1, normalizing data to the interval [0,1], transforming data.
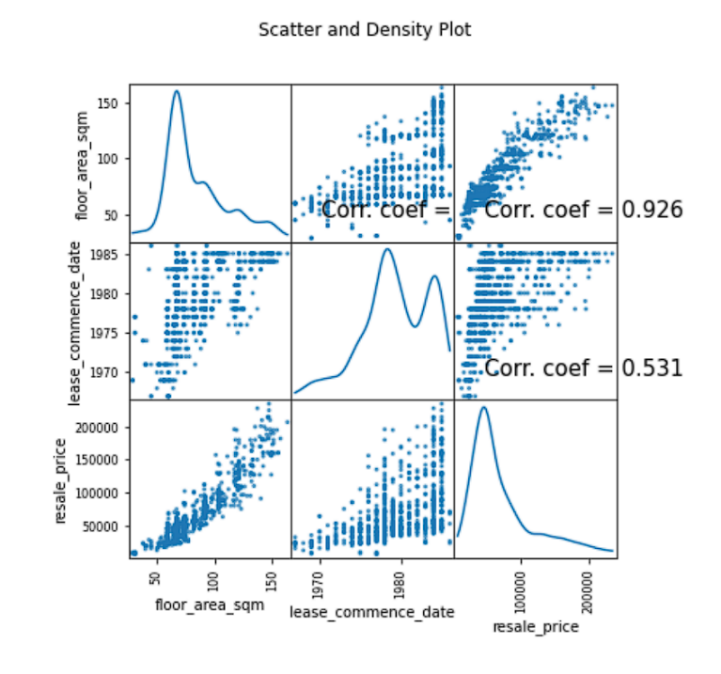
Then the grey correlation analysis is applied to evaluate the correlation between 22 variables with the aim to identify the most significant factors that influence the house prices and then calculating the grey correlation degree between these factors. We find that the combination of multiple variables may have a significant impact on the prediction results, that is, the number of rooms, month, town, block, street name, and floor range. Through the analysis of these variables, we can find that in the same town (ANG MO KIO), different blocks, streets, and floor ranges, as well as different months, may also affect the housing price. Among those, three factors: resale price, lease commence date and floor area square meters, are the most significant factors that influence the housing prices. The grey relational analysis of these three factors is given in Figure 5
4.2. Experiment analysis
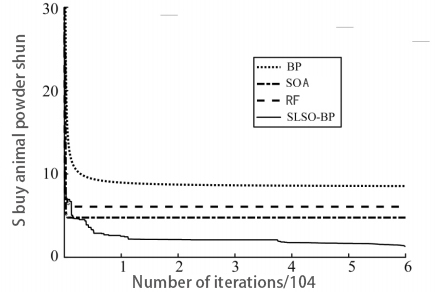
In the experiment, we set the BP neural network consisting of an input layer with 7 nodes, a hidden layer with 20 nodes, and an output layer with 1 node. The improved SLSO population is 50, the population of the comparison test LSO and SLSO to be 50, the acceleration constant is  , the inertia weight attenuates from 0.9 to 0.4, and the supervision threshold is 0.1. The interval of weight and bias values is [-5, 5]. Both the improved algorithm and the comparison algorithm are iterated 60 000 times for training. The iteration curves of the training errors of each method is shown in Figure 6.
|
Method |
Training MSE |
Test MSE |
|
BP |
8.5485 |
2.8320 |
|
RF |
4.7650 |
2.6202 |
|
SOA |
6.0717 |
0.8106 |
|
SLSO-BP |
1.3122 |
0.2994 |
Table 1 shows the final training errors of different methods. Compared with BP neural network, particle swarm optimization algorithm and lion pride algorithm to optimize BP neural network, the SLSO-BP model proposed in this study can obtain smaller training errors. Meanwhile, when tested on the test set, the model in this study can also obtain smaller test errors.
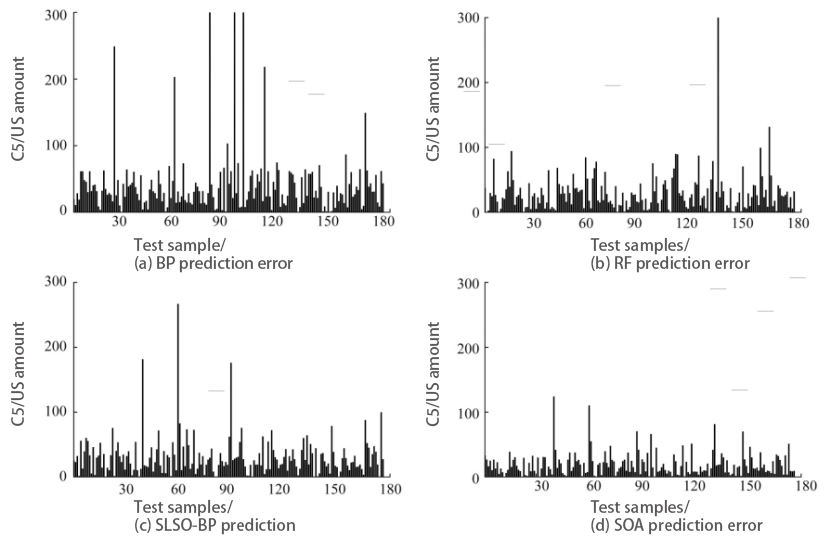
As can be seen intuitively from Figure 7 ccompared with other methods, the test results of SLSO-BP model on the test data set are relatively ideal, with fewer predicted outliers, and the overall error with the actual value is within a small range. The lion pride algorithm is combined with BP neural network to solve the defects of slow convergence and low training accuracy of BP neural network itself, and the optimized lion pride algorithm is used to replace the gradient descent method in BP neural network as a whole, so as to better optimize the connection weight between the layers of BP network. In addition, the generalization ability, learning ability and convergence speed of BP neural network are improved.
5. Conclusion
This research delves into the practical integration of machine learning for house pricing analysis in Singapore. Through meticulous procedures involving statistical analysis and property price data management, coupled with an assessment of influential factors, we utilized four prominent machine learning models—BP neural network, RF, SOA, and SLSO-BP—for predicting house prices. Performance assessment, gauged by Root Mean Squared Error (RMSE), highlighted the superior accuracy of the SLSO-BP model in forecasting house attribute trends and their impact on prices.
Acknowledging the imperative for heightened precision in forecasting, the industry actively gathers high-quality data, incorporating diverse sources such as high-resolution satellite imagery, real-time transaction data, and insights from social media trends. This enriched dataset not only aids models in understanding market dynamics but also aligns them with evolving customer preferences. However, processing such extensive, multi-dimensional data necessitates substantial computational resources, highlighting the resource-intensive nature of training and optimizing machine learning models.
Moreover, the real estate market's susceptibility to external influences, including economic fluctuations, policy changes, and social shifts, introduces complexities into forecasting. Continuous research endeavors are essential to ensure the accuracy and resilience of machine learning applications in this dynamic context. Through iterative optimization and adaptation throughout the implementation process, taking into account the aforementioned factors, machine learning, in tandem with big data, can significantly contribute to real estate valuation. This contribution extends to furnishing decision-makers with more precise and reliable insights, thereby facilitating informed and strategic decision-making amid the dynamic landscape of the real estate market.
References
[1]. Pozdena, R. J. (1987). Tax policy and corporate capital structure. Economic Review-Federal Reserve Bank of San Francisco, (4), 37.
[2]. Quigley, J. M. (2002). Real estate prices and economic cycles.
[3]. Jain, M., Taubenböck, H., & Namperumal, S. (2011). Seamless urbanization and knotted city growth: Delhi Metropolitan Region (pp. 853-862).
[4]. Shi, S., Jou, J.-B., and Tripe, D. (2014). Can interest rates really control house prices? Effectiveness and implications for macroprudential policy. Journal of Banking & Finance, 47, 15–28.
[5]. Franck, M., Eyckmans, J., De Jaeger, S., & Rousseau, S. (2015). Comparing the impact of road noise on property prices in two separated markets. Journal of Environmental Economics and Policy, 4(1), 15-44.
[6]. Zhao, H., Wayne, S. J., Glibkowski, B. C., et al. (2007). The Impact of Psychological Contract Breach on Work-Related Outcomes: A Meta-Analysis. Personnel Psychology, 60, 647-680.
[7]. Crawford, G. W., & Fratantoni, M. C. (2003). Assessing the forecasting performance of regime‐switching, ARIMA and GARCH models of house prices. Real Estate Economics, 31(2), 223-243.
[8]. Cortes, C., & Vapnik, V. (1995). Support-vector networks. Machine Learning, 20, 273-297.
[9]. Breiman, L. (2001). Random forests. Machine Learning, 45, 5-32.
[10]. Mullainathan, S., & Spiess, J. (2017). Machine learning: An applied econometric approach. Journal of Economic Perspectives, 31(2), 87-106.
[11]. Cao, B., & Yang, B. (2018). Research on ensemble learning-based housing price prediction model. Big Geospatial Data and Data Science, 1(1), 1-8.
[12]. Guo, J. Q., Chiang, S. H., Liu, M., Yang, C. C., & Guo, K. Y. (2020). Can machine learning algorithms associated with text mining from internet data improve housing price prediction performance? International Journal of Strategic Property Management, 24(5), 300-312.
[13]. Koktashev, V., Makee, V., Shchepin, E., Peresunko, P., & Tynchenko, V. V. (2019). Pricing modeling in the housing market with urban infrastructure effect. Journal of Physics: Conference Series, 1353, 012139.
[14]. Varian, H. R. (2014). Big data: New tricks for econometrics. Journal of Economic Perspectives, 28, 3–28.
[15]. Ahmad, M. W., Mourshed, M., Rezgui, Y. Trees vs neurons: Comparison between random forest and ANN for high–resolution prediction of building energy consumption. Energy Build. 2017, 147, 77–89.
[16]. Wang, C. C., Wu, H. A new machine learning approach to house price estimation. New Trends Math. Sci. 2018, 6, 165–171.
[17]. Ho, W. K., Tang, B. S., & Wong, S. W. (2021). Predicting property prices with machine learning algorithms. Journal of Property Research, 38(1), 48-70.
Cite this article
Hu,Y. (2025). Singapore House Price Forecasting Using Machine Learning. Advances in Economics, Management and Political Sciences,210,20-30.
Data availability
The datasets used and/or analyzed during the current study will be available from the authors upon reasonable request.
Disclaimer/Publisher's Note
The statements, opinions and data contained in all publications are solely those of the individual author(s) and contributor(s) and not of EWA Publishing and/or the editor(s). EWA Publishing and/or the editor(s) disclaim responsibility for any injury to people or property resulting from any ideas, methods, instructions or products referred to in the content.
About volume
Volume title: Proceedings of ICFTBA 2025 Symposium: Data-Driven Decision Making in Business and Economics
© 2024 by the author(s). Licensee EWA Publishing, Oxford, UK. This article is an open access article distributed under the terms and
conditions of the Creative Commons Attribution (CC BY) license. Authors who
publish this series agree to the following terms:
1. Authors retain copyright and grant the series right of first publication with the work simultaneously licensed under a Creative Commons
Attribution License that allows others to share the work with an acknowledgment of the work's authorship and initial publication in this
series.
2. Authors are able to enter into separate, additional contractual arrangements for the non-exclusive distribution of the series's published
version of the work (e.g., post it to an institutional repository or publish it in a book), with an acknowledgment of its initial
publication in this series.
3. Authors are permitted and encouraged to post their work online (e.g., in institutional repositories or on their website) prior to and
during the submission process, as it can lead to productive exchanges, as well as earlier and greater citation of published work (See
Open access policy for details).
References
[1]. Pozdena, R. J. (1987). Tax policy and corporate capital structure. Economic Review-Federal Reserve Bank of San Francisco, (4), 37.
[2]. Quigley, J. M. (2002). Real estate prices and economic cycles.
[3]. Jain, M., Taubenböck, H., & Namperumal, S. (2011). Seamless urbanization and knotted city growth: Delhi Metropolitan Region (pp. 853-862).
[4]. Shi, S., Jou, J.-B., and Tripe, D. (2014). Can interest rates really control house prices? Effectiveness and implications for macroprudential policy. Journal of Banking & Finance, 47, 15–28.
[5]. Franck, M., Eyckmans, J., De Jaeger, S., & Rousseau, S. (2015). Comparing the impact of road noise on property prices in two separated markets. Journal of Environmental Economics and Policy, 4(1), 15-44.
[6]. Zhao, H., Wayne, S. J., Glibkowski, B. C., et al. (2007). The Impact of Psychological Contract Breach on Work-Related Outcomes: A Meta-Analysis. Personnel Psychology, 60, 647-680.
[7]. Crawford, G. W., & Fratantoni, M. C. (2003). Assessing the forecasting performance of regime‐switching, ARIMA and GARCH models of house prices. Real Estate Economics, 31(2), 223-243.
[8]. Cortes, C., & Vapnik, V. (1995). Support-vector networks. Machine Learning, 20, 273-297.
[9]. Breiman, L. (2001). Random forests. Machine Learning, 45, 5-32.
[10]. Mullainathan, S., & Spiess, J. (2017). Machine learning: An applied econometric approach. Journal of Economic Perspectives, 31(2), 87-106.
[11]. Cao, B., & Yang, B. (2018). Research on ensemble learning-based housing price prediction model. Big Geospatial Data and Data Science, 1(1), 1-8.
[12]. Guo, J. Q., Chiang, S. H., Liu, M., Yang, C. C., & Guo, K. Y. (2020). Can machine learning algorithms associated with text mining from internet data improve housing price prediction performance? International Journal of Strategic Property Management, 24(5), 300-312.
[13]. Koktashev, V., Makee, V., Shchepin, E., Peresunko, P., & Tynchenko, V. V. (2019). Pricing modeling in the housing market with urban infrastructure effect. Journal of Physics: Conference Series, 1353, 012139.
[14]. Varian, H. R. (2014). Big data: New tricks for econometrics. Journal of Economic Perspectives, 28, 3–28.
[15]. Ahmad, M. W., Mourshed, M., Rezgui, Y. Trees vs neurons: Comparison between random forest and ANN for high–resolution prediction of building energy consumption. Energy Build. 2017, 147, 77–89.
[16]. Wang, C. C., Wu, H. A new machine learning approach to house price estimation. New Trends Math. Sci. 2018, 6, 165–171.
[17]. Ho, W. K., Tang, B. S., & Wong, S. W. (2021). Predicting property prices with machine learning algorithms. Journal of Property Research, 38(1), 48-70.