


1. Introduction
1.1. Idea
We have developed four distinct strategies, each with its own focus. First, the Post Number Alpha strategy is based on the positive correlation between social media mentions and stock prices. It posits that when the number of posts about a stock increases, it attracts more investors to buy, thereby driving the stock price up in a linear trend. Next, the RSI and Sentiment Score Alpha strategy integrates social media sentiment analysis with the traditional technical indicator RSI, suggesting that market sentiment not only reflects the immediate public reaction to stock prices but also plays a significant role in driving future price fluctuations. The third strategy, Sentiment-VIX Alpha, combines daily sentiment scores with market volatility (VIX) to analyze how comments from social media platforms and influencers guide amateur investors' trades, quantifying the potential impact of social sentiment on future market price movements. Lastly, the Sentiment Score Alpha strategy focuses on the relationship between negative investor sentiment and stock price synchronization, positing that positive sentiment attracts more investors and pushes stock prices higher, while negative sentiment creates selling pressure, leading to lower stock prices. Together, these strategies highlight the critical role of social media sentiment in influencing market dynamics [1].
1.2. Highlight
1.2.1. Economic intuition
The economic intuition behind each of the four strategies is as follows. First, when a stock is frequently mentioned on social media, its price often rises because more people become interested and decide to buy it. Studies show that when retail investors engage, the rapid spread of new information on platforms like Twitter and Reddit can significantly affect stock price movements. Second, market sentiment, especially as reflected in social media comments, can provide insights into future stock performance. Positive sentiment typically indicates rising investor confidence, pushing prices higher, while negative sentiment signals caution. By combining sentiment scores with RSI, we can capture both emotional and technical market movements more effectively. Third, predictions and recommendations on social media often influence amateur investors, causing short-term fluctuations in stock prices. However, these fluctuations are typically unsustainable due to a lack of fundamental support, with prices eventually reverting to normal through profit-taking or bargain buying. Lastly, social media sentiment can significantly impact stock prices, with positive sentiment drawing in more investors and driving prices up, while negative sentiment may create selling pressure, pushing prices lower [2].
1.2.2. Signal generation
The signal generation for each strategy is as follows. First, historical and real-time social media posts mentioning specific stocks are gathered from Eastmoney Guba forum, and the difference between the current post count and the post count from one week ago is calculated as the raw alpha. Second, for each stock, the daily sentiment score is calculated using Snownlp, followed by calculating the RSI based on the past 14 days of stock prices, and then multiplying the RSI from seven days ago by the sentiment score. Third, trading signals are generated by analyzing positive and negative mentions of stocks, tracking sentiment changes after influential social media predictions, and using VIX values to predict market volatility. Lastly, sentiment scores are assigned to posts using sentiment analysis tools and machine learning models, with changes in sentiment trends computed over a seven-day period to predict stock movements.
1.2.3. Portfolio construction
The portfolio construction for the four strategies is as follows. First, rank the stocks based on the raw alpha from highest to lowest, and normalize the ranks by subtracting the mean rank within each sector to ensure sector neutrality. Second, focus on the top 20% of stocks with the highest alpha values for long positions and the bottom 20% for short positions. Third, rank stocks based on their net sentiment scores, going long on the highest sentiment scores and shorting the lowest, while adjusting sentiment scores by multiplying them by 1/VIX to account for market volatility. Finally, invest in the top and bottom sentiment-rated stocks, ensuring market neutrality by balancing the dollar amounts invested in both long and short positions.
1.2.4. Performance estimate
|
Annual Return |
7% |
|
Information Ratio |
0.65 |
|
Sharpe Ratio |
0.38 |
2. Specification
2.1. Economic intuition
In the current era, social media has become an integral part of people's lives, and social media platforms serve as crucial sources of information. When a stock is frequently mentioned on social media, its visibility increases, attracting more investor attention and buying interest, which in turn drives up the price. This rapid spread of information often influences market perceptions and stock valuations. At the same time, social media platforms capture real-time investor sentiment and opinions. For example, East Money Stock Forum, the largest financial and stock information platform in China, has significant influence among investors. Positive sentiment is reflected in sentiment scores closer to 1, driving demand for a stock, while negative sentiment scores closer to 0 often lead to selling pressure, impacting stock prices [3]. Additionally, predictions and recommendations on social media can significantly affect amateur investors, leading to short-term stock price fluctuations. These investors are often driven by emotions, and when large numbers of them buy a stock based on optimistic social media sentiment, the price can rise rapidly. However, this rise is often unsustainable due to a lack of fundamental support, and prices may eventually fall back as profit-taking occurs. By combining RSI indicators with sentiment analysis, we can better capture both market sentiment and technical shifts. For instance, an RSI above 70 indicates potential overvaluation and calls for caution, while an RSI below 30 signals oversold conditions and possible buying opportunities [4]. This combination of indicators helps in making balanced, data-driven investment decisions .
2.2. Quant analysis
• Annual Return: ann_pnl/(booksize/2)
• Information Ratio: (average daily return)/(daily volatility)*sqrt(256)
• Sharpe Ratio: (average daily return - risk-free return)/(daily volatility)*sqrt(256)
2.3. Data
Universe: CSI 300 (282 stocks consistently remained within the range of the CSI300 during the time period)
Date Range: 2019/6/3 - 2021/6/30 (in sample)
2021/7/1 - 2022/5/31 (out sample)
Data Sets: User comments from the EastMoney Guba forum; Stock Price from iFind
Database: EastMoney Information Forum; iFind
2.4. Strategy detail
2.4.1. Signal generation
(1) Number_posts-Number_posts_7 (one week ago)
(2) RSI_7×Sentiment Score (RSI_7 means RSI from 7 days ago)
(3) ((Daily Sentiment_Score - Daily Sentiment_Score7)/Daily Sentiment_Score7)*(1/VIX)
(4) Sentiment Scoretoday−Sentiment Scoren 7 days ago
2.4.2. Portfolio construction
(1) Ranked Alpha = Rank(Raw_Alpha)/Number_Raw_Alpha
(2)Neutral Alpha = Ranked_Alpha - Average_Ranked_Alpha
(3)Market Value for Each Stock = Neutral_Alpha * Total_Capital
2.5. Transaction cost estimate
Transaction fee: 0.2% of the transaction amount per share
Total Transaction Cost = Trade Volume*Transaction fee per share
Slippage (the difference between the expected price of a trade and the actual price at which the trade is executed.): 0.2%
3. Implementation
3.1. Strategy 1
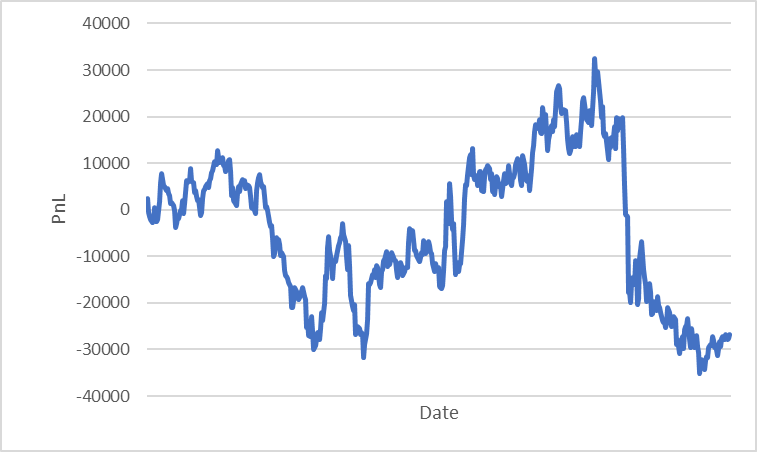
Annual Return: -1.30%
Information Ratio: -0.30
Sharpe Ratio: -0.93
Figure 1 shows the cumulative profit and loss of the strategy. An annual return of -1.30% means that the alpha made the investment lose 1.3% over a year. The Information Ratio of -0.3 indicates that the alpha is not good at turning risk into profit. A Sharpe Ratio of -0.93 suggests the alpha does not justify the risk taken, doing worse than a safe investment. Overall, the statistics suggest the investment strategy isn't working well and needs to be reviewed to improve performance and manage risks better [5].
3.2. Strategy 2
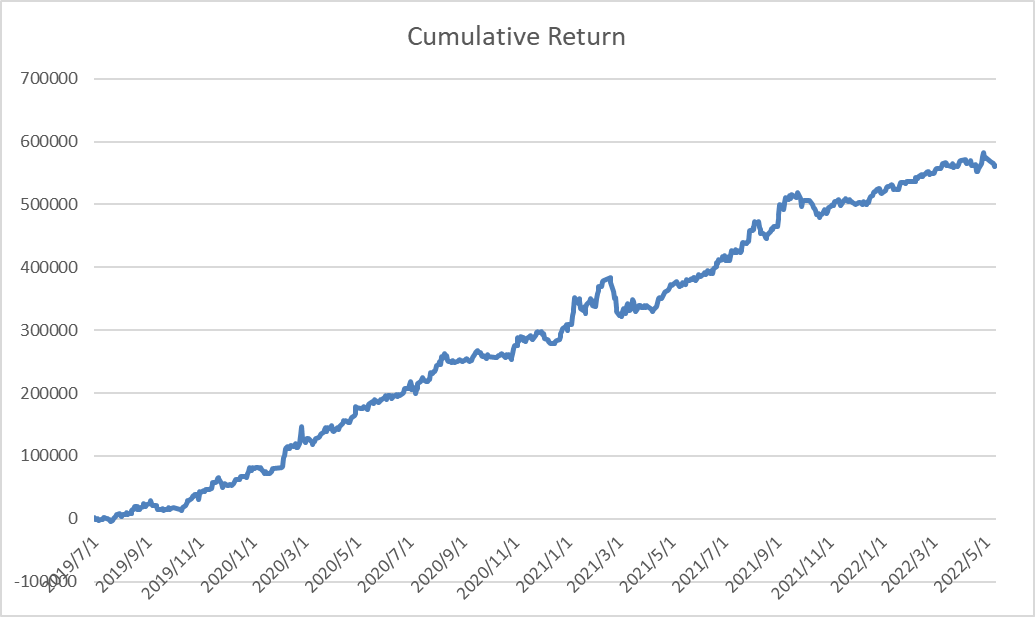
AR: 15.63%
IR: 2.94
Sharpe Ratio: 2.44
Figure 2 shows the cumulative profit and loss of the strategy. The results appear too ideal, both visually and statistically. A likely reason for this is the potential overlap in the influence of RSI and sentiment scores. When market sentiment is positive, prices tend to rise, and vice versa, causing the impact of sentiment scores to be overshadowed by RSI. Additionally, from a formulaic perspective, RSI is directly multiplied by the sentiment score, with RSI ranging from 0 to 100 and the sentiment score ranging from 0 to 1. This gives RSI too much weight in the alpha calculation, thus failing to reflect the impact of extreme sentiment scores adequately. Although the alpha shows promising returns, our research focuses on constructing an alpha related to social media. The sentiment score functions more as an auxiliary indicator in the above model.
3.3. Strategy 3
AR: 61.00%
IR: 0.70
Sharpe Ratio: 0.74
Figure 3 shows the cumulative profit and loss of the strategy. Based on the calculated data, the strategy shows good performance in terms of risk-adjusted returns. Specifically, the high annual return indicates strong investment return capability. The information ratio shows acceptable performance in surpassing benchmark returns. Moreover, the Sharpe ratio indicates the ability to achieve excess returns, which also means significant advantages in risk management. However, the strategy also has some drawbacks. Firstly, the strategy may perform well on historical data but may not maintain the same performance in actual markets, indicating a risk of overfitting. Secondly, the sentiment scores and VIX data may have limitations and extreme values in certain periods, affecting the accuracy of the results. Additionally, while the strategy performs well in specific market environments, its performance under different market conditions is uncertain, especially during periods of low or high market volatility. Therefore, it may be necessary to incorporate more data sources to improve the stability of the strategy.
3.4. Strategy 4
AR:0.3015
IR :0.3886
Sharpe ratio: 0.78
Figure 4 shows the cumulative profit and loss of the strategy.
4. Refinement
4.1. Strategy 1
4.1.1. Description
My previous alpha is Number_posts-Number_posts_7, which may not be reasonable because the change of post number does not have a comparative item. Therefore, I bring in the concept of growth rate, which quantifies the change in the frequency of posting over a specified period. A positive growth rate indicates an increase in activity, while a negative growth rate suggests a decline. Additionally, the increase in posts has two sides: the increase of positive and negative posts [6]. Therefore, I add the sensitive score of each post into my alpha. I calculate the growth rate of sentiment score in one week and time with the growth rate of post number to create a new alpha:
Raw Alpha =
((Number_posts-Number_posts_7)/Number_posts_7)*
(Sentiment_score-Sentiment_score_7)/Sentiment_score_7)
4.1.2. Statistics
Annual Return: 3.23%
Information Ratio: 1.21
Sharpe Ratio: 0.21
Figure 5 shows the cumulative profit and loss of the strategy for the refined version. An annual return of 3.23% means that the investment gained 3.18% over a year. The Information Ratio of 1.21 indicates that the alpha is good at turning risk into profit, generating 1.21 units of excess return per unit of risk. A Sharpe Ratio of 0.21 suggests the alpha justifies the risk taken, doing better than a safe investment. Overall, the statistics suggest the investment strategy is working effectively, showing solid performance and good risk management.
4.2. Strategy
4.2.1. Description
I applied non-linear transformations to the RSI and sentiment scores to enhance the alpha factor, specifically using Alpha=b1*log(RSI_7+1) + b2*(Sentiment Score)^2. In my opinion, Firstly, this approach helps capture RSI’s diminishing marginal effects, which means that changes in RSI have a more substantial impact on stock prices when RSI levels are low and a lesser effect when RSI levels are high. Secondly, Squaring the sentiment score (Sentiment Score)^2 emphasizes the impact of extreme sentiments, both positive and negative. By performing a regression analysis with these transformed variables as predictors and future stock returns as the dependent variable, I determined the coefficients: a constant term of -32.584179, b1 for log(RSI_7+1) as 17.544187, and b2 for (Sentiment Score)^2 as 1.014214.
Alpha=17.544187*log(RSI_7+1) +1.014214*(Sentiment Score)^2
(The "+1" is included to prevent the logarithm from being undefined when RSI equals 0.)
4.2.2. Statistics

AR: 5.77%
IR: 0.86
Sharpe Ratio: 0.47
Figure 6 shows the cumulative profit and loss of the strategy for the refined version.
4.3. Strategy 3
4.3.1. Description
The new Alpha strategy incorporates a 3-day simple moving average (SMA) of sentiment scores to smooth out short-term fluctuations, providing more stable predictions for investment decisions. The original sentiment scores may be influenced by daily market external conditions, leading to significant short-term volatility. By calculating the 3-day SMA, we can capture longer-term market sentiment trends. Additionally, incorporating the VIX index helps reduce the impact of sentiment signals during periods of high market volatility, preventing overinvestment in high-risk periods. Based on this new Alpha strategy, we predict that the results will be more stable and consistent. The annual return is expected to remain high, and risk-adjusted returns are anticipated to improve.
Refined Alpha: ((SMA(Daily Sentiment Score3)-Daily Sentiment Score7)/Daily Sentiment Score7)*(1/VIX)
• SMA=(Daily Sentiment Score+Daily Sentiment Score(one day ago)+Daily Sentiment Score(two day ago))/3
• Daily Sentiment_Score7: The sentiment score for the same stock from seven days ago.
• VIX: Represents market volatility expectations.
• 1/VIX: Adjusts for market volatility, reducing Alpha during high volatility periods.
4.3.2. Statistics
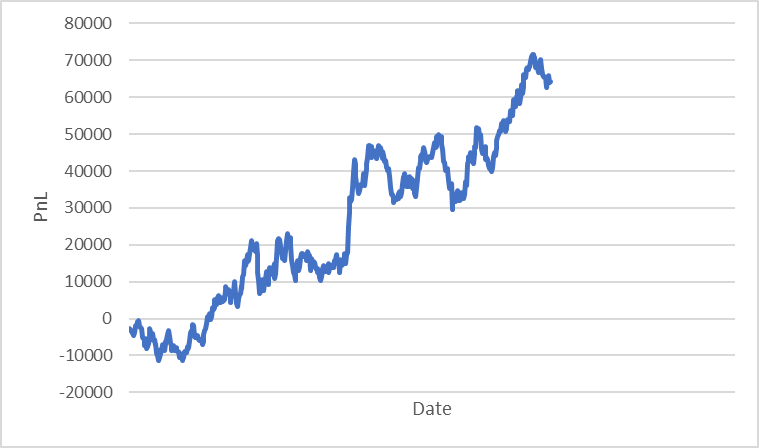
AR: 21.98%
IR: 0.79
Sharpe Ratio: 0.93
Figure 7 shows the cumulative profit and loss of the strategy for the refined version. Using SMA and smoothed daily sentiment scores to calculate the Alpha strategy, compared to the previous strategy, has the following advantages and disadvantages: Firstly, SMA can smooth out short-term fluctuations and reduce the impact of other market conditions, making market trends more apparent and stable. On the other hand, daily sentiment scores can immediately reflect the latest market changes with higher sensitivity. However, the lag effect of SMA may result in slower responses to market changes, and daily sentiment scores can be influenced by extreme values in single-day data, leading to higher volatility. Overall, this strategy can balance data stability and immediacy to some extent, but it is important to consider its application in actual markets and make continuous optimizations [7].
4.4. Strategy 4
4.4.1. Description
My previous Raw Alpha = Sentiment Score Today−Sentiment Score 7 days ago. This may not reflect the overall changing patterns. The raw difference may not be normalized, meaning it doesn't consider the variability or average sentiment scores over time. This can lead to misleading conclusions, especially if sentiment scores have high volatility. Applying Normalization to Sentiment Growth Rates I calculate the growth rate of sentiment score in one week. I also introduced the number of posts stats per week to reflect the connection between sentiment and price.
4.4.2. Statistics
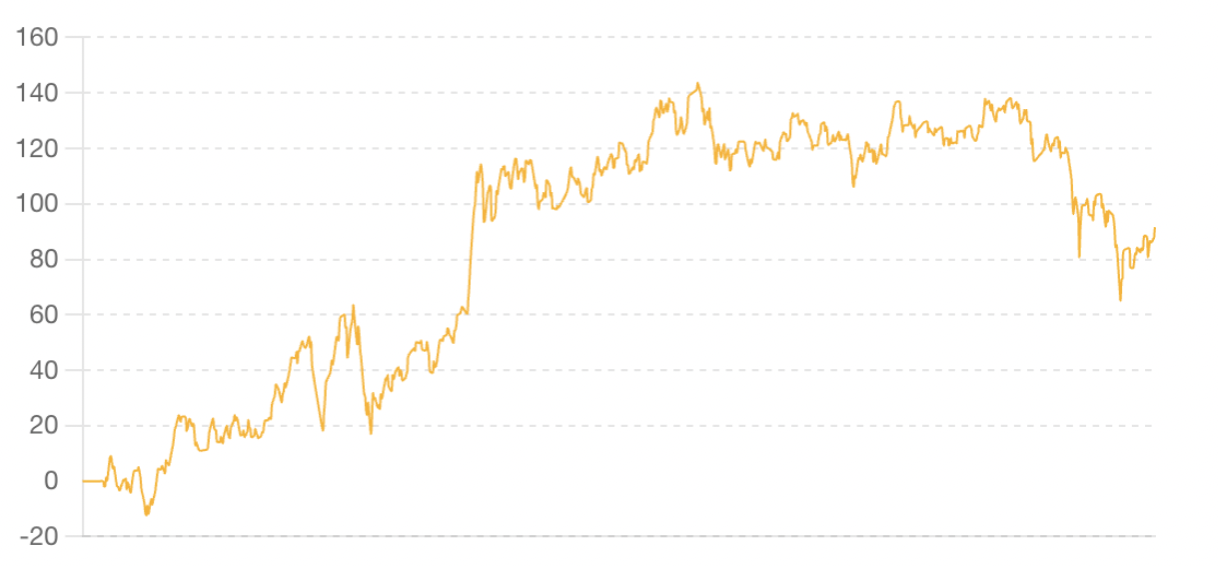
AR:2.015%
IR :0.3886
Sharpe ratio: 0.178
Figure 8 shows the cumulative profit and loss of the strategy for the refined version.
5. Conclusion
5.1. Individual part
5.1.1. Strategy 1
5.1.1.1. Final selection: refined version
Alpha = ((Number_posts-Number_posts_7)/Number_posts_7)*
(Sentiment_score-Sentiment_score_7)/Sentiment_score_7)
5.1.1.2. PnL
Annual Return: 3.30%
Information Ratio: 1.32
Sharpe Ratio: 0.25
Figure 9 shows the cumulative profit and loss of the strategy for the final selected version. For the out of sample analysis, an annual return of 3.30% means that the investment gained 3.30% over a year. The Information Ratio of 1.32 indicates that the alpha is good at turning risk into profit, generating 1.32 units of excess return per unit of risk. A Sharpe Ratio of 0.25 suggests the alpha justifies the risk taken, doing better than a safe investment. Overall, the statistics suggest the investment strategy is working effectively, showing solid performance and good risk management.
5.1.1.3. Trading recommendation
Based on the PnL graph and the statistics, I recommend applying this alpha because the trading strategy has a modest annual return (3.30%) and high information ratio (1.32), which shows the strategy’s feasibility. In addition, the Sharpe Ratio of 0.25 shows the ability of the alpha to behave well under risk. This strategy combines the growth rate of post number and sentiment score of the posts to provide a comprehensive view of the relationship between changes in posts and the market float, which imply a reasonable economic intuition.
5.1.2. Strategy 2
5.1.2.1. Final selection: refined version
Alpha=17.544187*log(RSI_7+1) +1.014214*(Sentiment Score)^2
5.1.2.2. PnL
AR: 5.77%
IR: 0.86
Sharpe Ratio: 0.47
Figure 10 shows the cumulative profit and loss of the strategy for the final selected version.
5.1.2.3. Trading recommendation
Based on the refined alpha formula, I do recommend using this alpha to focus on stocks with high alpha values for long positions and low alpha values for short positions. This approach's advantage is that it leverages market sentiment and technical analysis, providing a comprehensive view of market dynamics. The inclusion of sentiment scores captures investor moods and opinions, while the logarithmic transformation of RSI accounts for momentum with diminishing effects. However, traders should be mindful of the lagging nature of these indicators and potential biases in sentiment data.
5.1.3. Strategy 3
5.1.3.1. Final selection
((SMA (Daily Sentiment Score3)-Daily Sentiment Score7)/Daily Sentiment Score7)*(1/VIX)
5.1.3.2. PnL

AR: 21.98%
IR: 0.79
Sharpe Ratio: 0.93
Figure 11 shows the cumulative profit and loss of the strategy for the final selected version.
5.1.3.3. Trading recommendation
The new Alpha strategy smooths daily sentiment scores using SMA. This not only addresses the issue of balancing data in the original strategy but also enhances its timeliness. Such improvements allow the new strategy to more accurately capture market sentiment changes, thereby helping to increase investment returns and improve risk management. Therefore, I recommend adopting the new Alpha strategy and continuously optimizing it in practical applications to ensure its effectiveness and stability under various market conditions [8].
5.1.4. Strategy 4
5.1.4.1. Final selection
Alpha = (Sentiment Scoretoday−Sentiment Scoren 7 days ago)* (Sentiment Growth Rates per week)
5.1.4.2. PnL
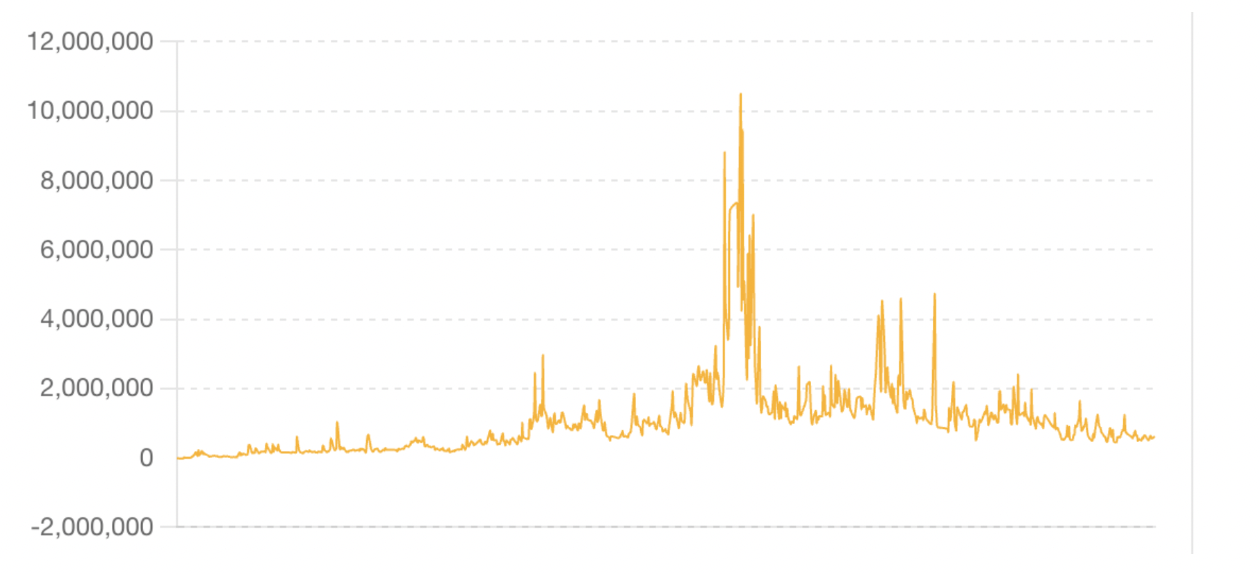
Figure 12 shows the cumulative profit and loss of the strategy for the final selected version.
5.1.4.3. Trading recommendation
We standardized the sentiment scores to normalize the data, ensuring comparability across different companies.We calculated the 7-day sentiment growth rates to identify trends and momentum in sentiment changes. We examined the direction and magnitude of sentiment growth rates to make informed trading decisions. The sentiment score is positive. A positive sentiment growth rate indicates improving investor sentiment, suggesting a potential upward trend in stock price. If a company's sentiment growth rate is consistently positive over the observed period, it signals a buying opportunity [9,10].
5.2. Group part
5.2.1. Description
For the combination part, we will use the method called signal weighting Signal A: Yanzhong Yao Alpha
Signal B: Yike Li Alpha
Signal C: Yuxuan Liu Alpha
Signal D: Yu Liu Alpha
Weight for Signal A: 0.25
Weight for Signal B: 0.25
Weight for Signal C: 0.25
Weight for Signal D: 0.25
Combined Signal=0.25*Signal A+0.25*Signal B+0.25*Signal C+0.25*Signal D(The signals were combined using the assigned weights to form a single composite signal.)
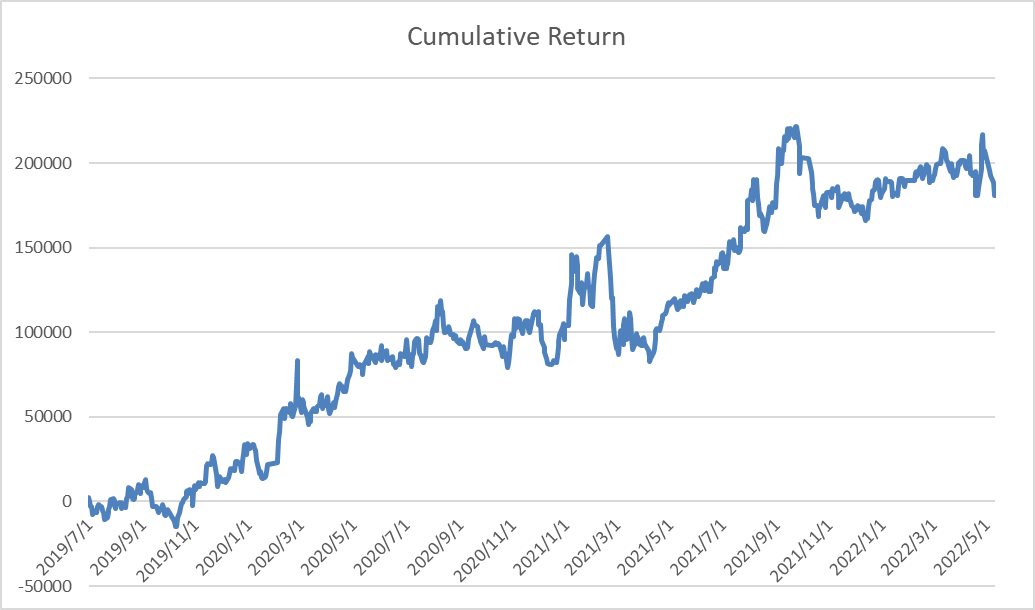
5.2.2. New PnL graph
Out of sample data:
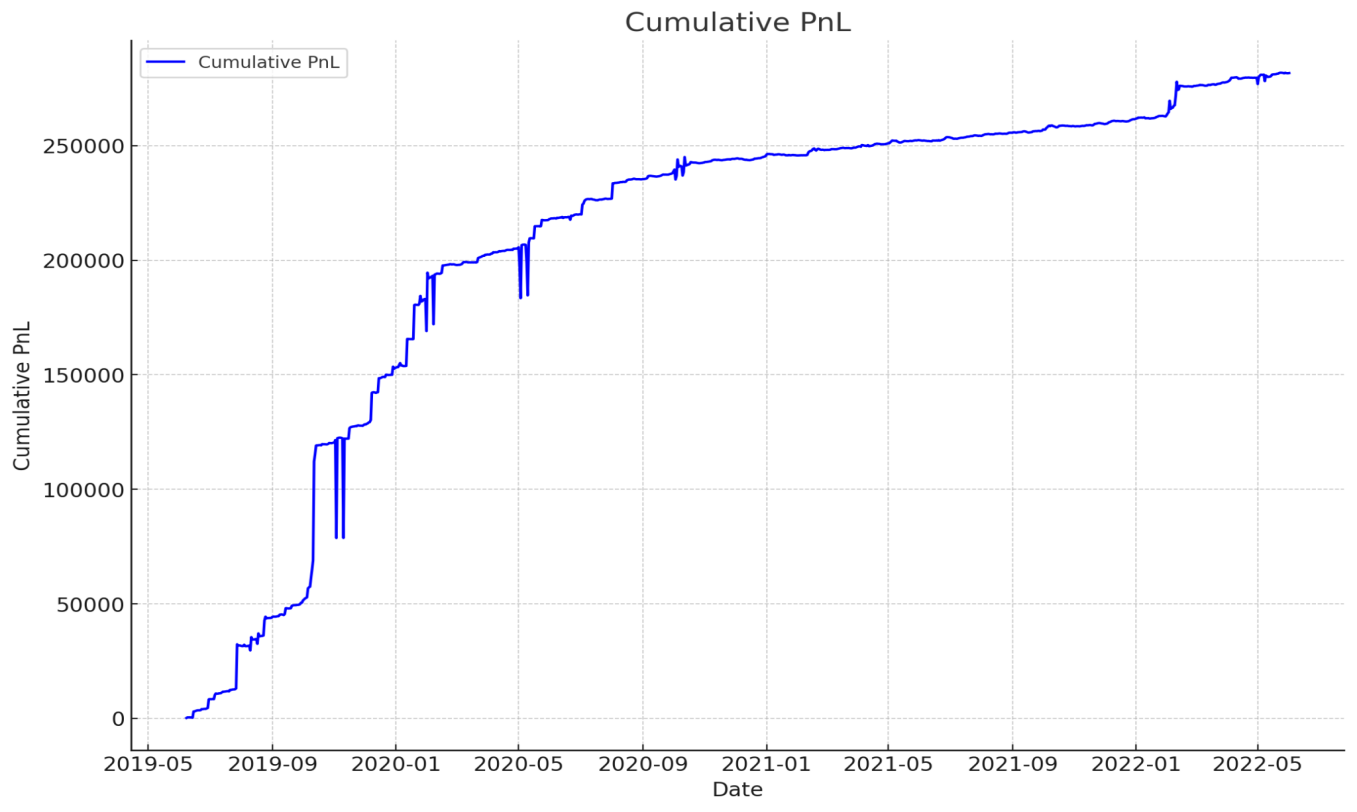
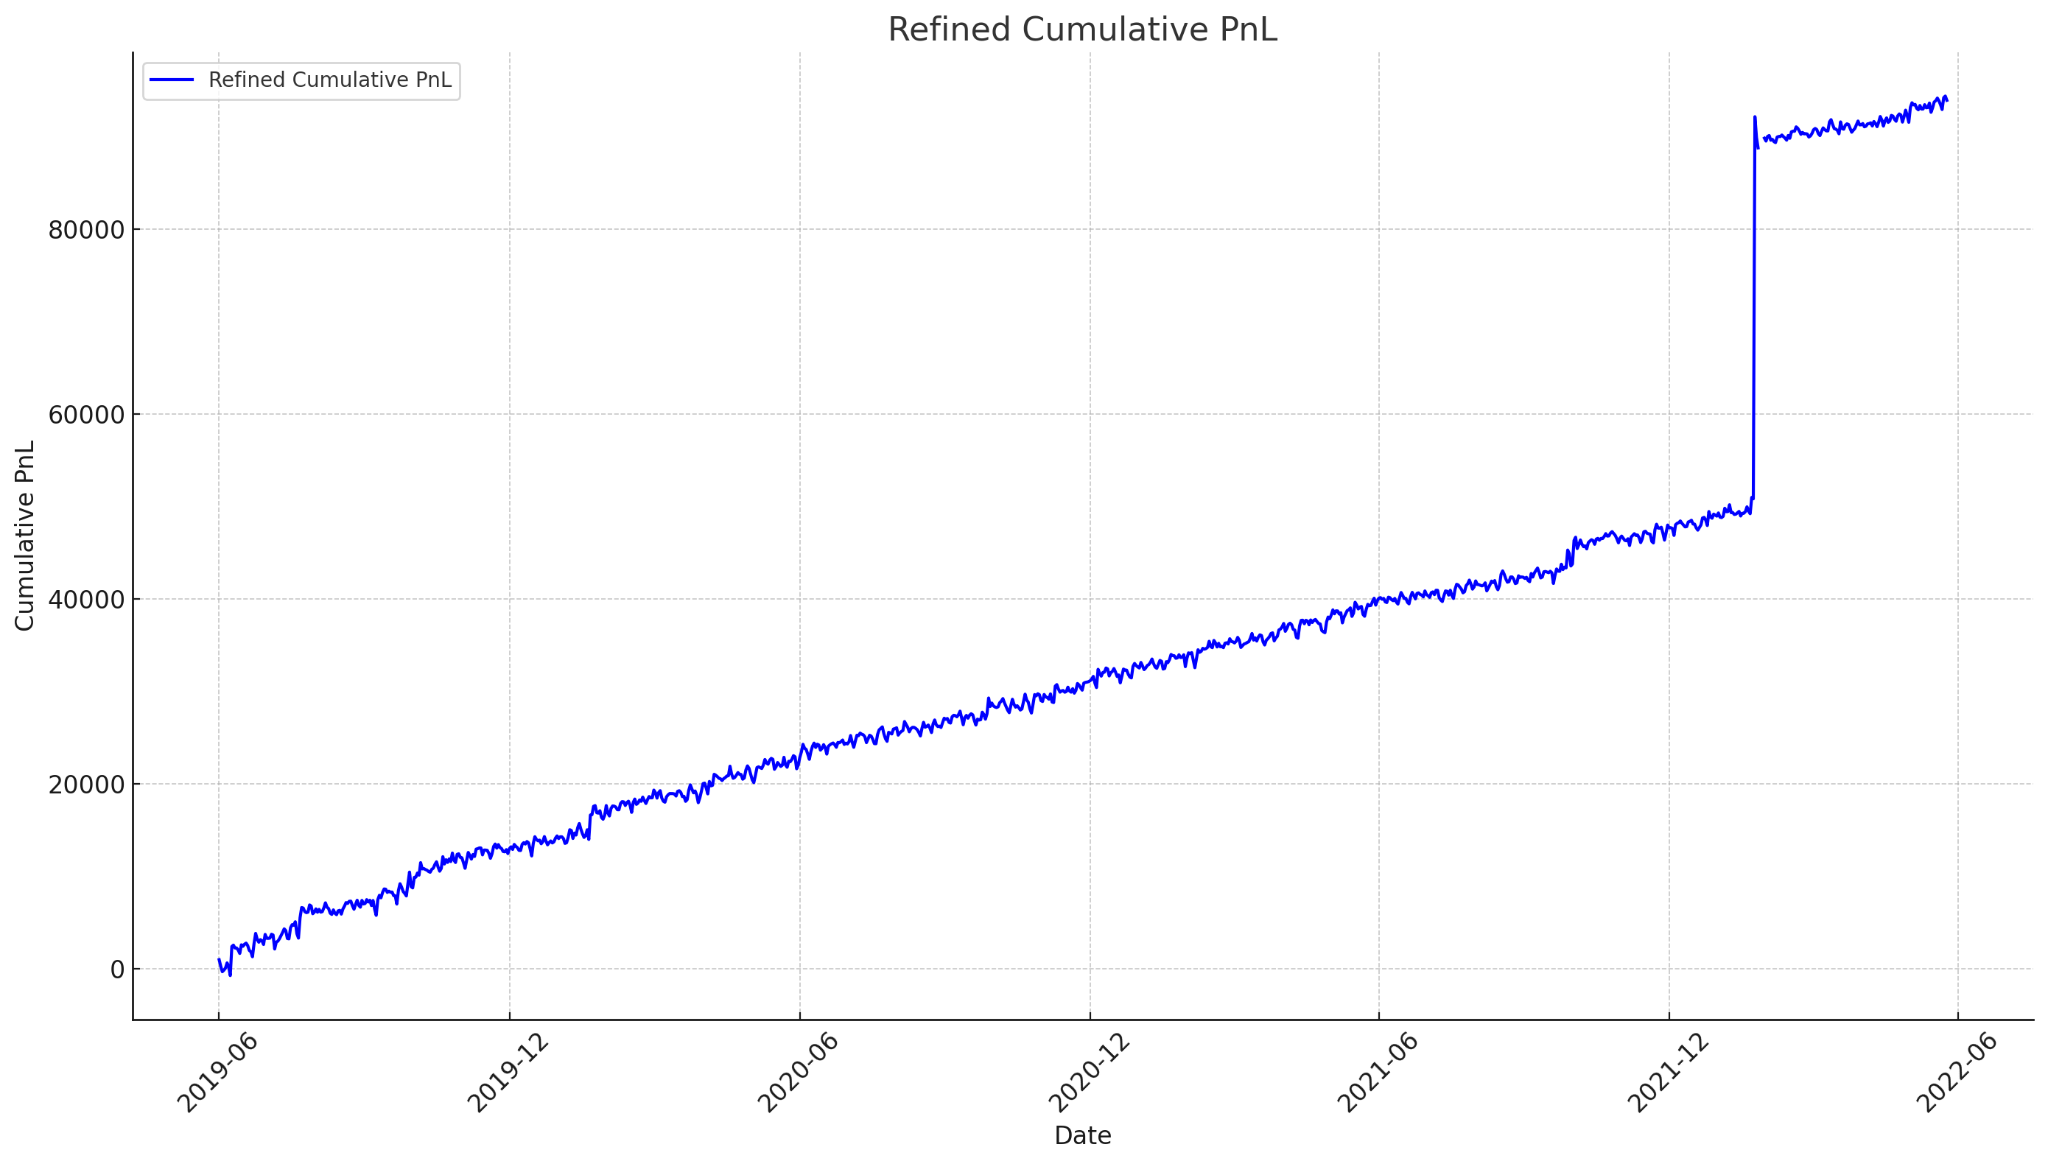
Figure 13 shows the cumulative PnL for the combined investment strategy from June 2021 to June 2022 (Out of Sample).
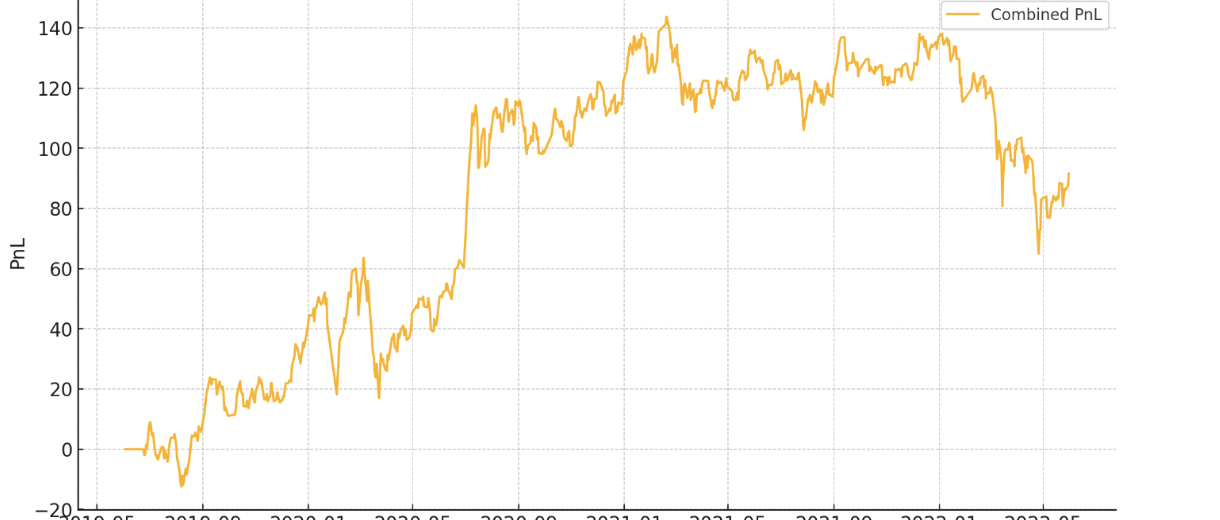
In sample data:
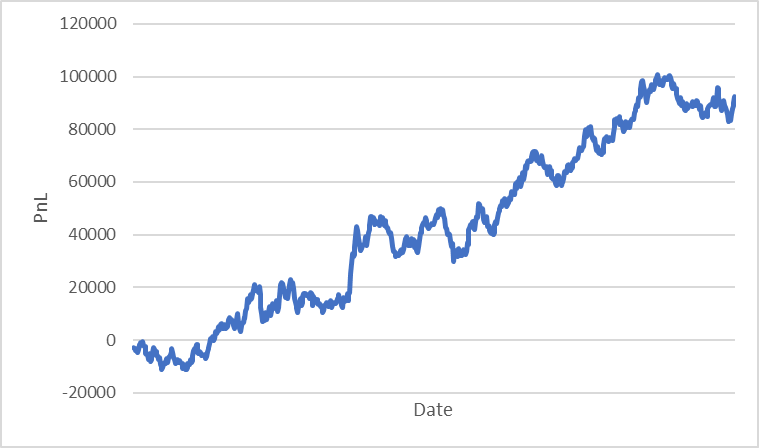
Figure 14 shows the cumulative PnL for the combined investment strategy from June 2019 to June 2021 (In Sample).
Annualized Return: 0.47%
Sharpe Ratio: 1.53
Information Ratio: 2.93
Analyze:
An annual return of 0.47% means that the investment gained 0.47% over a year. The Information Ratio of 2.93 indicates that the alpha is good at turning risk into profit, generating 2.93 units of excess return per unit of risk. A Sharpe Ratio of 1.53 suggests the alpha justifies the risk taken, doing better than a safe investment. Overall, the statistics suggest the investment strategy is working effectively, showing solid performance and good risk management.
Total transaction cost: 3,175,757.04.
5.2.3. Trading recommendation
Based on the refined new alpha, PnL and stats. We recommend using this strategy and should trade stocks as portfolios of stocks have generally increased in value over the observed period. There are notable drawdowns where the cumulative returns dropped sharply before recovering. This volatility should be taken into account when making trading decisions, as it indicates potential risk. A high Sharpe Ratio typically suggests a favorable risk-adjusted return, making the portfolio an attractive investment opportunity. In this case, the sharpe ratio is high. A positive and higher IR would suggest effective portfolio management. Overall, the stocks are worth trading.
References
[1]. Ballinari, D., Audrino, F., & Sigrist, F. (2022). When does attention matter? the effect of investor attention on stock market volatility around news releases. International Review of Financial Analysis, 82, 102185.
[2]. Chiou, W.-J. P., Knewtson, H. S., & Nofsinger, J. R. (2019b). Paying attention to social media stocks. International Review of Economics & Finance, 59, 106–119.
[3]. Guan, C., Liu, W., & Cheng, J. Y.-C. (2021, September 15). Using social media to predict the stock market crash and rebound amid the pandemic: The Digital “haves” and “have-mores” - annals of data science. SpringerLink. https: //link.springer.com/article/10.1007/s40745-021-00353-w
[4]. Cristescu, M. P., Mara, D. A., Nerișanu, R. A., Culda, L. C., & Maniu, I. (2023, November 30). Analyzing the impact of financial news sentiments on stock prices-A wavelet correlation. MDPI. https: //www.mdpi.com/2227-7390/11/23/4830
[5]. Fekrazad, A., Harun, S. M., & Sardar, N. (2022, April 9). Social media sentiment and the stock market - Journal of Economics and Finance. SpringerLink. https: //link.springer.com/article/10.1007/s12197-022-09575-x
[6]. Smith, S., & O& rsquo; Hare, A. (2022, April 28). Comparing traditional news and social media with stock price movements; which comes first, the news or the price change? - journal of big data. SpringerOpen. https: //journalofbigdata.springeropen.com/articles/10.1186/s40537-022-00591-6
[7]. Affuso, E., & Lahtinen, K. D. (2018b, May 26). Social media sentiment and market behavior - empirical economics. SpringerLink. https: //link.springer.com/article/10.1007/s00181-018-1430-y
[8]. Ranco, G., Aleksovski, D., Caldarelli, G., Grčar, M., & Mozetič, I. (n.d.-b). The effects of twitter sentiment on stock price returns. PLOS ONE. https: //journals.plos.org/plosone/article?id=10.1371%2Fjournal.pone.0138441
[9]. Fekrazad, A., Harun, S. M., & Sardar, N. (2022a, April 9). Social media sentiment and the stock market - Journal of Economics and Finance. SpringerLink. https: //link.springer.com/article/10.1007/s12197-022-09575-x
[10]. Affuso, E., & Lahtinen, K. D. (2018a, May 26). Social media sentiment and market behavior - empirical economics. SpringerLink. https: //link.springer.com/article/10.1007/s00181-018-1430-y
Cite this article
Yao,Y.;Li,Y.;Liu,Y.;Liu,Y. (2025). Social Media Sentiment and Stock Market Trends: A Sentiment-Driven Market Interpretation. Advances in Economics, Management and Political Sciences,215,91-106.
Data availability
The datasets used and/or analyzed during the current study will be available from the authors upon reasonable request.
Disclaimer/Publisher's Note
The statements, opinions and data contained in all publications are solely those of the individual author(s) and contributor(s) and not of EWA Publishing and/or the editor(s). EWA Publishing and/or the editor(s) disclaim responsibility for any injury to people or property resulting from any ideas, methods, instructions or products referred to in the content.
About volume
Volume title: Proceedings of the 4th International Conference on Financial Technology and Business Analysis
© 2024 by the author(s). Licensee EWA Publishing, Oxford, UK. This article is an open access article distributed under the terms and
conditions of the Creative Commons Attribution (CC BY) license. Authors who
publish this series agree to the following terms:
1. Authors retain copyright and grant the series right of first publication with the work simultaneously licensed under a Creative Commons
Attribution License that allows others to share the work with an acknowledgment of the work's authorship and initial publication in this
series.
2. Authors are able to enter into separate, additional contractual arrangements for the non-exclusive distribution of the series's published
version of the work (e.g., post it to an institutional repository or publish it in a book), with an acknowledgment of its initial
publication in this series.
3. Authors are permitted and encouraged to post their work online (e.g., in institutional repositories or on their website) prior to and
during the submission process, as it can lead to productive exchanges, as well as earlier and greater citation of published work (See
Open access policy for details).
References
[1]. Ballinari, D., Audrino, F., & Sigrist, F. (2022). When does attention matter? the effect of investor attention on stock market volatility around news releases. International Review of Financial Analysis, 82, 102185.
[2]. Chiou, W.-J. P., Knewtson, H. S., & Nofsinger, J. R. (2019b). Paying attention to social media stocks. International Review of Economics & Finance, 59, 106–119.
[3]. Guan, C., Liu, W., & Cheng, J. Y.-C. (2021, September 15). Using social media to predict the stock market crash and rebound amid the pandemic: The Digital “haves” and “have-mores” - annals of data science. SpringerLink. https: //link.springer.com/article/10.1007/s40745-021-00353-w
[4]. Cristescu, M. P., Mara, D. A., Nerișanu, R. A., Culda, L. C., & Maniu, I. (2023, November 30). Analyzing the impact of financial news sentiments on stock prices-A wavelet correlation. MDPI. https: //www.mdpi.com/2227-7390/11/23/4830
[5]. Fekrazad, A., Harun, S. M., & Sardar, N. (2022, April 9). Social media sentiment and the stock market - Journal of Economics and Finance. SpringerLink. https: //link.springer.com/article/10.1007/s12197-022-09575-x
[6]. Smith, S., & O& rsquo; Hare, A. (2022, April 28). Comparing traditional news and social media with stock price movements; which comes first, the news or the price change? - journal of big data. SpringerOpen. https: //journalofbigdata.springeropen.com/articles/10.1186/s40537-022-00591-6
[7]. Affuso, E., & Lahtinen, K. D. (2018b, May 26). Social media sentiment and market behavior - empirical economics. SpringerLink. https: //link.springer.com/article/10.1007/s00181-018-1430-y
[8]. Ranco, G., Aleksovski, D., Caldarelli, G., Grčar, M., & Mozetič, I. (n.d.-b). The effects of twitter sentiment on stock price returns. PLOS ONE. https: //journals.plos.org/plosone/article?id=10.1371%2Fjournal.pone.0138441
[9]. Fekrazad, A., Harun, S. M., & Sardar, N. (2022a, April 9). Social media sentiment and the stock market - Journal of Economics and Finance. SpringerLink. https: //link.springer.com/article/10.1007/s12197-022-09575-x
[10]. Affuso, E., & Lahtinen, K. D. (2018a, May 26). Social media sentiment and market behavior - empirical economics. SpringerLink. https: //link.springer.com/article/10.1007/s00181-018-1430-y