


1. Introduction
In recent years, carbon neutrality and sustainable development have emerged as key global objectives. Countries and corporations are increasingly prioritizing social values over profits to enhance energy conservation, environmental protection, and governance. Consequently, the Environmental, Social, and Governance (ESG) framework has gained significance in China as a tool to regulate listed companies and inform investors. Investors are acknowledging ESG criteria for ethical reasons and their potential impact on financial performance, particularly regarding stock price crash risk. This risk, influenced by various factors including macro-environment, financial, and corporate governance [1], is crucial for maintaining investor confidence and market stability. Given China's dynamic market, this study seeks to explore the relationship between ESG performance and stock price crash risks across the whole market and different industries, analyzing ESG scores of listed companies while considering relevant market factors, and hopes to contribute to ESG trends and industry research. The article is structured as follows: Section 2 reviews the literature; Section 3 describes the data and empirical design; Section 4 discusses the results; and Section 5 presents the conclusions.
2. Literature review
Based on existing literature, the factors influencing the risk of future stock price collapse can be categorized in several ways [1]. Zhen Peng empirically demonstrated that leveraged trading has a threshold effect on crash risk, highlighting the impact of financial reporting and corporate disclosures [2]. Jeong-Bon Kim found a positive correlation between corporate tax avoidance and specific stock price crashes in a study of U.S. firms [3]. Quang Khai Nguyen emphasized that financial flexibility plays a critical role in mitigating stock price crash risk, particularly during the COVID-19 crisis [4]. Shi XF identified a significant positive relationship between inadequate information disclosure and crash risk [5]. Additionally, Justin Jin, Xiaowei Kong, and Jiangjiao Duan noted a strong positive connection between COVID-19 and crash risk, linking this to disclosures related to health risks and the public's sentiment about the pandemic [6-8]. Interestingly, Ashrafee T Hossain observed that the importance of the technology sector increased during the COVID-19 outbreak, resulting in a decline in its stock price crash risk compared to other industries [9]. From a perspective of green development and corporate responsibility, Nengrui Xu found a negative correlation between the disclosure of environmental, social, and governance (ESG) information by A-share listed companies and future stock price collapse risk [10]. Ariadna Dumitrescu examined the varied impacts of Corporate Social Responsibility (CSR) initiatives targeting different stakeholders on crash risk, suggesting such initiatives could either have no effect or exacerbate risks [11]. Finally, Zhibin Zhang and Mengyao Wen showed that advancements in green finance and environmental oversight significantly reduce the risk of stock price collapses, while Wei Zhang highlighted that green credit policies could heighten collapse risks for heavily polluting firms [12-14].
3. Methodology
3.1. Data source and sample
The data in this paper comes from the CRSP and Hexun websites. The sample period is from 2009 to 2022, and the stock range covers A-share mainboard stocks. Meanwhile, to get a better calculation we also choose four different industries and go ahead with further analysis. The data used from each database includes:
(1) CRSP: daily stock returns, monthly volatility, monthly trading volume, daily stock returns, monthly volatility, and monthly trading volume.
(2) Hexun website: The quality of company ESG information disclosure was measured by Hexun website which publish the ESG scores.
Referring to the relevant literature by Amy P. Hutton, Jeffery L. Callen, Xu Nianxing, and Chang Xin, this paper utilizes R and STATA software for data processing [15-18]. The specific steps are as follows: (1) Select all A-share main board stock data, excluding ST companies. (2) Remove related missing data. (3) Perform 1st and 99th percentile winsorization on all variables. Finally, 15,694 data are obtained.
3.2. Variable measure
3.2.1. Dependent variables
Using the literature for reference [15,19], the work construct measures of indicators to examine the stock price crash risk. Specific methods are as follows:
rj,t represents the daily return of stock j in year w, while rm,trepresents the market value-weighted index return. The rj,t-1 and rj,t+1 represent the lagged and leading terms of individual stock returns.
(1) The negative coefficient of skewness (NCSKEW), this index reflects the negative skew of stock returns. As the value increases, so does the risk of stock price crash. The specific calculation formula is as follows:
(2) The down-to-up volatility (DUVOL), this measures the difference in volatility during periods of stock decline relative to periods of stock increase, with a higher value indicating greater risk.Rdand Ru represent stock returns’ standard deviation during declining and rising periods, respectively, while ndand nu represent the number of trading days during declining and rising periods, respectively.
(3) The Crash Risk Measure (CRASH), this measures whether a stock has experienced extreme negative returns over a period. If a company's weekly return falls below the mean by 3.09 standard deviations, the indicator is set to 1; otherwise, it is set to 0.
3.2.2. Independent variables
This paper uses the ESG scores published by Hexun as a measure of the quality of corporate ESG information disclosure with approach of Li Jinglin [20]. In 2010, the International Organization for Standardization (ISO) released a voluntary standard, ISO 26000 Social Responsibility Guide, which marked a milestone in the development from CSR to ESG. Since then, Hexun has begun publishing ESG scores for A-share listed companies in China. The social responsibility scores released by Hexun include not only the overall ESG score but also scores in environmental, social, and corporate governance dimensions.
3.2.3. Control variables
According to the relevant research by Yongtae Kim, Chang Xin, Xu Nianxing, and Cao Tingqiu and Zhang Guangli [17,18,21,22], this paper controls for the following relevant variables, which can be divided into (1) Market Indicators: Ret, the yearly return of stock i, indicates that higher past daily returns can lead to easier bubble accumulation, which can facilitate the occurrence of a crash; Sigma, the standard deviation of the yearly returns of stock i, suggests that higher volatility may increase the risk of a crash. (2) Company Financial Indicators: Roa, return on total assets; Roe, return on total equity; Lev, company's asset-liability ratio; Mb, market-to-book ratio, calculated as current shareholders' equity divided by the company's market value for the period; Size, the natural logarithm of the company's total assets, with larger market values indicating higher future extreme risk [19]; Age, the time from the company's establishment to 2022.
3.3. Model specification - regression model
This paper uses Model 5 to verify the relationship between Y and X:
Where CrashRisk is the stock price crash risk indicator, measured by NCSKEW, DUVOL, and CRASH in year t. ESG represents the ESG information disclosure’s quality. Control represents relevant control variables, all of which are related data for year t-1. ε is the residual. If the hypothesis that stock risk is negatively correlated with ESG information disclosure quality holds, the coefficient β1 should be significantly negative.
4. Empirical results
4.1. Univariate descriptive analysis
Following the data selection and processing methods outlined above, Table 1 presents the descriptive statistics for the entire market, comprising 15,694 observations. Overall, the descriptive statistics align with those from prior studies. The mean of the dependent variable, the negative skewness coefficient (NCSKEW), is -0.338, with a median of -0.300 and a standard deviation of 0.756. Meanwhile, the mean up-and-down volatility (DUVOL) is -0.236, with a median of -0.235 and a standard deviation of 0.490. These values are consistent with NCSKEW and DUVOL findings from other studies at the index level, though the standard deviation here is slightly smaller. The mean ESG score is 4.164, and the control variables, such as ROA, expressed as percentages, are within a reasonable range and show no significant deviations from existing literature.
|
Var Name |
Obs |
Mean |
SD |
Min |
Median |
Max |
|
NCSKEW |
15694 |
-0.338 |
0.756 |
-5.250 |
-0.300 |
4.153 |
|
DUVOL |
15694 |
-0.236 |
0.490 |
-2.777 |
-0.235 |
2.808 |
|
CRASH |
15694 |
0.102 |
0.302 |
0 |
0 |
1 |
|
ESG |
15694 |
4.164 |
0.989 |
1.000 |
4.000 |
7.750 |
|
Roa |
15694 |
0.034 |
0.067 |
-1.648 |
0.030 |
0.974 |
|
Roe |
15694 |
0.045 |
0.523 |
-41.502 |
0.069 |
3.966 |
|
Lev |
15694 |
0.443 |
0.261 |
0.000 |
0.466 |
1.146 |
|
Mb |
15694 |
0.660 |
0.272 |
0.023 |
0.658 |
1.601 |
|
Sigma |
15694 |
0.065 |
0.025 |
0.019 |
0.060 |
0.232 |
|
Age |
15694 |
15.149 |
6.359 |
-10.000 |
15.000 |
32.000 |
|
Size |
15694 |
22.762 |
1.648 |
17.663 |
22.538 |
31.310 |
|
Ret |
15694 |
0.004 |
0.011 |
-0.025 |
0.002 |
0.054 |
4.2. Industry descriptive analysis
Based on the aforementioned examination, this work further analyzes and extracts the impact between crash risk and ESG ratings from different industries. Referring to the 2012 industry codes of the China Securities Regulatory Commission, this study selected four industries for regression analysis: Code A (Agriculture, Forestry, Animal Husbandry, and Fishery), Code C (Manufacturing), Code J (Finance and Insurance), and Code K (Real Estate).
4.2.1. Agricultural, forestry, animal husbandry and fishery
The study begins by considering the ESG importance in the Broad agricultural industry, with results in Table 2 based on 343 observations. The mean ESG score is 3.669, and the control variables are consistent with those for the overall market.
|
Var Name |
Obs |
Mean |
SD |
Min |
Median |
Max |
|
NCSKEW |
343 |
-0.266 |
0.650 |
-2.279 |
-0.291 |
2.281 |
|
DUVOL |
343 |
-0.175 |
0.448 |
-1.482 |
-0.173 |
1.277 |
|
CRASH |
343 |
0.120 |
0.325 |
0.000 |
0.000 |
1.000 |
|
ESG |
343 |
3.669 |
0.966 |
1.000 |
3.750 |
6.250 |
|
Roa |
343 |
0.016 |
0.093 |
-0.583 |
0.019 |
0.526 |
|
Roe |
343 |
-0.028 |
0.467 |
-6.418 |
0.036 |
0.604 |
|
Lev |
343 |
0.542 |
0.255 |
0.000 |
0.600 |
0.913 |
|
Mb |
343 |
0.494 |
0.196 |
0.056 |
0.479 |
1.116 |
|
Sigma |
343 |
0.064 |
0.021 |
0.027 |
0.061 |
0.136 |
|
Size |
343 |
21.684 |
0.865 |
19.478 |
21.646 |
23.664 |
|
Age |
343 |
12.606 |
5.989 |
0.000 |
13.000 |
26.000 |
|
Ret |
343 |
0.003 |
0.009 |
-0.023 |
0.002 |
0.035 |
4.2.2. Finance and insurance
For the Finance and Insurance sector, Table 3 shows data from 464 observations. The mean NCSKEW is -0.394, with a median of -0.380 and a standard deviation of 0.596. The mean DUVOL is -0.285, and the ESG score averages 5.113, with a standard deviation of 1.340. Some errors may have influenced the ESG results, possibly affecting the outcomes; however, control variables remain aligned with previous studies.
|
Var Name |
Obs |
Mean |
SD |
Min |
Median |
Max |
|
NCSKEW |
468 |
-0.394 |
0.596 |
-2.294 |
-0.380 |
1.655 |
|
DUVOL |
468 |
-0.285 |
0.417 |
-1.392 |
-0.275 |
0.943 |
|
CRASH |
468 |
0.085 |
0.280 |
0.000 |
0.000 |
1.000 |
|
ESG |
468 |
5.113 |
1.340 |
-0.009 |
5.500 |
7.000 |
|
Roa |
468 |
0.018 |
0.034 |
-0.338 |
0.012 |
0.346 |
|
Roe |
468 |
0.100 |
0.228 |
-4.210 |
0.111 |
0.567 |
|
Lev |
468 |
0.025 |
0.046 |
0.000 |
0.006 |
0.386 |
|
Mb |
468 |
0.900 |
0.175 |
0.064 |
0.972 |
1.071 |
|
Sigma |
468 |
0.046 |
0.018 |
0.019 |
0.044 |
0.100 |
|
Size |
468 |
27.250 |
2.425 |
20.199 |
27.688 |
31.310 |
|
Age |
468 |
12.286 |
6.793 |
0.000 |
12.000 |
31.000 |
|
Ret |
468 |
0.002 |
0.008 |
-0.017 |
0.000 |
0.029 |
4.2.3. Real estate
In the Real Estate sector, analyzed in Table 4, the study obtained 968 observations, yielding a mean NCSKEW of -0.396, a median of -0.339, and a standard deviation of 0.741. The mean DUVOL is -0.259 (median: -0.251, standard deviation: 0.470), and the mean ESG score is 4.867, with control variables consistent with other literature.
|
Var Name |
Obs |
Mean |
SD |
Min |
Median |
Max |
|
NCSKEW |
968 |
-0.396 |
0.741 |
-2.769 |
-0.339 |
2.131 |
|
DUVOL |
968 |
-0.259 |
0.470 |
-1.547 |
-0.251 |
1.277 |
|
CRASH |
968 |
0.100 |
0.300 |
0.000 |
0.000 |
1.000 |
|
ESG |
968 |
4.867 |
0.795 |
1.000 |
5.000 |
7.000 |
|
Roa |
968 |
0.026 |
0.035 |
-0.172 |
0.024 |
0.200 |
|
Roe |
968 |
0.067 |
0.168 |
-1.663 |
0.080 |
0.489 |
|
Lev |
968 |
0.455 |
0.196 |
0.000 |
0.477 |
0.915 |
|
Mb |
968 |
0.874 |
0.201 |
0.233 |
0.903 |
1.643 |
|
Sigma |
965 |
0.061 |
0.024 |
0.020 |
0.055 |
0.203 |
|
Size |
968 |
23.564 |
1.334 |
20.272 |
23.378 |
28.293 |
|
Age |
968 |
17.571 |
6.593 |
-9.000 |
18.000 |
31.000 |
|
Ret |
968 |
0.003 |
0.010 |
-0.023 |
0.001 |
0.042 |
4.2.4. Manufacturing
Finally, the Manufacturing sector is detailed in Table 5, based on 11,602 observations. Here, the mean NCSKEW is -0.323, with a median of -0.396 and a standard deviation of 0.706. The mean DUVOL stands at -0.222, but the results are subject to considerable error.
|
Var Name |
Obs |
Mean |
SD |
Min |
Median |
Max |
|
NCSKEW |
11602 |
-0.323 |
0.706 |
-2.769 |
-0.285 |
2.281 |
|
DUVOL |
11602 |
-0.222 |
0.476 |
-1.547 |
-0.220 |
1.413 |
|
CRASH |
11602 |
0.106 |
0.308 |
0.000 |
0.000 |
1.000 |
|
ESG |
11602 |
4.022 |
0.963 |
1.000 |
4.000 |
7.250 |
|
Roa |
11602 |
0.036 |
0.073 |
-0.965 |
0.034 |
0.786 |
|
Roe |
11602 |
0.017 |
1.175 |
-72.146 |
0.063 |
4.248 |
|
Lev |
11602 |
0.431 |
0.247 |
0.000 |
0.455 |
1.146 |
|
Mb |
11602 |
0.609 |
0.249 |
0.045 |
0.601 |
1.468 |
|
Sigma |
11602 |
0.062 |
0.022 |
0.019 |
0.057 |
0.226 |
|
Size |
11602 |
22.336 |
1.248 |
18.266 |
22.205 |
27.621 |
|
Age |
11602 |
13.096 |
6.720 |
0.000 |
13.000 |
32.000 |
|
Ret |
11602 |
0.004 |
0.010 |
-0.025 |
0.002 |
0.068 |
In summary, the number of observations for part of the industries is quite small. It might lead the result subjects to considerable error. From the above data, the quality of disclosure information of ESG might be relatively irregular, which may be due to the underdeveloped ESG system in the Chinese domestic market. This particularly affects data acquisition and accuracy. There are also noticeable differences across industries. In agriculture and finance, the ESG errors are smaller, possibly due to the development of international financial markets and the influence of international organizations' "carbon tariffs."
4.3. Univariate correlation analysis
In Table 6, the correlation analysis reveals that the crash risk indicators: NCSKEW and DUVOL, their correlation coefficient is 0.815, indicating a strong positive relationship and high consistency. The correlations for the control variables align with findings from related studies. The stock price crash risk indicators demonstrate negative correlations with ESG information disclosure, with values of -0.016, -0.008, and -0.023, providing preliminary support for this paper's hypothesis.
|
NCSKEW |
DUVOL |
CRASH |
ESG |
Roa |
Roe |
Lev |
Mb |
Sigma |
Size |
Ret |
Age |
|
|
NCSKEW |
1 |
|||||||||||
|
DUVOL |
0.815*** |
1 |
||||||||||
|
CRASH |
0.451*** |
0.440*** |
1 |
|||||||||
|
ESG |
-0.016 |
-0.008 |
-0.023 |
1 |
||||||||
|
Roa |
0.042 |
0.040 |
0.076*** |
0.038 |
1 |
|||||||
|
Roe |
0.005 |
-0.008 |
0.039 |
0.012 |
0.722*** |
1 |
||||||
|
Lev |
0.021 |
0.035 |
-0.017 |
-0.079*** |
-0.019 |
-0.028 |
1 |
|||||
|
Mb |
-0.026 |
0.009 |
-0.024 |
0.190*** |
-0.028 |
-0.016 |
0.226*** |
1 |
||||
|
Sigma |
-0.185*** |
-0.190*** |
-0.057** |
0.039 |
-0.008 |
0.006 |
0.002 |
-0.028 |
1 |
|||
|
Size |
-0.022 |
0.001 |
-0.008 |
0.226*** |
0.009 |
-0.028 |
0.236*** |
0.653*** |
0.001 |
1 |
||
|
Ret |
-0.197*** |
-0.232*** |
-0.157*** |
0.013 |
-0.012 |
-0.002 |
-0.016 |
0.007 |
0.567*** |
0.006 |
1 |
|
|
Age |
-0.046* |
-0.062** |
-0.014 |
-0.130*** |
-0.050* |
-0.031 |
0.121*** |
0.209*** |
-0.004 |
0.453*** |
-0.012 |
1 |
4.4. Industry correlation analysis
Similarly, based on the aforementioned examination, this paper further analyzes and extract the impact of ESG ratings from different industries on crash risk.
4.4.1. Agricultural, forestry, animal husbandry and fisher
Table 7 again shows a strong positive correlation of 0.861 between NCSKEW and DUVOL, with correlation magnitudes and signs consistent with previous research, indicating no severe multicollinearity. Significant negative correlations between the ESG score and the crash risk indicators (NCSKEW and DUVOL) are observed at the 1% level (-0.087 and -0.077). However, a positive correlation between ESG and CRASH does not support the research hypothesis.
|
NCSKEW |
DUVOL |
CRASH |
ESG |
Roa |
Roe |
Lev |
Mb |
Sigma |
Size |
Age |
Ret |
|
|
NCSKEW |
1 |
|||||||||||
|
DUVOL |
0.861*** |
1 |
||||||||||
|
CRASH |
0.527*** |
0.413*** |
1 |
|||||||||
|
ESG |
-0.087 |
-0.077 |
0.003 |
1 |
||||||||
|
Roa |
-0.107** |
-0.105* |
-0.074 |
0.163*** |
1 |
|||||||
|
Roe |
-0.114** |
-0.112** |
-0.184*** |
0.191*** |
0.572*** |
1 |
||||||
|
Lev |
0.114** |
0.100* |
-0.001 |
-0.010 |
-0.226*** |
-0.121** |
1 |
|||||
|
Mb |
0.046 |
0.065 |
0.054 |
-0.035 |
-0.258*** |
-0.146*** |
0.326*** |
1 |
||||
|
Sigma |
-0.103* |
-0.149*** |
-0.000 |
-0.008 |
-0.100* |
-0.010 |
-0.050 |
-0.171*** |
1 |
|||
|
Size |
0.009 |
-0.055 |
0.035 |
0.026 |
-0.000 |
-0.027 |
0.132** |
0.376*** |
-0.139*** |
1 |
||
|
Age |
0.002 |
0.032 |
0.027 |
-0.116** |
-0.113** |
-0.029 |
-0.183*** |
0.013 |
-0.000 |
0.153*** |
1 |
|
|
Ret |
-0.267*** |
-0.289*** |
-0.150*** |
0.020 |
0.108** |
0.108** |
-0.035 |
-0.323*** |
0.576*** |
-0.089 |
-0.067 |
1 |
4.4.2. Finance and insurance
In Table 8, the correlation coefficient is 0.828, again indicating consistency between crash risk indicators. Most variables show significant correlations with stock price crash risk, consistent with earlier research. Notably, ESG rating disclosures show positive correlations with crash risk indicators of 0.049, 0.025, and 0.047, which contradicts the hypothesis.
|
NCSKEW |
DUVOL |
CRASH |
ESG |
Roa |
Roe |
Lev |
Mb |
Sigma |
Size |
Age |
Ret |
|
|
NCSKEW |
1 |
|||||||||||
|
DUVOL |
0.828*** |
1 |
||||||||||
|
CRASH |
0.484*** |
0.374*** |
1 |
|||||||||
|
ESG |
0.049 |
0.025 |
0.047 |
1 |
||||||||
|
Roa |
0.000 |
0.012 |
-0.040 |
-0.045 |
1 |
|||||||
|
Roe |
-0.007 |
-0.011 |
-0.026 |
0.193*** |
0.624*** |
1 |
||||||
|
Lev |
-0.013 |
0.017 |
0.071 |
-0.158*** |
-0.018 |
-0.320*** |
1 |
|||||
|
Mb |
0.081* |
0.022 |
-0.010 |
0.104** |
-0.410*** |
0.100** |
-0.328*** |
1 |
||||
|
Sigma |
-0.062 |
-0.014 |
-0.007 |
-0.095** |
0.144*** |
-0.144*** |
0.211*** |
-0.470*** |
1 |
|||
|
Size |
0.045 |
-0.019 |
-0.099** |
0.140*** |
-0.297*** |
0.177*** |
-0.319*** |
0.777*** |
-0.520*** |
1 |
||
|
Age |
0.045 |
0.046 |
0.113** |
-0.394*** |
0.067 |
-0.226*** |
0.342*** |
-0.087* |
0.079* |
-0.200*** |
1 |
|
|
Ret |
-0.013 |
-0.003 |
-0.071 |
0.012 |
0.176*** |
0.109** |
0.001 |
-0.153*** |
0.416*** |
-0.049 |
-0.042 |
1 |
4.4.3. Real estate
Table 9 shows a correlation coefficient of 0.871 between NCSKEW and DUVOL, confirming a high level of consistency. The negative correlations between the crash risk indicators and the quality of ESG information disclosure are -0.017 and -0.016, providing initial support for the hypothesis. Conversely, the correlation between ESG and CRASH fails to support hypothesis.
|
NCSKEW |
DUVOL |
CRASH |
ESG |
Roa |
Roe |
Lev |
Mb |
Sigma |
Size |
Ret |
Age |
|
|
NCSKEW |
1 |
|||||||||||
|
DUVOL |
0.871*** |
1 |
||||||||||
|
CRASH |
0.459*** |
0.390*** |
1 |
|||||||||
|
ESG |
-0.017 |
-0.016 |
0.010 |
1 |
||||||||
|
Roa |
0.017 |
0.020 |
-0.020 |
0.226*** |
1 |
|||||||
|
Roe |
0.030 |
0.038 |
-0.011 |
0.241*** |
0.742*** |
1 |
||||||
|
Lev |
-0.017 |
0.011 |
0.042 |
0.120*** |
-0.245*** |
-0.064** |
1 |
|||||
|
Mb |
0.032 |
0.039 |
0.056* |
0.170*** |
-0.207*** |
-0.057* |
0.131*** |
1 |
||||
|
Sigma |
-0.184*** |
-0.183*** |
-0.044 |
-0.068** |
0.005 |
-0.021 |
-0.011 |
-0.129*** |
1 |
|||
|
Size |
0.042 |
0.028 |
0.029 |
0.370*** |
-0.140*** |
0.014 |
0.122*** |
0.536*** |
-0.126*** |
1 |
||
|
Ret |
-0.175*** |
-0.200*** |
-0.109*** |
0.005 |
0.023 |
0.000 |
-0.012 |
-0.036 |
0.593*** |
-0.021 |
1 |
|
|
Age |
-0.024 |
-0.026 |
0.017 |
-0.225*** |
-0.160*** |
-0.162*** |
-0.021 |
0.200*** |
-0.011 |
0.127*** |
-0.010 |
1 |
4.4.4. Manufacturing
Table 10 indicates a correlation coefficient of 0.878 between crash risk indicators, signifying consistency. Most other variables also show significant correlations with stock price crash risk, in line with previous research. A negative relationship between stock price crash risk and the quality of ESG disclosure is partially significant at the 10% level, with correlations of -0.016, -0.010, and -0.004, offering preliminary support for the hypothesis.
|
NCSKEW |
DUVOL |
CRASH |
ESG |
Roa |
Roe |
Lev |
Mb |
Sigma |
Size |
Ret |
Age |
|
|
NCSKEW |
1 |
|||||||||||
|
DUVOL |
0.878*** |
1 |
||||||||||
|
CRASH |
0.485*** |
0.399*** |
1 |
|||||||||
|
ESG |
-0.016* |
-0.010 |
-0.004 |
1 |
||||||||
|
Roa |
0.007 |
0.007 |
0.014 |
0.226*** |
1 |
|||||||
|
Roe |
-0.003 |
-0.004 |
0.010 |
0.049*** |
0.287*** |
1 |
||||||
|
Lev |
-0.003 |
0.001 |
-0.033*** |
-0.051*** |
-0.225*** |
-0.046*** |
1 |
|||||
|
Mb |
-0.020** |
-0.021** |
-0.008 |
0.079*** |
-0.193*** |
0.001 |
0.234*** |
1 |
||||
|
Sigma |
-0.181*** |
-0.175*** |
-0.045*** |
-0.014 |
-0.026*** |
-0.010 |
0.010 |
-0.033*** |
1 |
|||
|
Size |
-0.009 |
-0.010 |
-0.028*** |
0.271*** |
0.089*** |
0.033*** |
0.170*** |
0.509*** |
-0.053*** |
1 |
||
|
Ret |
-0.188*** |
-0.206*** |
-0.140*** |
0.014 |
0.006 |
0.003 |
0.016* |
-0.028*** |
0.544*** |
0.009 |
1 |
|
|
Age |
-0.000 |
0.003 |
0.006 |
-0.039*** |
-0.075*** |
-0.024** |
0.002 |
0.186*** |
-0.038*** |
0.409*** |
0.005 |
1 |
Overall, the results align with the descriptive analysis. While the quality of ESG information disclosure shows significant errors, it does not demonstrate a strong correlation with stock crash risk. Most negative correlations support hypothesis, and the work speculate that this is related to the underdeveloped ESG system in the Chinese domestic market. On the positive side, there is substantial room for growth in this area domestically.
4.5. Univariate regression analysis
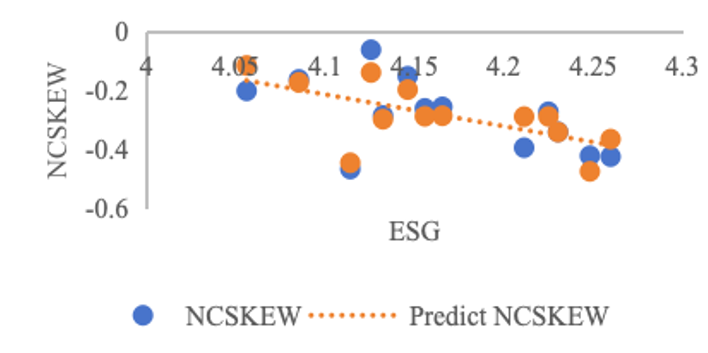
The regression analyses are performed to test the relationship between the ESG scores and the crash risk, where ordinary least squares (OLS) is used when crash risk is proxied by NCSKEW and DUVOL, and logit regression is used when CRASH is the dependent variable. Moreover, all explanatory variables, including the independent variable ESG and other control variables, lagged 1 year with a range from 2009 to 2021; while the three dependent variables ranged from the year 2010 to 2022. Figure 1 and Table 11 below demonstrate the regression results of the ESG rating scores on the stock price collapse metrics for the whole Chinese stock market. The coefficients of ESG score are negative (-4.222, -4.377 and -1.344), which represents that firms with higher ESG ratings are less negatively skewed or less volatile, and so are less likely to suffer future stock price crashes. Overall, the results confirm a negative association between the ESG scores and stock price crash risk. However, none of the test statistics show this relationship to be significant, suggesting that ESG is not a sense measure of potential stock market crashes in the whole stock market.
|
*,** and *** indicate statistical significance at the 10%, 5% and 1% levels. |
|||
|
Variable |
NCSKEWt 1 |
DUVOLt 2 |
CRASHt 3 |
|
ESGt-1 |
-4.222 (-0.713) |
-4.377 (-1.113) |
-1.344 (-0.755) |
|
ROAt-1 |
-5.503 (-0.260) |
-9.188 (-0.653) |
1.831 (0.288) |
|
ROEt-1 |
5.158 (0.716) |
6.150 (1.287) |
0.771 (0.357) |
|
LEVt-1 |
-5.886 (-0.897) |
-3.850 (-0.884) |
-3.072 (-1.558) |
|
MBt-1 |
4.648 (0.591) |
5.363 (1.027) |
1.853 (0.784) |
|
SIGMAt-1 |
-1.905 (-0.321) |
0.925 (0.235) |
0.346 (0.194) |
|
AGEt-1 |
-0.313 (-0.321) |
-0.308 (-1.050) |
-0.130 (-0.982) |
|
SIZEt-1 |
2.456 (-0.709) |
2.362 (1.013) |
1.031 (0.977) |
|
RETt-1 |
32.138 (0.699) |
30.046 (0.366) |
11.664 (0.912) |
|
R2 |
0.800 |
0.790 |
0.700 |
The results for control variables are mostly consistent with the previous literature. Particularly, stock price crash risk is positively associated with the market-to-book ratio (MB), firm size, stock return volatility (SIGMA), and past stock return (RET); while it is negatively related to firm age, Leverage (LEV) and return on assets (ROA).
4.6. Industry regression analysis
Based on the above test, further analyses are conducted to extract the impact of ESG rating on Crash risk from different industries.
4.6.1. Agricultural, forestry, animal husbandry and fishery
The study begins by considering the ESG importance in the Broad agricultural industry. From Table 12, the quality of ESG information disclosure is negatively related to future crash risk, and this relationship is highly significant in the logit regression (t statistics= -3.344) where CRASH is used as the indicator for crash risk. However, Columns 1 and 2 of Table 12 report insignificant results under OLS regressions. Interestingly, some control variables, such as ROA, SIGMA, and MB, show results contrary to prior literature, likely due to the sector's unique business models and risk characteristics, where ESG factors have a diminished impact on stock price collapse due to influences like natural factors, seasonal changes, and regulations.
|
Variable |
NCSKEWt 1 |
DUVOLt 2 |
CRASHt 3 |
|
ESGt-1 |
-2.239 (-1.302) |
-1.530 (-1.221) |
-1.276** (-3.344) |
|
ROAt-1 |
0.398 (0.040) |
6.348 (0.864) |
1.388 (0.621) |
|
ROEt-1 |
0.944 (0.615) |
1.332 (1.190) |
0.481 (1.411) |
|
LEVt-1 |
-3.529 (-0.595) |
-3.991 (0.924) |
-0.672 (-0.511) |
|
MBt-1 |
-1.387 (-0.741) |
-0.735 (-0.539) |
-0.214 (-0.511) |
|
SIGMAt-1 |
-21.936 (-1.860) |
-12.590 (-1.464) |
-7.649* (-2.923) |
|
AGEt-1 |
-0.180 (-0.757) |
-0.183 (-1.055) |
-0.134* (-2.540) |
|
SIZEt-1 |
2.595 (0.763) |
2.924 (1.180) |
1.975* (2.617) |
|
RETt-1 |
44.957 (0.843) |
38.531 (0.991) |
21.803 (1.843) |
|
R2 |
0.760 |
0.681 |
0.930 |
4.6.2. Finance and insurance
Similarly, Table 13 gives the results of the impact of ESG on crash risk in the Finance and Insurance sector. Although ESG has a statistical significance close to the 5% level for the dependent variable CRASH, the first two columns of data are representative of the overall insignificant situation. For the current financial and insurance industry, investors may prefer to judge the profitability of organizations through interest rate policies, corporate risk management capabilities, and market regulation, while green growth factors may still need to be considered in the long run.
|
Variable |
NCSKEWt 1 |
DUVOLt 2 |
CRASHt 3 |
|
ESGt-1 |
0.004 (0.005) |
-0.274 (-0.507) |
-0.346* (-2.822) |
|
ROAt-1 |
103.476 (0.836) |
23.819 (0.236) |
96.368** (4.233) |
|
ROEt-1 |
-34.401 (-0.855) |
-11.750 (-0.358) |
-26.720** (-3.613) |
|
LEVt-1 |
13.435 (1.081) |
11.485 (1.131) |
1.055 (0.462) |
|
MBt-1 |
0.111 (0.022) |
-0.540 (-0.130) |
1.782 (1.902) |
|
SIGMAt-1 |
4.849 (0.314) |
1.087 (0.086) |
4.790 (1.689) |
|
AGEt-1 |
-0.343 (-1.046) |
-0.188 (-0.704) |
-0.162* (-2.683) |
|
SIZEt-1 |
0.803 (0.488) |
0.107 (0.080) |
0.942* (3.112) |
|
RETt-1 |
0.334 (0.020) |
3.622 (0.265) |
7.819* (2.542) |
|
R2 |
0.659 |
0.576 |
0.932 |
4.6.3. Real estate
For the real estate industry, the regression analyses are surprising. In agreement with the results of the negative insignificant relationship between ESG and crash risk derived from previous experiments, the results for most of the control variables are contrary to the previous literature. This may be due to the government policy interventions, and the high cyclicity of the Real Estate industry which leads to results opposite to those of other industries. As a result, the ESG ratings failed to have a significant impact(see Table 14).
|
Variable |
NCSKEWt 1 |
DUVOLt 2 |
CRASHt 3 |
|
ESGt-1 |
-0.190 (-0.214) |
-0.433 (-0.847) |
-0.178 (-1.547) |
|
ROAt-1 |
40.381 (1.278) |
26.655 (1.467) |
12.632* (3.097) |
|
ROEt-1 |
-6.981 (-0.721) |
-2.998 (-0.538) |
-1.895 (-1.515) |
|
LEVt-1 |
3.691 (1.241) |
3.093 (1.808) |
2.211** (5.758) |
|
MBt-1 |
-0.486 (-0.416) |
-0.433 (-0.643) |
0.339 (2.249) |
|
SIGMAt-1 |
3.049 (0.773) |
2.422 (1.068) |
1.559* (3.061) |
|
AGEt-1 |
0.089 (0.655) |
0.136 (1.736) |
0.065** (3.732) |
|
SIZEt-1 |
-0.289 (-0.436) |
-0.514 (-1.349) |
-0.308** (-3.604) |
|
RETt-1 |
-11.092 (-0.903) |
-6.889 (-0.975) |
-2.147 (-1.353) |
|
R2 |
0.629 |
0.827 |
0.970 |
4.6.4. Manufacturing
Lastly, the experiment is conducted in the manufacturing sector. However, as Table 15 shows, while most of the results for independent and control variables are consistent with the whole Chinese stock market, they are all insignificant. It suggests that ESG may not be the main factor in future stock price crash risk in the manufacturing industry. As a technology-intensive industry, companies may focus more on factors such as changes in global demand, raw material prices, and technological changes. As the dominant industry in the Chinese market, this perhaps represents the current Chinese stock market that focuses more on traditional factors such as corporate financials, policy implications, and so on.
|
Variable |
NCSKEWt 1 |
DUVOLt 2 |
CRASHt 3 |
|
ESGt-1 |
-2.240 (-0.794) |
-1.700 (-0.780) |
-0.443 (-0.479) |
|
ROAt-1 |
40.692 (1.903) |
33.320 (2.019) |
4.379 (0.625) |
|
ROEt-1 |
-2.927 (-1.121) |
-2.330 (-1.156) |
0.379 (0.443) |
|
LEVt-1 |
-2.005 (-0.276) |
-1.634 (-0.291) |
-0.977 (-0.410) |
|
MBt-1 |
4.156 (0.994) |
3.283 (1.017) |
1.088 (0.795) |
|
SIGMAt-1 |
8.574 (1.095) |
5.614 (0.929) |
2.607 (1.017) |
|
AGEt-1 |
-0.419 (-1.177) |
-0.352 (-1.282) |
-0.087 (-0.745) |
|
SIZEt-1 |
3.729 (1.235) |
3.180 (1.365) |
0.761 (0.769) |
|
RETt-1 |
35.668 (0.956) |
31.213 (1.083) |
5.429 (0.444) |
|
R2 |
0.731 |
0.717 |
0.585 |
In summary, for the current traditional industry, factors like market sentiment, industry changes, and macroeconomics can also have a huge impact on crash risk. ESG assessment may not be the main factor, or it may be in the initial development stage and may need to take several years to become an integral part of assessing the future sustainability of businesses. Although domestic ESG information disclosure has not yet formed unified, mandatory, and systematic disclosure standards, it has put forward detailed requirements for the disclosure of information in the dimension of environmental governance and encourages more enterprises to conduct independent disclosure based on their own development needs.
5. Conclusion
This article investigates the impact of ESG ratings on the risk of stock price collapse, using a sample of Chinese A-share listed companies. The ESG rating system evaluates a company’s alignment with the Sustainable Development Goals (SDGs). This paper analyzes data from CRSP and Hexun, focusing on indicators of stock price crash risk, ESG scores, financial factors, and stock volatility, utilizing empirical regression models. The findings indicate a negative relationship between ESG scores and stock price crashes; however, the overall significance is limited. In developing countries, traditional fundamentals appear to exert a stronger influence on stock price collapse risk than emerging factors like ESG. Nonetheless, as development progresses, companies may become more motivated to engage in environmental governance and social risk management, improving their information disclosure. Moreover, effective internal and external governance plays a crucial role in market stability. Increased pressures can enhance the effectiveness of green credit policies in mitigating stock price collapse risks. This study's conclusions emphasize the need for companies to refine their governance practices for sustainable development. In terms of research limitations, this paper can use monthly data to better analyze the changes in the relationship between the risk of stock price collapse and different indicators during the data processing part. Secondly, in terms of regression analyses, more control variables, such as macro exchange rate, production efficiency, and gender ratio of management, can be considered subsequently in conjunction with reality. In this way, the impact of ESG on share price collapse can be better considered under the internal and external control of the market and businesses.
Acknowledgment
Qian Wu, Jiayu Fan, and Yiran Liu contributed equally to this work and should be considered co-first authors.
References
[1]. Habib, A., Hasan, M. M., Jiang, H. (2018) Stock price crash risk: review of the empirical literature. Accounting & Finance, 58: 211-251.
[2]. Peng, Z., Hu, C. (2020) The Threshold Effect of Leveraged Trading on the Stock Price Crash Risk: Evidence from China. Entropy (Basel, Switzerland), 22(3): 268.
[3]. Kim, J. B., Li, Y., Zhang, L. (2011) Corporate tax avoidance and stock price crash risk: firm-level analysis. Journal of Financial Economics, 100(3): 639-662.
[4]. Nguyen, Q. K. (2023) Does the financial flexibility prevent stock price crash risk during COVID-19 crisis? Evidence from the Vietnamese stock market. Heliyon, 9(11).
[5]. Shi, X., Cao, X., Xu, W., Hou, Y., Shang, L. (2023) The influence of lazy information disclosure on stock price crash risk: Empirical evidence from China. Plos one, 18(8): e0288552.
[6]. Jin, J., Liu, Y., Zhang, Z., Zhao, R. (2022) Voluntary disclosure of pandemic exposure and stock price crash risk. Finance Research Letters, 47: 102799.
[7]. Kong, X., Jin, Y., Liu, L., Xu, J. (2023) Firms' exposures on COVID-19 and stock price crash risk: Evidence from China. Finance Research Letters, 52: 103562.
[8]. Duan, J., Lin, J. (2022). Information disclosure of COVID-19 specific medicine and stock price crash risk in China. Finance Research Letters, 48: 102890.
[9]. Hossain, A. T., Masum, A. A., Xu, J. (2023) COVID-19, a blessing in disguise for the Tech sector: Evidence from stock price crash risk. Research in International Business and Finance, 65: 101938.
[10]. Xu, N., Liu, J., Dou, H. (2022) Environmental, social, and governance information disclosure and stock price crash risk: Evidence from Chinese listed companies. Frontiers in Psychology, 13: 977369.
[11]. Dumitrescu, A., Zakriya, M. (2021) Stakeholders and the stock price crash risk: What matters in corporate social performance? Journal of Corporate Finance, 67: 101871.
[12]. Zhang, Z., Ding, Y. (2023) The impact of green financial development on stock price crash risk from the perspective of information asymmetry in Chinese listed companies. Environmental Science and Pollution Research, 30(37): 87199-87214.
[13]. Wen M. (2023) Central environmental protection inspector and stock price crash risk-evidence from polluting industries firms in China. Environmental science and pollution research international, 30(3): 6530–6543.
[14]. Zhang, W., Liu, Y., Zhang, F., Dou, H. (2022) Green credit policy and corporate stock price crash risk: Evidence from China. Frontiers in Psychology, 13: 891284.
[15]. Hutton, A. P., Marcus, A. J., Tehranian, H. (2009) Opaque financial reports, R2, and crash risk. Journal of Financial Economics, 94(1): 67-86.
[16]. Callen, J. L., Fang, X. (2015) Short interest and stock price crash risk. Journal of Banking & Finance, 60: 181-194.
[17]. Xu, N., Yu, S., Yi, Z. (2013) Institutional investor herd behavior and stock price crash risk. Management World, 7: 31-43.
[18]. Chang, X., Chen, Y., Zolotoy, L. (2017) Stock Liquidity and Stock Price Crash Risk. Journal of Financial and Quantitative Analysis, 52(4): 1605‐1637.
[19]. Chen, J., Hong, H., Stein, J. C. (2001) Forecasting crashes: trading volume, past returns, and conditional skewness in stock prices. Journal of Financial Economics, 61(3): 345-381.
[20]. Li, J., Yang, Z., Chen, L., Cui, W. (2021) Research on the Mechanism of ESG Promoting Corporate Performance Based on the Perspective of Corporate Innovation. Science and Science and Technology Management, 42(9): 71-89.
[21]. Kim, Y., Li, H., Li, S. (2014) Corporate social responsibility and stock price crash risk. Journal of Banking & Finance, 43: 1-13.
[22]. Cao, T., Zhang, G. (2020) Voluntary information disclosure and stock price crash risk: A study based on conference calls. Economic Research, 55(11): 191-207.
Cite this article
Wu,Q.;Fan,J.;Liu,Y. (2025). ESG Rating Disclosure and Stock Price Crash Risk: Evidence from the Chinese Stock Market. Advances in Economics, Management and Political Sciences,215,1-19.
Data availability
The datasets used and/or analyzed during the current study will be available from the authors upon reasonable request.
Disclaimer/Publisher's Note
The statements, opinions and data contained in all publications are solely those of the individual author(s) and contributor(s) and not of EWA Publishing and/or the editor(s). EWA Publishing and/or the editor(s) disclaim responsibility for any injury to people or property resulting from any ideas, methods, instructions or products referred to in the content.
About volume
Volume title: Proceedings of the 4th International Conference on Financial Technology and Business Analysis
© 2024 by the author(s). Licensee EWA Publishing, Oxford, UK. This article is an open access article distributed under the terms and
conditions of the Creative Commons Attribution (CC BY) license. Authors who
publish this series agree to the following terms:
1. Authors retain copyright and grant the series right of first publication with the work simultaneously licensed under a Creative Commons
Attribution License that allows others to share the work with an acknowledgment of the work's authorship and initial publication in this
series.
2. Authors are able to enter into separate, additional contractual arrangements for the non-exclusive distribution of the series's published
version of the work (e.g., post it to an institutional repository or publish it in a book), with an acknowledgment of its initial
publication in this series.
3. Authors are permitted and encouraged to post their work online (e.g., in institutional repositories or on their website) prior to and
during the submission process, as it can lead to productive exchanges, as well as earlier and greater citation of published work (See
Open access policy for details).
References
[1]. Habib, A., Hasan, M. M., Jiang, H. (2018) Stock price crash risk: review of the empirical literature. Accounting & Finance, 58: 211-251.
[2]. Peng, Z., Hu, C. (2020) The Threshold Effect of Leveraged Trading on the Stock Price Crash Risk: Evidence from China. Entropy (Basel, Switzerland), 22(3): 268.
[3]. Kim, J. B., Li, Y., Zhang, L. (2011) Corporate tax avoidance and stock price crash risk: firm-level analysis. Journal of Financial Economics, 100(3): 639-662.
[4]. Nguyen, Q. K. (2023) Does the financial flexibility prevent stock price crash risk during COVID-19 crisis? Evidence from the Vietnamese stock market. Heliyon, 9(11).
[5]. Shi, X., Cao, X., Xu, W., Hou, Y., Shang, L. (2023) The influence of lazy information disclosure on stock price crash risk: Empirical evidence from China. Plos one, 18(8): e0288552.
[6]. Jin, J., Liu, Y., Zhang, Z., Zhao, R. (2022) Voluntary disclosure of pandemic exposure and stock price crash risk. Finance Research Letters, 47: 102799.
[7]. Kong, X., Jin, Y., Liu, L., Xu, J. (2023) Firms' exposures on COVID-19 and stock price crash risk: Evidence from China. Finance Research Letters, 52: 103562.
[8]. Duan, J., Lin, J. (2022). Information disclosure of COVID-19 specific medicine and stock price crash risk in China. Finance Research Letters, 48: 102890.
[9]. Hossain, A. T., Masum, A. A., Xu, J. (2023) COVID-19, a blessing in disguise for the Tech sector: Evidence from stock price crash risk. Research in International Business and Finance, 65: 101938.
[10]. Xu, N., Liu, J., Dou, H. (2022) Environmental, social, and governance information disclosure and stock price crash risk: Evidence from Chinese listed companies. Frontiers in Psychology, 13: 977369.
[11]. Dumitrescu, A., Zakriya, M. (2021) Stakeholders and the stock price crash risk: What matters in corporate social performance? Journal of Corporate Finance, 67: 101871.
[12]. Zhang, Z., Ding, Y. (2023) The impact of green financial development on stock price crash risk from the perspective of information asymmetry in Chinese listed companies. Environmental Science and Pollution Research, 30(37): 87199-87214.
[13]. Wen M. (2023) Central environmental protection inspector and stock price crash risk-evidence from polluting industries firms in China. Environmental science and pollution research international, 30(3): 6530–6543.
[14]. Zhang, W., Liu, Y., Zhang, F., Dou, H. (2022) Green credit policy and corporate stock price crash risk: Evidence from China. Frontiers in Psychology, 13: 891284.
[15]. Hutton, A. P., Marcus, A. J., Tehranian, H. (2009) Opaque financial reports, R2, and crash risk. Journal of Financial Economics, 94(1): 67-86.
[16]. Callen, J. L., Fang, X. (2015) Short interest and stock price crash risk. Journal of Banking & Finance, 60: 181-194.
[17]. Xu, N., Yu, S., Yi, Z. (2013) Institutional investor herd behavior and stock price crash risk. Management World, 7: 31-43.
[18]. Chang, X., Chen, Y., Zolotoy, L. (2017) Stock Liquidity and Stock Price Crash Risk. Journal of Financial and Quantitative Analysis, 52(4): 1605‐1637.
[19]. Chen, J., Hong, H., Stein, J. C. (2001) Forecasting crashes: trading volume, past returns, and conditional skewness in stock prices. Journal of Financial Economics, 61(3): 345-381.
[20]. Li, J., Yang, Z., Chen, L., Cui, W. (2021) Research on the Mechanism of ESG Promoting Corporate Performance Based on the Perspective of Corporate Innovation. Science and Science and Technology Management, 42(9): 71-89.
[21]. Kim, Y., Li, H., Li, S. (2014) Corporate social responsibility and stock price crash risk. Journal of Banking & Finance, 43: 1-13.
[22]. Cao, T., Zhang, G. (2020) Voluntary information disclosure and stock price crash risk: A study based on conference calls. Economic Research, 55(11): 191-207.