


1. Introduction
Sustainable development has become a critical area of focus in recent years, with an increasing emphasis on promoting renewable energy sources. In response, numerous public policies have been integrated into the national planning agendas of both developing and developed countries, particularly policies related to renewable energy certificates (RECs). China has its own renewable energy certificate system called GECs. In China, the Green Electricity Certificates (GECs) system was initiated in 2017 by the China Renewable Energy Engineering Institute (CREEI). This system allows individuals and companies to voluntarily purchase "green" electricity—primarily from solar and onshore wind power—and receive a personal certificate as recognition of their renewable energy consumption. One certificate represents the financial purchase of 1,000 kWh of electricity, which could only be sold in China's internal market once. The GEC system operates alongside the Feed-in Tariff (FiT) scheme, which supports large-scale onshore wind and solar photovoltaic (PV) projects. It also includes GEC offsets and complies with four official guidelines of the Chinese Certified Emission Reduction (CCER). Some researchers believe that the primary objective of this system is to reduce reliance on government subsidies for wind and solar energy while increasing revenue for private renewable energy firms. Despite the GEC trading policy being in place for over five years, issues related to transparency, regulation, and the system's role remain unresolved. Further, the compatibility of China's GEC system with the international green certificate market needs further exploration. Taking those drawbacks into consideration, this essay aims to innovatively evaluate the effect of GEC trading policy by applying a difference-in-difference model and give some valuable instructions on Chinese renewable policies to accelerate energy transition and meet dual-carbon targets.
In order to analyze the correlation between GEC trading policy and the share of renewables quantitively, the empirical methods of DID (difference in difference) are used to evaluate trading mechanisms. The study will utilize trading dada of China from the 31 provinces and states (excluding Hong Kong, Macao, and Taiwan) from 2017 to 2022, and all trading information can be searched from the official website of CREEI. More importantly, two authoritative sources, the "China Electric Power Yearbook" and the “Energy Statistical Yearbook”, will be used to supplement variables' data from 2007 to 2022. Data on influence factors from other related academic papers are also considered. Although there are some gap values in a few specific years, the dataset still adequately represents the development tendency of GEC trading policy and the deployment of renewables, as well as some potential factors that might influence this renewable electricity market-based mechanism. In addition, two empirical analyses are conducted, and a mechanism test verifies two hypotheses.
The paper is structured in seven sections. The first section is the background to give readers a fundamental introduction to Chinese renewable policy and other prior policies that support or subsidize wind and solar. More importantly, it indicates the history of the development of GEC policy with one graphic, as well as demonstrates annual GEC transaction electricity since the policy was launched. After that, the second section (literature review) compares standard and diverse methodologies towards renewable energy research and the green certificate market, then combines another green certificate market globally and points out the obstacles of GEC policy development and gaps in related research. The third part is theory. In this part, relationships between Renewable Installed Capacity and other control variables are presented graphically, and different connections between variables are further interpreted by text. Two hypotheses for the mechanism were proposed later. After the hypotheses, the fourth section is a data description; it shows the basic deployment information of Chinese installed capacity with renewables in 31 provinces currently and analyses the tendency of renewable energy generation by line charts since 2007. Following the data part, the fifth part focuses on the main empirical methods of DID. Then, the sixth section analyses the results of this study, including mechanism analysis to forecast whether the new explained variable led to the same results in China. Finally, the last section concludes with confidence and proposes policy implications.
The findings are surprising, and although the GEC trading policy is implemented in some provinces, the boosting influence of the share of renewables in China is unobvious. More interestingly, the study of the Baseline test and Parallel trend reveals that GEC trading policy has an adverse and continuous effect connected with renewable energy development; even though the explained variable Renewable Installed Capacity is replaced by another new variable, Renewable Power Generation, the results are similar. Even if the GECs is attached to environmental rights and interests, this policy instrument is not treated as applicable. The suggestion is that the Chinese government should carefully consider the utilization of policy instruments like the GECs in encouraging the sustainable development of renewables and attempt to combine other policy tools to take maximum advantage of market-based green energy mechanisms. In the future, scholars could explore the coordination of GEC trading policy and renewable subsidies policy to solve negative spillover effects and conduct more policy evaluations globally with real green power trading schemes.
2. Background
GECs began in 2017 when the National Development and Reform Commission (NDRC) issued a policy document <Notice on the Trial Implementation of the Renewable Energy Green Power Certificate Issuance and Voluntary Subscription Transaction System> to establish a voluntary market to trade green power exclusively for wind and solar electricity. The pilot period started in 2017, and in 2020, the <Several Remarks on Promoting the Healthy Development of Non-water Renewable Energy Generation> drives the overall implementation of the GECs trading policy. After two years, the 14th Five-year Plan mentions the demand to integrate electricity, carbon, and green power markets. In 2023, NDRC specially released <Notice on Full Coverage of Renewable Energy Green Power Certificates to Promote Renewable Energy Electricity Consumption> to officially confirm GEC as the sole instrument to track renewable energy consumption in China, which pushes the Chinese GEC scheme into a new stage. The Notice also states the authorized trading platforms (GECs Trading Platform, Beijing, and Guangzhou Power Trading Center) and transaction modes, including bilateral negotiation, listing, and centralized bidding. One year later, the publication of <Notice on Strengthening the connection between green electricity certificates and Energy saving and Carbon reduction policies to vigorously promote non-fossil energy consumption> indicates that GECs are added to the energy saving evaluation index accounting system. The central GEC policies in China are shown in Figure 1.
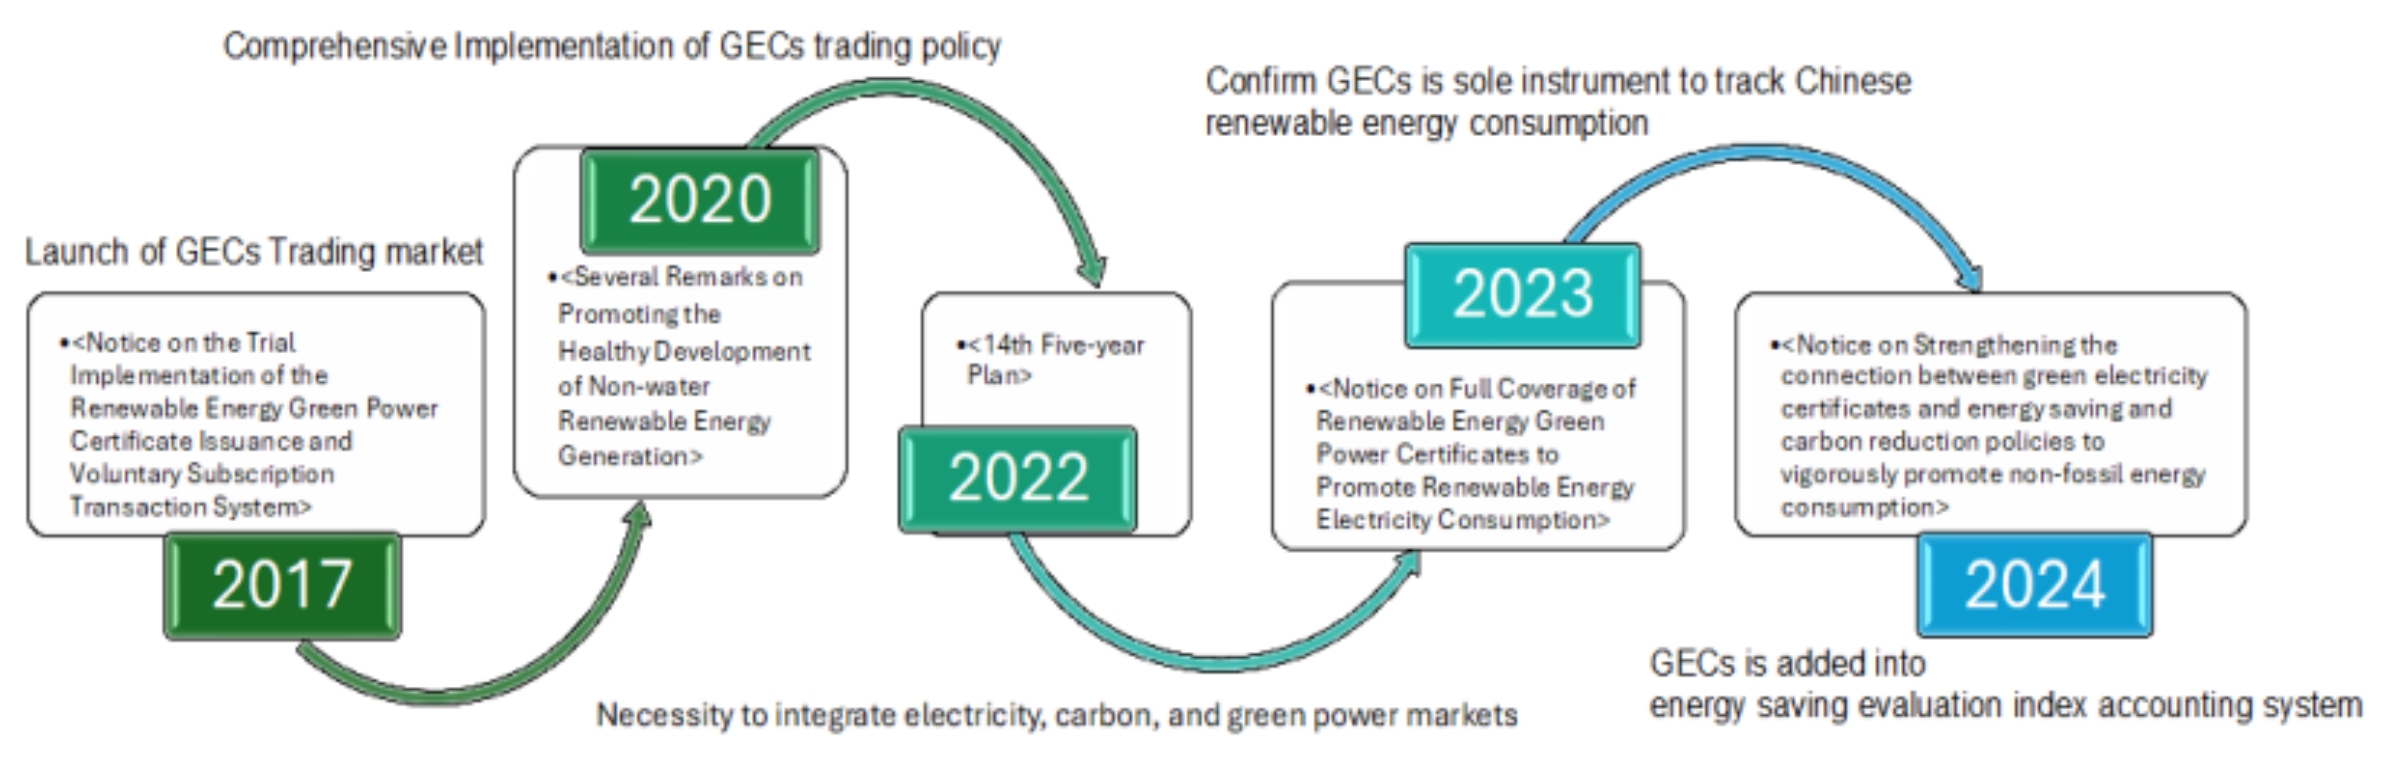
Source: The Oxford Institute for energy studios
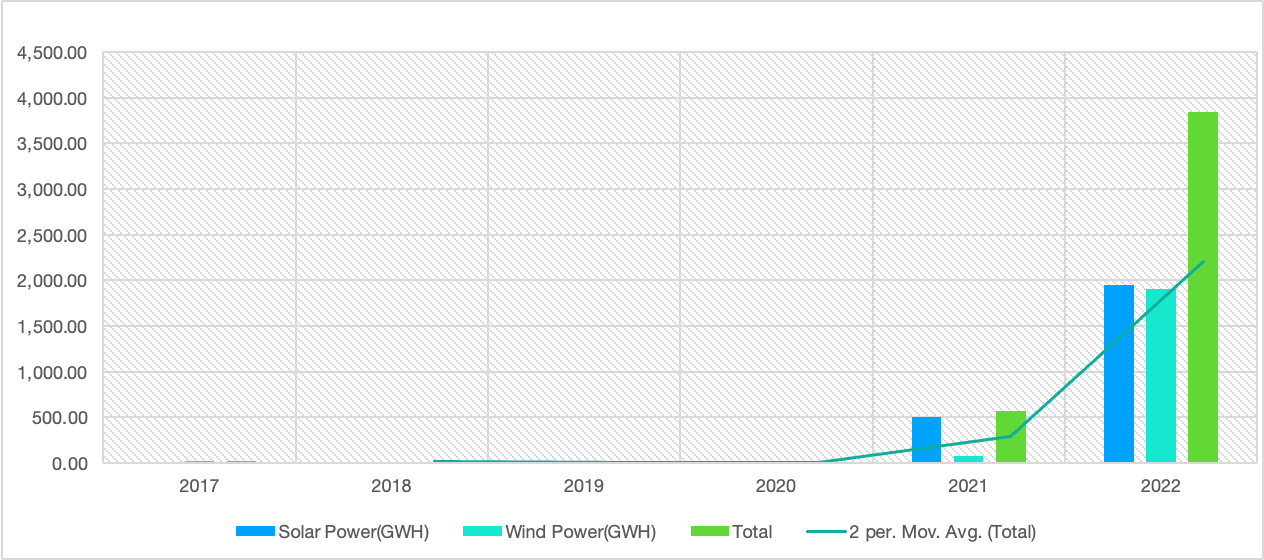
Over the past 7 years, the development of GECs has progressed quickly, and the trading policy has gained significant attention led by the Chinese government. Although it was treated as a method of subsidy to lessen governments’ financial burden at first, since the profits of selling could not be compatible with feed-in tariff subsidies for generators, the roles of GECs in reducing emissions and accelerating renewable transition cannot be ignored. Once a green electricity certificate is purchased, the owner will receive an electronic confirmation of the certificate, the entity (power projects), the type of energy produced (wind or solar), the unique number, and the name of the purchaser are all contained into the PDF, as well as the environmental attributes also attached to this certificate [1]. According to the official trading platform, by the end of 2022, a total of 59.54 million green certificates had been issued [2] and cumulative transaction electricity was 4462.01 GWH (Figure 2), as well as the average transaction price of GEC in 7 mouths of 2023 was around 5.87 dollars/piece [3]. Interestingly, the number of transactions is low since the trading policy was first issued and only recently seen an uptick in purchases (Figure 2).
However, the buyer will not receive the actual physical electricity supplies because of the purchase. Therefore, the real pilot scheme for green power trading was rolled out in 2021. As a result, wind and solar power could be directly traded by generation enterprises, and other renewable energy generation companies will be included in the scheme step by step. By this PPA (power purchase agreement) mechanism, purchasers can not only trade real green power but also get one piece of GEC as proof, which can be transacted later. In 2023, <Notice on Full Coverage of Renewable Energy Green Power Certificates to Promote Renewable Energy Electricity Consumption> welcomes all renewables joining directly in electricity trading except nuclear energy.
Source: https://www.greenenergy.org.cn/
Apart from the promotion of the GEC trading policy, there are also other Chinese policies supporting and subsidizing renewables. First is the feed-in tariff for wind and solar electricity generation. In 2009, NDRC issued <Notice on improving the feed-in tariff policy for wind power generation> to promise a fixed payment tariff for 20 years to new wind projects on a specific scheme. After this notice, solar photovoltaic (PV) subsidies were introduced in 2011. These two kinds of feed-in tariffs witness China's quick technical development of wind and solar power. The data shows that wind power capacity increased from 12 GW in 2008 to 63 GW in 2011, and solar PV capacity peaked at 16 GW in 2013 compared with less than 1 GW in 2010. In 2019, NDRC announced that the most subsidized feed-in tariffs for onshore wind will be phased out by the end of 2020. Two years later, the feed-in tariff for distributed and central solar PV was stopped by the end of 2021. Since 2021, new wind and solar PV projects will not receive subsidies below prevailing grid tariffs.
Another policy is the renewable energy purchase obligation, which is made for all non-hydro renewables. The rule of this policy is that provinces and covered entities could meet their quotas through different direct and indirect methods, but the policy did not result in a rise in purchases of GECs. In 2022, <Implementation Plan for Promoting Green Consumption> stated that provincial energy consumption quotas would be adjusted, and renewables would not count towards ‘dual control’ targets for energy consumption and energy intensity, which encourages the development of green energy and accelerates the energy transition.
3. Literature review
Academic research on Green Electricity Certificates (GECs) primarily focuses on the interrelationship between feed-in tariff (FIT) policies, carbon trading policies, and GEC trading policies [4,5], the comparison of Chinese renewable energy certificates and international certificates [3,6-8] or the optimization of GECs mechanism by different methodologies. Among the methods commonly employed to evaluate and optimize GECs mechanism are the System Dynamics (SD) model [5] and the market equilibrium model [9]. For example, builds a policy synergy model to explore the optimization relationship between GECs and Carbon Emissions Trading (CET) systems to achieve the goal of carbon neutrality [5]. While proposing a provincial differentiated market framework for voluntary flexible trading of green electricity in a systematic way for Zhejiang province [10]. Moreover, proposes a market equilibrium model with joint consideration on energy and TGC to help make the strategic decision of renewable energy [9]. However, the application of the DID model to analyze the efficiency of GECs policy remains relatively rare.
In contrast, scholars often use the DID model to assess the impact of comprehensive renewable energy policies or systems across different countries. For example, [11] sets a panel dataset covering 29 countries during the period of 2000 to 2015 to evaluate the effect of renewable energy policy. Similarly, Schaffer and Bernauer [12] employed new data on adoptions and modification of feed-in tariff and green certificate schemes in 26 advanced industrialized countries over a span of 20 years. Additionally, Nguyen and Pan build the difference-in-difference method to find the positive effect of the Electricity Certificate Scheme on hydroelectricity in Norway [13].
Moreover, research on the evaluation of renewable energy policies or systems predominantly focuses on foreign countries. For example, Joshi [14] explores the impacts of the renewable portfolio standard (RPS) on renewable electricity capacity across 29 states the United States through empirical analysis, as well as estimates the impact of RPS by Synthetic Control Method (SCM) on renewables capacity based on states enacted RPS between 1997 and 2000 of the United States [15]. Moreover, Ciarreta, Espinosa, and Pizarro-Irizar [16] develop a theoretical model of optimal regulation using data from the Spanish electricity system from 2008-2013. Given the scarcity of case studies on GECs within China, there is a notable gap in the literature. Therefore, this study aims to fill this gap by innovatively applying the DID model to evaluate a specific Chinese renewable policy (GECs). A more detailed, in-depth analysis will be conducted through an independent case study.
Existing scholarship on Green Electricity Certificates (GECs) identifies several common obstacles to the development of the green electricity certificate market. Yin highlights that the market demand for GECs is relatively low due to the original limited scope of trading power types, restricted usage, and the voluntary, non-compulsory nature of renewable energy consumption responsibility weights [3]. Also, provincial energy consumption quotas further reduce the willingness to trade GECs. Besides, the overlapping operating mechanisms of the GEC New Deal system and the Chinese Certified Emission Reduction (CCER) system, along with the lack of clear emission reduction boundaries with offsets, also pose significant challenges [3]. Competition with international certificates affects trading volumes, and the international awareness of GECs remains limited, leading many generators to prefer International Renewable Energy Certificates (I-RECs) or EU GO certificates over GECs [3]. Hove and Xie [1] take the view that transparency concerning regulations, attributes, and pricing remains insufficient. Furthermore, GECs do not incentivize the temporal or geographical matching of load with renewable supply, which could provide a perverse incentive in China’s renewable energy market while potentially making the certificates less attractive for certain purchasers interested in such matching [1]. Taking into account the challenges identified in the literature, the conceptual framework of the next section will collect valuable data and formulate assumptions to conduct an empirical analysis of the GEC policy implementation.
4. Conceptual framework
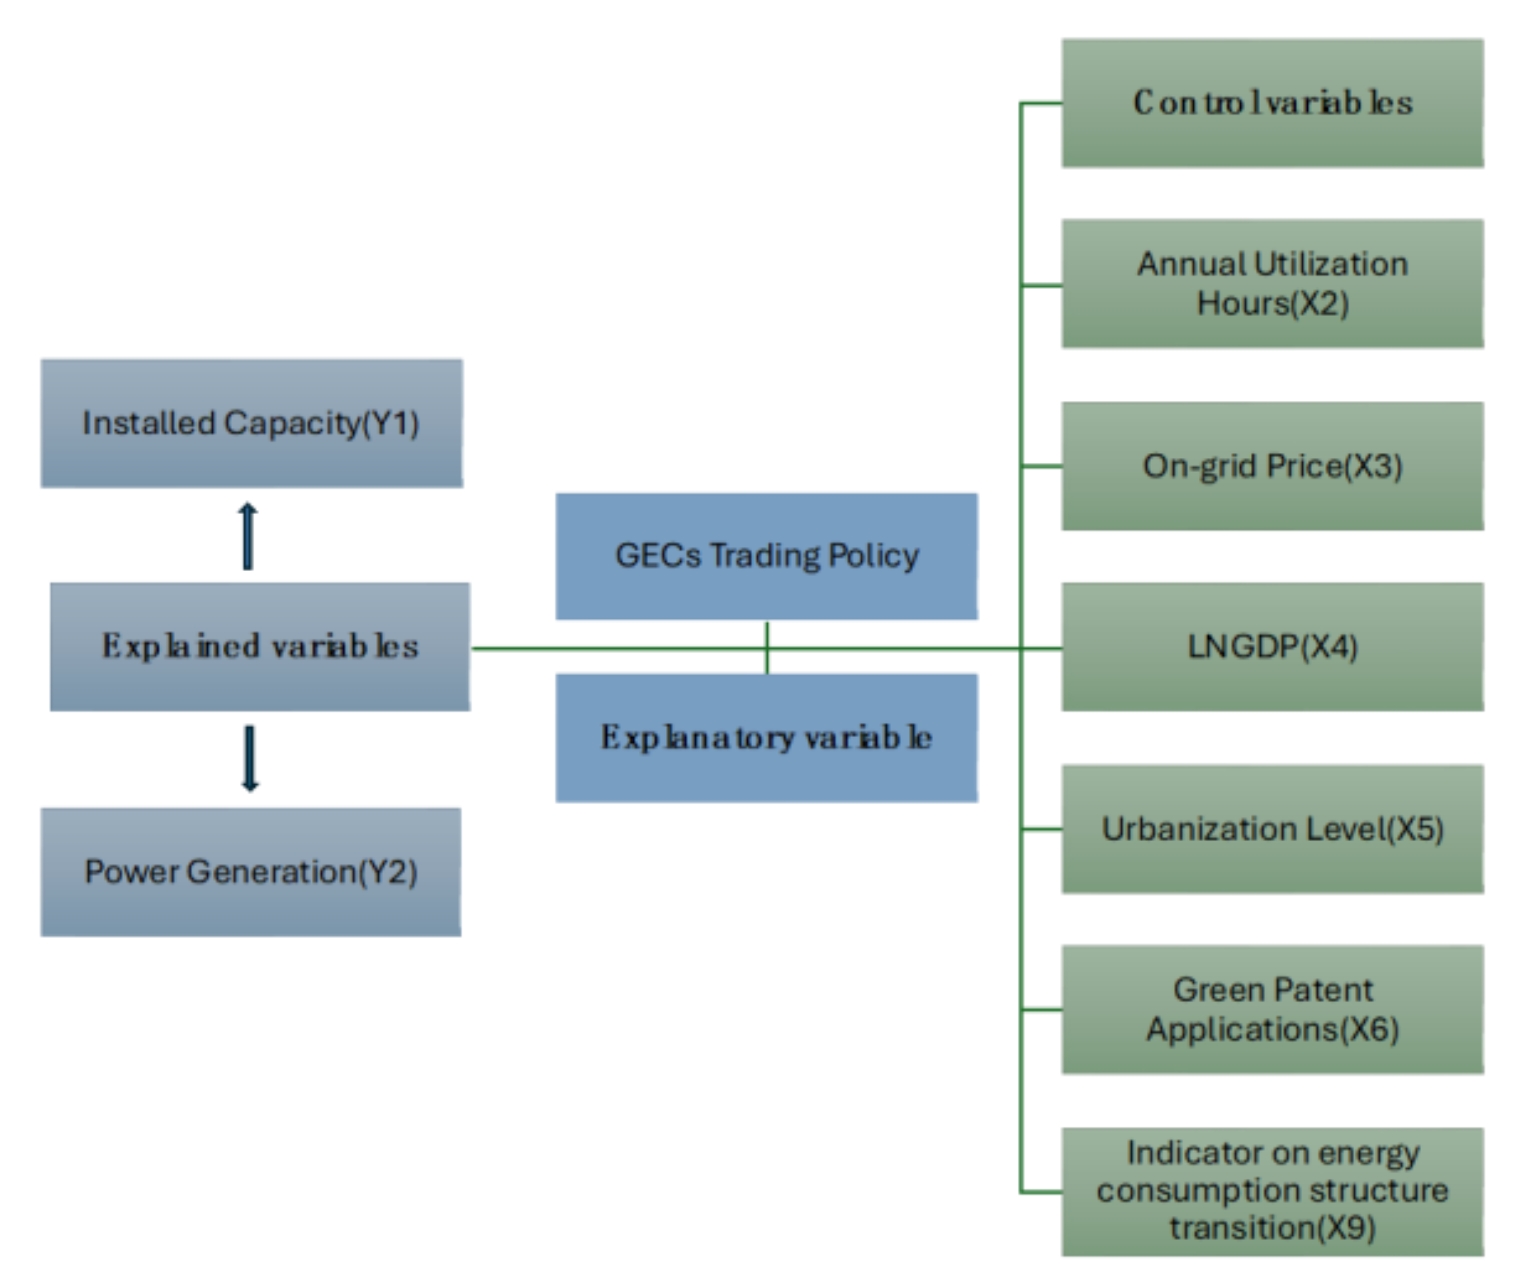
From the research question proposed in the introduction, two explained variables are identified to evaluate the effectiveness of the GEC trading policy. Figure 3 shows the framework of variables; the share of renewables can be represented by two variables:
(i) Installed Capacity: This variable, measured in kilowatts (kW), reflects investment trends in power and solar electricity, serving as the most direct indicator of renewable energy capacity.
(ii) Power Generation: This subset of installed capacity, measured in kilowatt-hours (kWh), serves as a critical measurable indicator of actual electricity produced.
In the subsequent empirical analysis, the installed capacity is treated as the primary experimental variable for building and conducting the DID model. Data were collected and classified into a panel dataset comprising 31 provinces (excluding Hong Kong, Macao, and Taiwan) from 2007 to 2022. Then, the binary variable indicates whether a city has started the GEC trading policy ('1') or has not ('0'). The core explanatory variable is the interaction between the provinces that have started transacting GECs and the trading year. A positive coefficient for this interaction would indicate that the GEC trading policy effectively improves the share of new energy in the trading province.
Following, six control variables are included to explore their potential correlation with the share of renewables. The explanations of those variables with hypotheses and econometric specifications are as follows:
X2: Annual Utilization Hours: Higher annual utilization hours correlate with a lower wind and solar discard rate, indicating better development of renewable energy projects.
X3: On-grid price: Higher on-grid electricity prices lead to greater profits for power generation enterprises and investment sectors, thereby increasing investment opportunities for wind and solar power projects.
X4: LNGDP (Logarithm of Regional GDP): Regions with higher economic development are more accepting of low-carbon transactions and are stronger drivers of wind and solar power development.
X5: Urbanization level: The higher the level of urbanization, the less available and affordable land, the more unfavorable to the construction of renewable energy projects.
X6: Green Patent Applications: A higher number of green patent applications indicates greater public attention to environmental protection and low-carbon transition, which is conducive to promoting wind and solar power projects.
X9: Indicator on energy consumption structure transition: Constructed from comprehensive indicators by Liu [17], a larger value suggests higher decarbonization of the energy consumption structure for the year, making the area more favorable for developing renewable projects.
Considering the internal relationships among all variables, as well as the obstacles to developing GECs, two hypotheses are proposed:
H I: GEC trading policy, restricted by the power generation indicators, hinders renewable energy development.
H Ⅱ: GEC trading policy constrained by urban economic and technical indicators, negatively contributes to the share of renewables.
5. Data
The sample contains the annual data for the 31 provinces (Hong Kong, Macao, and Taiwan are not included) in China from 2007-2022. The data on the installed capacity, representing the total installed renewable electricity capacity from the utilities and independent producers (limited to wind and solar power are measured according to the GEC trading rules), are sourced from China Electric Power Yearbook. Authored by the China Electric Power Development Promotion Association and other related experts, this publication is considered an authoritative reference. The other explained variable, power generation, indicates the renewable electricity generated from wind and solar power plants, excluding fossil fuels and hydropower, and is also derived from the China Electric Power Yearbook. In the empirical analysis, missing data for specific years in a province are treated as zero. For instance, all provinces are short of data on annual utilization hours in 2007 and 2008, and all data on on-grid price and energy consumption structure transition in 2021 and 2022 are missing. Figure 4 reveals China's renewable development tendency by four main evaluation indexes.

Source: <China Electric Power Yearbook>
The controlled variables of GEC trading policy, representing the specific power engineering, socioeconomic, and environmental attributes of the 31 provinces, are considered the primary drivers of renewable energy development in China. For example, annual utilized hours of generators and grid purchase prices of wind and solar power are essential indicators affecting the enthusiasm for renewable investment. Additionally, variables such as urbanization level, GDP, number of green patent applications, and energy consumption structure transition indicators are likely to influence the province's investment decisions in renewable energy.
6. Methodology
The DID model is widely used in policy analysis within the field of economics because it effectively isolates the influence of external factors, focusing on the participants of the experiment. This method provides a robust framework for assessing the causal impact of policy interventions. Therefore, this study will utilize the DID model to estimate the impact of the GEC trading policy on renewable energy development in China. The DID model will be employed to treat the implementation of the GEC trading policy as a natural experiment. This approach divides the sample into an experimental group, which includes provinces that have initiated the policy, and a control group, which consists of provinces that have not implemented the policy. By comparing the differences between these groups, the model allows for the evaluation of the policy's effectiveness. In this essay, provinces in China (excluding Hong Kong, Macao, and Taiwan) that have implemented the GEC trading policy will be designated as the experimental group, while provinces that have not begun the GEC trading policy will serve as the control group. For the purposes of this analysis, the period from 2007 to 2016 will be considered the pre-implementation phase, and the period from 2017 to 2022 will be regarded as the policy implementation phase. The specific model is constructed as follows:
Where
7. Results
7.1. Baseline result
Baseline test was conducted to evaluate whether there is a great difference between the effects seen in the control and treat groups before and after the GEC trading policy implementation. Results concerning Hypothesis I and Hypothesis Ⅱ are presented in a column of Table 1. Firstly, with the 496 observations and 0.929 R-squared, the policy has a notable effect on renewables. However, the coefficient of TreatPost is negative and statistically significant indicating that the policy implementation induced a decline in the share of renewable energy supply. Although X2: Annual Utilization Hours, X4: LNGDP, and X5: Urbanization level have the positive instrumental effect of renewables, compared with the provinces that did not launch the policy, the level of renewable development in the pilot provinces decreased by 0.279. As a result, GECs did not significantly accelerate the transformation of wind and solar power in the trading provinces.
|
(1) |
(1) |
|
|
m1 |
m1 |
|
|
VARIABLES |
ln_Y1 |
ln_Y2 |
|
TreatPost |
-0.2794** |
-0.2234* |
|
(0.1304) |
(0.1156) |
|
|
ln_X2 |
0.1986*** |
0.0855*** |
|
(0.0253) |
(0.0224) |
|
|
ln_X3 |
-2.0771* |
-3.6357*** |
|
(1.0854) |
(0.9619) |
|
|
ln_X4 |
6.6152* |
-0.0384 |
|
(3.8047) |
(3.3717) |
|
|
ln_X5 |
24.1264*** |
21.7411*** |
|
(2.5730) |
(2.2802) |
|
|
ln_X6 |
-0.3155** |
-0.2832** |
|
(0.1426) |
(0.1263) |
|
|
ln_X9 |
-0.3198 |
0.5962** |
|
(0.3243) |
(0.2874) |
|
|
Constant |
-19.1273** |
-5.0028 |
|
(8.0472) |
(7.1314) |
|
|
Observations |
496 |
496 |
|
R-squared |
0.929 |
0.923 |
|
Control Variables |
Y |
Y |
|
Individual FE |
Y |
Y |
|
Time FE |
Y |
Y |
Standard errors in parentheses
*** p<0.01, ** p<0.05, * p<0.1
7.2. Parallel trend test

To ensure the validity of the conclusions of the DID model, it is necessary to pass the parallel trend hypothesis; for that reason, the experimental group and the control group are required to have relatively consistent trends in the development of renewables before the implementation of the GECs trading policy. As a result, after multiplying
Figure 5 indicates the size and confidence intervals of the interaction term coefficients for different years. Before beginning the GEC trading policy (2007-2016), the trend of the confidence interval of the coefficient of the core explanatory variable is relatively flat and not prominent, indicating no significant difference between the trading and non-trading provinces before 2017. After implementing the GEC trading policy (2017-2022), the core explanatory variables are prominently negative at the level of 10%, indicating a difference in the level of renewable development between the trading and non-trading provinces. More importantly, except for the significant negative estimated coefficients, the trend of downward right sloping indicates that GEC trading policy has played a hindering role in the renewable transition, and the effect has been intensified year by year. Accordingly, the model satisfies the parallel trend hypothesis test, and Hypothesis I and Hypothesis Ⅱ are accepted.
7.3. Mechanism test
The new explained variable Y2 is chosen in this part to test the same Hypothesis, and the results are consistent (Table 1 and Figure 6). It can be seen from the data that the correlation between Y2 and other control variables is prominent, and it means the GEC trading policy still has a negative effect on renewables. H I and H Ⅱ are finally verified by data.

8. Conclusion
This essay focuses on a panel of 31 provinces for the period 2007-2022 to demonstrate the effectiveness of the GEC trading policy regarding renewables. Therefore, the results of empirical analysis were obtained by using DID methods. Furthermore, a parallel trend test was adopted to ensure the stability of the baseline benchmark results. However, the employ of dummy variables and regression model from this study neglects the heterogeneity of the policy type. The main findings are as follows:
(1) GEC trading policy does not play an inherent role in promoting but limits the development of the trading provinces in terms of power generation and installed capacity.
(2) The higher a province's level of decarbonization, the less necessity to rely on the stimulus of GEC trading policies. The development of green patent technology restricts the policy efficiency.
(3) The boost of the trading policy provincially will reduce the on-grid price of renewables.
Based on the above conclusions, this paper puts forward the following suggestions for policy:
(1) GEC trading policy should not be treated as a path to replace government subsidies for existing projects supported under the feed-in tariff. The negative spillover effects must be dealt with as soon as possible.
(2) The formulation of GEC trading policies should be reasonably combined with other renewables policies, and more effective incentive measures should be adopted to encourage the number of transactions.
(3) In the future, China's GECs should be innovative in forms of time and match the demand geographically, which is flexible enough to promote the share of renewables [1].
References
[1]. Hove, A., & Xie, G. S. (2023). Green certificates with Chinese characteristics: Will green certificates help China's clean energy transition? (No. 9). OIES Paper: CE.
[2]. NEA. (2023, February 14). The National Energy Administration (NEA) has released information on the development of renewable energy in 2022 and has presented information on the progress of work to improve the Green Power Certificate system for renewable energy. The State Council, The People’s Republic of China. https: //www.gov.cn/xinwen/2023-02/14/content_5741481.htm
[3]. Yin, Z. (2023). Comparison of Chinese Green Electricity Certificate and International Green Electricity Certificate. Sch J Econ Bus Manag, 11, 297-302.
[4]. Zhou, D., Dong, Z., Sang, X., Wang, Q., & Yu, X. (2023). Do feed-in tariff reduction and green certificate trading effectively promote regional sustainable development?. Energy, 283, 129042.
[5]. Feng, T. T., Li, R., Zhang, H. M., Gong, X. L., & Yang, Y. S. (2021). Induction mechanism and optimization of tradable green certificates and carbon emission trading acting on electricity market in China. Resources, conservation and recycling, 169, 105487.
[6]. Jia, H., Liu, D., Zhuo, G., Feng, Y., & Han, Y. (2023, April). Review for Global Practices of Renewable Energy Certificates. In 2023 8th Asia Conference on Power and Electrical Engineering (ACPEE) (pp. 642-646). IEEE.
[7]. Senturk, A., & Ozcan, M. (2023). Turkey's national renewable energy certificate system: a comparative assessment. Environment, Development and Sustainability, 1-29.
[8]. Akkaya, M. A., & Onuk, M. Is Renewable Energy Certification System Necessary for Turkey. Romania, 7, 8.
[9]. Guo, H., Chen, Q., Xia, Q., & Kang, C. (2019). Modeling strategic behaviors of renewable energy with joint consideration on energy and tradable green certificate markets. IEEE Transactions on Power Systems, 35(3), 1898-1910.
[10]. Xu, Q., Qiao, S., Zhou, H., Luo, R., Ma, X., & Gong, J. (2022). Mechanism design and consumption certification of differentiated green electricity trading: A Zhejiang experience. Frontiers in Energy Research, 10, 967290.
[11]. Liu, W., Zhang, X., & Feng, S. (2019). Does renewable energy policy work? Evidence from a panel data analysis. Renewable energy, 135, 635-642.
[12]. Schaffer, L. M., & Bernauer, T. (2014). Explaining government choices for promoting renewable energy. Energy policy, 68, 15-27.
[13]. Pan, D. W., & Nguyen, L. T. (2020). Electricity Certificate Scheme as an Incentive for Renewable Energy Development in Norway (Master's thesis, Handelshøyskolen BI).
[14]. Joshi, J. (2021). Do renewable portfolio standards increase renewable energy capacity? Evidence from the United States. Journal of Environmental Management, 287, 112261.
[15]. Maguire, K., & Munasib, A. (2016). The disparate influence of state renewable portfolio standards on renewable electricity generation capacity. Land Economics, 92(3), 468-490.
[16]. Ciarreta, A., Espinosa, M. P., & Pizarro-Irizar, C. (2017). Optimal regulation of renewable energy: A comparison of Feed-in Tariffs and Tradable Green Certificates in the Spanish electricity system. Energy Economics, 67, 387-399.
[17]. Liu, Y., Q, Sun, W, & Zhu, Z. S. (2022). Assessing the Impacts of Carbon Markets on the Low-Carbon Transition of Energy Structures: Pathways to Achievement. China Environmental Science, 42(9), 4369-4379.
Cite this article
Liu,A. (2025). Do Green Electricity Certificates (GECs) Increase the Share of Renewable Energy? Evidence from China. Advances in Economics, Management and Political Sciences,215,30-42.
Data availability
The datasets used and/or analyzed during the current study will be available from the authors upon reasonable request.
Disclaimer/Publisher's Note
The statements, opinions and data contained in all publications are solely those of the individual author(s) and contributor(s) and not of EWA Publishing and/or the editor(s). EWA Publishing and/or the editor(s) disclaim responsibility for any injury to people or property resulting from any ideas, methods, instructions or products referred to in the content.
About volume
Volume title: Proceedings of the 4th International Conference on Financial Technology and Business Analysis
© 2024 by the author(s). Licensee EWA Publishing, Oxford, UK. This article is an open access article distributed under the terms and
conditions of the Creative Commons Attribution (CC BY) license. Authors who
publish this series agree to the following terms:
1. Authors retain copyright and grant the series right of first publication with the work simultaneously licensed under a Creative Commons
Attribution License that allows others to share the work with an acknowledgment of the work's authorship and initial publication in this
series.
2. Authors are able to enter into separate, additional contractual arrangements for the non-exclusive distribution of the series's published
version of the work (e.g., post it to an institutional repository or publish it in a book), with an acknowledgment of its initial
publication in this series.
3. Authors are permitted and encouraged to post their work online (e.g., in institutional repositories or on their website) prior to and
during the submission process, as it can lead to productive exchanges, as well as earlier and greater citation of published work (See
Open access policy for details).
References
[1]. Hove, A., & Xie, G. S. (2023). Green certificates with Chinese characteristics: Will green certificates help China's clean energy transition? (No. 9). OIES Paper: CE.
[2]. NEA. (2023, February 14). The National Energy Administration (NEA) has released information on the development of renewable energy in 2022 and has presented information on the progress of work to improve the Green Power Certificate system for renewable energy. The State Council, The People’s Republic of China. https: //www.gov.cn/xinwen/2023-02/14/content_5741481.htm
[3]. Yin, Z. (2023). Comparison of Chinese Green Electricity Certificate and International Green Electricity Certificate. Sch J Econ Bus Manag, 11, 297-302.
[4]. Zhou, D., Dong, Z., Sang, X., Wang, Q., & Yu, X. (2023). Do feed-in tariff reduction and green certificate trading effectively promote regional sustainable development?. Energy, 283, 129042.
[5]. Feng, T. T., Li, R., Zhang, H. M., Gong, X. L., & Yang, Y. S. (2021). Induction mechanism and optimization of tradable green certificates and carbon emission trading acting on electricity market in China. Resources, conservation and recycling, 169, 105487.
[6]. Jia, H., Liu, D., Zhuo, G., Feng, Y., & Han, Y. (2023, April). Review for Global Practices of Renewable Energy Certificates. In 2023 8th Asia Conference on Power and Electrical Engineering (ACPEE) (pp. 642-646). IEEE.
[7]. Senturk, A., & Ozcan, M. (2023). Turkey's national renewable energy certificate system: a comparative assessment. Environment, Development and Sustainability, 1-29.
[8]. Akkaya, M. A., & Onuk, M. Is Renewable Energy Certification System Necessary for Turkey. Romania, 7, 8.
[9]. Guo, H., Chen, Q., Xia, Q., & Kang, C. (2019). Modeling strategic behaviors of renewable energy with joint consideration on energy and tradable green certificate markets. IEEE Transactions on Power Systems, 35(3), 1898-1910.
[10]. Xu, Q., Qiao, S., Zhou, H., Luo, R., Ma, X., & Gong, J. (2022). Mechanism design and consumption certification of differentiated green electricity trading: A Zhejiang experience. Frontiers in Energy Research, 10, 967290.
[11]. Liu, W., Zhang, X., & Feng, S. (2019). Does renewable energy policy work? Evidence from a panel data analysis. Renewable energy, 135, 635-642.
[12]. Schaffer, L. M., & Bernauer, T. (2014). Explaining government choices for promoting renewable energy. Energy policy, 68, 15-27.
[13]. Pan, D. W., & Nguyen, L. T. (2020). Electricity Certificate Scheme as an Incentive for Renewable Energy Development in Norway (Master's thesis, Handelshøyskolen BI).
[14]. Joshi, J. (2021). Do renewable portfolio standards increase renewable energy capacity? Evidence from the United States. Journal of Environmental Management, 287, 112261.
[15]. Maguire, K., & Munasib, A. (2016). The disparate influence of state renewable portfolio standards on renewable electricity generation capacity. Land Economics, 92(3), 468-490.
[16]. Ciarreta, A., Espinosa, M. P., & Pizarro-Irizar, C. (2017). Optimal regulation of renewable energy: A comparison of Feed-in Tariffs and Tradable Green Certificates in the Spanish electricity system. Energy Economics, 67, 387-399.
[17]. Liu, Y., Q, Sun, W, & Zhu, Z. S. (2022). Assessing the Impacts of Carbon Markets on the Low-Carbon Transition of Energy Structures: Pathways to Achievement. China Environmental Science, 42(9), 4369-4379.