


1. Introduction
Attrition is the rate at which employees leave a company voluntarily over a specific period of time [1]. It is a crucial metric for organizations as it can indicate potential employee satisfaction, engagement, or working environment issues. In 2024, voluntary attrition accounts about 13% on average across all industries. According to Hubstaff in its 2024 employee turnover statistics, “It is more expensive to replace someone and now takes longer, an average of 44 days.” Attrition brings multiple drawbacks because it usually cannot be predicted and will leave gaps in an organization. Besides, there could be a subsequent loss of expertise and institutional knowledge, the extra expenditure to replace departing employees, and the influences on culture and morale. Due to these severe problems caused by employee attrition, there is a need to examine the factors that lead to employee attrition and build machine learning models with predictive power to a certain extent for employee attrition prediction.
Nowadays, a ‘naked resignation’ trend has become popular, and people share their experiences about attrition without securing another job on the social media platform. People joining this trend include employees who can earn more than 30,000 CNY a month. Participants whose income lies in this sector opine that although they are earning a good salary, they still decide to quit the job as it is repetitive and stressful. This situation broaches the question of which internal factors outweigh income and other external factors when deciding to attrit.
The study aims to build a suitable machine learning model with both internal and external factors to predict employee attrition, followed by the analysis of how imperative those internal factors are when the model makes the decision. For this purpose, a dataset collected in the real world by Edward Babushkin, a Russian people analyst and prolific writer, is used for training and evaluation.
The paper consists of five sections. Firstly, this paper will present a literature review of the existing studies on employee attrition, including the type of factors involved, machine learning models and evaluation metrics frequently used. The next section will explicate the variables in the dataset and provide an exploratory data analysis, followed by an overview of the research methodology. The third section will elucidate the model training and tunning and give an interpretation of some models. The fourth section will provide the evaluation result to choose the most suitable model and rank the important factors for employee attrition prediction suggested by that model. The last section will draw conclusions and elaborate on future improvements.
2. Literature review
2.1. Machine learning models for employee attrition
Employee attrition prediction is a binary classification, which assigns label 0 to the employee on the job and assigns label 1 to the attrited employee. Four commonly used machine learning techniques are listed below.
Logistic Regression establishes the relationship between the linear combination of a constant and one or more independent variables and the log-odds
Tree Classifiers are a set of classifiers derived from the fundamentals of Decision Tree, which include Decision Tree, Random Forest, Extra Tree Classifiers, and others. Partitioning the feature space of the training set recursively can construct a decision tree structure. The objective of this process is to find partition rules to provide a robust hierarchical model [4]. The tree contains edges and nodes. The nodes represent a choice or an event and the edges represent decision rules [5]. Random Forest contains multiple trees. A random subset of the training set and some randomly chosen features are used to build each tree. The output is the class selected by most trees [6]. The Extra Tree Classifier is a type of Random Forest, but it chooses a random cut point during partitioning instead of always choosing the best one as Random Forest. The advantages of Tree Classifiers are that it has a good understanding of what variables will generate more accurate results and it is robust to outliers. On the other hand, the disadvantage of this model is that it is prone to overfitting when the tree structure is too complex and the model contains highly specific rules that only apply to the training set. Pruning techniques have to be applied to avoid or reduce overfitting.
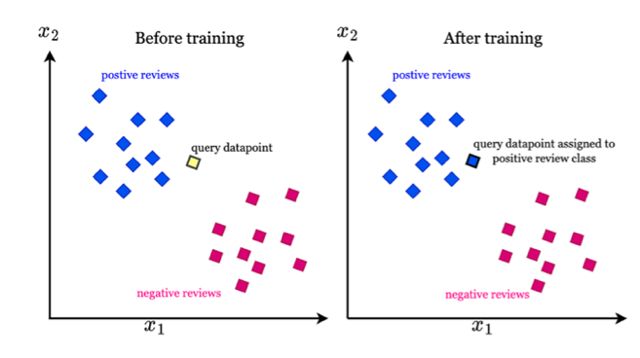
K-nearest Neighbors (KNN) algorithm assigns the output to a data point by choosing the most class suggested by k-nearest points around it. The advantages of this algorithm are that it does not require a training period since the data is a model which will be the reference for the future prediction and it has few hyperparameters. However, there are three disadvantages of this algorithm. First, the model is sensitive to redundant features since all features contribute to finding the similarity between the query datapoint and datapoints in the training set. Second, the model is unclear on which type of distance to use to find the nearest neighbors that can generate the best results. Third, computation cost is quite high when the training set is large [7].
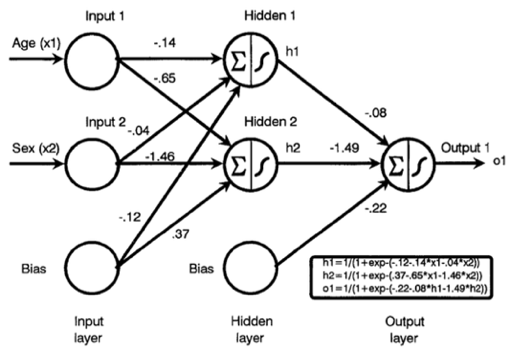
Neural Network sums up the inputs multiplied by internal weights and applies the non-linear function to this sum to generate the output. The weight is adjusted during the learning process. The advantages of Neural Network are that it can figure out all potential interactions between variables and abundant algorithms are able to be implemented in the model. Nevertheless, the model is still a black box and limited insights can be provided for relationships between variables.
2.2. Employee attrition prediction with objective factors
Machine learning techniques are applied to a dataset to predict whether an employee attrits. The models are evaluated with either the testing set split from the original dataset or a separate one collected in another company [8]. Several conclusions are obtained from the result. First, the most important factor that makes an employee attrit is the length of service. Employees with fewer years of service have a higher chance to quit regardless of age [9]. Second, the significant predictors of employee attrition rate are the degree of satisfaction for an employee on his responsibility in the project, the annual remuneration, the performance rating, and the number of projects assigned to the employee every three months [8]. Thirdly, the variables that contribute to attrition mainly are monthly salary, age, overtime work, and distance between home and the company [10]. Lastly, the robust models for employee attrition prediction are Decision Tree, Random Forest [11], and XGBoost [12].
2.3. Employee attrition prediction with subjective factors
Latent profile analysis is used to divide individuals into different classes. Individuals with similar personality profiles are in the same class. The best classification number is selected, and five classes are obtained. Then, Chi-squared analyses are applied to each class to examine whether there are appreciable differences among classes on attrition criteria. The results indicate that individuals with below-average extraversion plus above-average neuroticism, and individuals with below-average conscientiousness, above-average extraversion, and above-average neuroticism are more likely to attrit than individuals with below-average neuroticism, moderate extraversion, moderate agreeableness, and above-average conscientiousness [13].
2.4. Evaluation metrics
The evaluation metrics include four indexes, which are precision, recall, accuracy, and
2.5. Literature review summary
The literature review points out the limitations of the current study on employee attrition prediction, which helps our study find the research direction. Most studies on employee attrition with machine learning techniques use datasets that provide many objective factors for investigation. The general conclusion is that income, length of service, age, and workload contribute most to one’s attrition. The only internal factor provided is the number measuring one’s satisfaction towards employment, but it can vary depending on the personality of the employee and the perception of the job. Previous studies targeting employee’s internal factors like the big five personality did not combine with the current state-of-art technology, which is machine learning. Under this circumstance, this paper uses a dataset with both objective factors like age, experience score, and transportation method to the company, together with subjective factors like the big five personality, which are agreeableness, conscientiousness, extraversion, openness, and neuroticism, using machine learning to build a model with the predictive ability to a certain extent. Recall is the most important criterion for evaluation because the model does not want to miss any employee who wants to attrit. The relatively high precision score at the same time assures that the model does not predict all cases as attrition in order to achieve a high recall score.
3. Reserch methodology
3.1. Dataset
The dataset is collected in the real world by Edward Babushkin, a Russian people analyst and prolific writer. It contains seven quantitative variables and nine qualitative variables. Objective variables are age, coach, gender, greywage, head_gender, industry, profession, stag, traffic, and way. Subjective factors are anxiety, extraversion, independ, novator, and selfcontrol.
• Stag: Stag represents the experience of the employee. The higher the score is, the more experienced the employee is with the work.
• Traffic: Traffic represents the pipeline from which the employee comes to the company. For example, the employee can apply for the position via job sites, be referred by others, or be invited by the employer.
• Greywage: Greywage represents the party that is responsible for paying the tax. If the wage is grey, the employee does not have the tax authority, and the employer takes that responsibility.
• Way: Way represents the employee’s way of transportation to the company.
• Extraversion: Extraversion is one dimension of the big five personality. The higher the score is, the employee is more outgoing and talkative.
• Independ: Independ means agreeableness, which is one dimension of the big five personality. The higher the score is, the employee is more kind, sympathetic, cooperative, and considerate.
• Selfcontrol: Selfcontrol means conscientiousness, which is one dimension of the big five personality. The higher the score is, the employee is more organized, systematic, and thorough.
• Anxiety: Anxiety means neuroticism, which is one dimension of the big five personality. The higher the score is, the employee is more likely to have feelings like worry, fear, anger, envy, depression, and loneliness.
• Novator: Novator means openness, which is one dimension of the big five personality. The higher the score is, the employee is less conventional and has a wider range of interests.
3.2. Exploratory Data Analysis (EDA)
The graphs below describe the relationships between variables.
Figure 3 elaborates on the age and openness distribution for employees who stay or resign. The blue curves and histograms represent the number of attrited employees in different age and openness score intervals. Those in green describe the situation for employees who do not leave the company. The distribution curve has an obvious shift for these two groups of employees on these two variables, indicating that age and openness may be important factors to predict whether an employee will attrit or not.
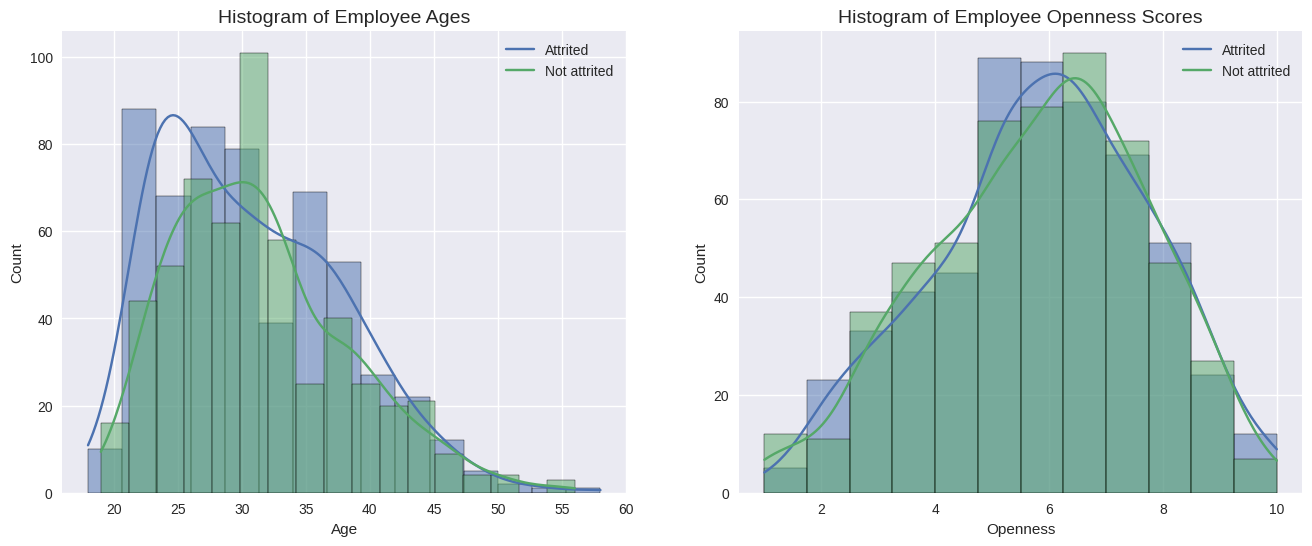
Figure 4 describes the number and the percentage of males and females who stay in the position or leave a company. Although an uneven distribution of gender is observed, there is no significant difference in the percentage of employees who attrit or not for both genders. It is inferred from this bar chart that gender may not be an important factor in predicting employee attrition.
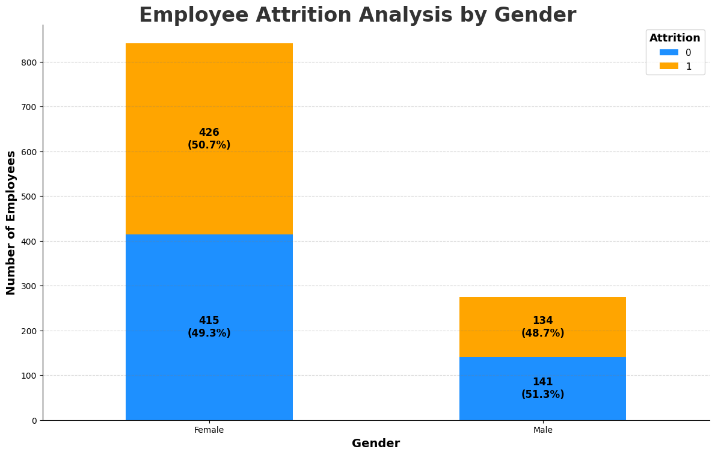
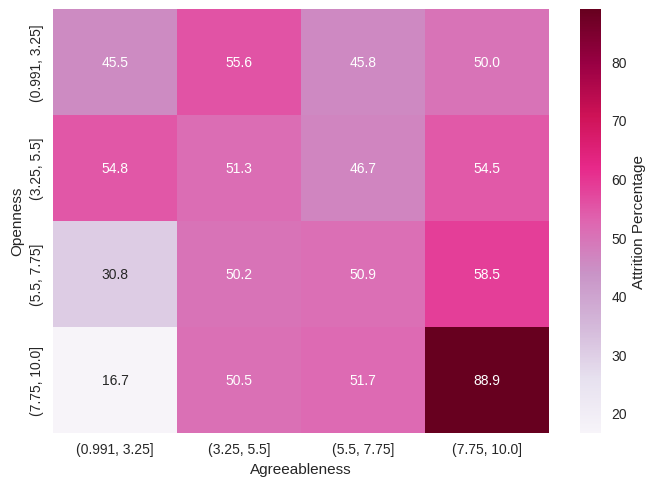
Figure 5 explicates the percentage of employees who attrit given a specific agreeableness and openness score. The distinctive difference among each agreeableness range only appears when the openness score is high. When the openness score is low, the percentages of attrited employees with different agreeableness scores are similar. When the openness score is high, those percentages are quite different. The heat map alludes that openness score may be a more important factor than agreeableness for employee attrition prediction.
3.3. Overview of proposed research methodology
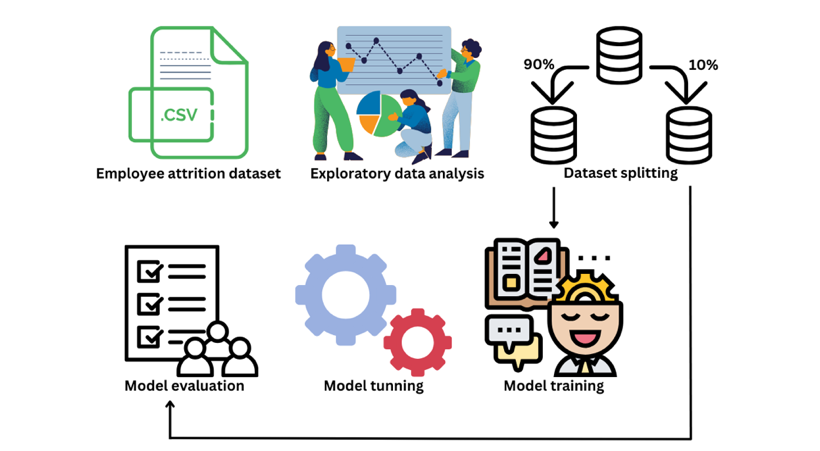
Figure 6 demonstrates the methodological analysis of the proposed research. After the exploratory data analysis, training and testing sets are obtained from the dataset. Then, proposed machine learning models are applied to the training set. The models are further tuned by changing parameters. Then the evaluation will use the testing set. Finally, the model with the highest recall and a relatively reasonable precision score will be chosen as the model with the best performance.
4. Model bulding and interpretation
4.1. Model training
To load the dataset from the CSV file into the memory for data processing and model training, the Python pandas library is used. Duplicated rows are dropped and there are 560 attrition cases and 556 employees who do not attrit. Dummy variables are obtained for each qualitative variable and there are 58 columns in total after getting dummies. Ten percent of the dataset is used as the unseen dataset for evaluation with the ratio of two classes staying the same as the original dataset.
4.2. Model tunning
To improve the model performance, several parameters in Decision Tree and Random Forest are experimented.
4.2.1. Criterions
There are two scoring criteria to examine tree impurity. Entropy measures the disorder of features with the target. It is described in the equation (2) below, where
4.2.2. Class weight
Since every employee who wants to leave the company needs to be captured, the class_weight parameter can be adjusted to assign a larger weight to class one, which is the label that represents an employee who leaves the company, because this class is more significant than the other. The loss with reference to class one should count more.
4.3. Model interpretation
Feature importance provided by Decision Tree and Random Forest is calculated based on the impurity decrease, which is either entropy or gini impurity that a feature brings during tree partitioning. It is computed as the normalized total reduction of the criterion brought by that feature. One feature column is shuffled randomly in the training set and the model will be used to make predictions based on the modified dataset. The performance drop on the criterion from the training set to the modified set is calculated. The larger the drop is, the larger importance is assigned to the feature.
5. Result
Each model is evaluated using the criteria mentioned in the literature review. Table 1 presents the score of each criterion achieved by each model. Random Forest with “entropy” as the criterion parameter and “{0:1, 1:2}” as the class_weight parameter outperforms other models. The best model uses entropy to examine tree impurity, tries to maximize InfoGain during the tree splitting, and focuses more on the tree impurity caused by class one. Table 1 suggests that the best model Random Forest achieves the highest recall, precision, accuracy, and macro
|
Model |
Recall |
Accuracy |
Precision |
Macro |
|
Logistic Regression |
0.642857 |
0.669643 |
0.679245 |
0.660550 |
|
Decision Tree |
0.750000 |
0.651786 |
0.626866 |
0.682927 |
|
Random Forest |
0.767857 |
0.767857 |
0.767857 |
0.767857 |
|
Extra Tree Classifier |
0.696429 |
0.732143 |
0.750000 |
0.722222 |
|
KNN |
0.607143 |
0.651786 |
0.666667 |
0.635514 |
|
Neural Network |
0.696429 |
0.669643 |
0.661017 |
0.678261 |
The most important feature suggested by the best model should provide the largest InfoGain change before and after this feature column is shuffled according to the definition of feature importance. Table 2 presents the measurement of how important each variable is to reduce the tree impurity. Two objective variables experience and age achieve the highest importance scores, followed by the big five personality, the scores of which are all larger than 0.05. By contrast, other objective variables like gender, transportation way, and whether the employee needs to pay the tax all score less than 0.02.
|
Feature name |
Importance score |
|
experience |
0.120975 |
|
age |
0.098815 |
|
openness |
0.071621 |
|
agreeableness |
0.067563 |
|
extraversion |
0.066114 |
|
conscientiousness |
0.066095 |
|
neuroticism |
0.060055 |
6. Discussion
The most suitable model for employee attrition prediction given the dataset with the big five personality involved is Random Forest with entropy as the impurity criterion and a larger weight assigned to class one. The model suggests that the big five personality plays a more important role than some objective factors like gender, transportation way, and whether the employee needs to pay the tax in prediction but is still less important than working experience score and age. The three most important variables for prediction are working experience score, age, and openness score, which are in accordance with the hypothesis that age and openness may be important factors to predict whether an employee will attrit or not in exploratory data analysis. Attrited employees have a lower average age and openness score. Gender is not important in employee attrition prediction since it has a low feature important score, so the exploratory data analysis and the model draw the same conclusion on this variable. Among the big five personality, the openness score achieves the highest importance score. Only when the openness score is high, the percentage of attrited employees with a low agreeableness score is low and that with a high agreeableness score increases significantly.
To further investigate the importance of the big five personality in employee attrition prediction, the significant objective factors proposed by other studies like monthly income, overtime work, distance from home [10], and performance rating [8] can be involved to compare their importance with the big five personality. First-hand data needs to be collected. Besides, a study finds that some departments have a larger amount of employee attrition than others and performs a department-wise analysis [11]. When collecting the dataset, the profession or the industry can be a constraint and a more robust model specific to one field can be built.
References
[1]. Alao, D. A. B. A., & Adeyemo, A. B. (2013). Analyzing employee attrition using decision tree algorithms. Computing, Information Systems, Development Informatics and Allied Research Journal, 4(1), 17-28.
[2]. Tolles, J., & Meurer, W. J. (2016). Logistic regression: relating patient characteristics to outcomes. Jama, 316(5), 533-534.
[3]. Tu, J. V. (1996). Advantages and disadvantages of using artificial neural networks versus logistic regression for predicting medical outcomes. Journal of clinical epidemiology, 49(11), 1225-1231.
[4]. Myles, A. J., Feudale, R. N., Liu, Y., Woody, N. A., & Brown, S. D. (2004). An introduction to decision tree modeling. Journal of Chemometrics: A Journal of the Chemometrics Society, 18(6), 275-285.
[5]. Mahesh, B. (2020). Machine learning algorithms-a review. International Journal of Science and Research (IJSR). [Internet], 9(1), 381-386.
[6]. Ho, T. K. (1995, August). Random decision forests. In Proceedings of 3rd international conference on document analysis and recognition (Vol. 1, pp. 278-282). IEEE.
[7]. Imandoust, S. B., & Bolandraftar, M. (2013). Application of k-nearest neighbor (knn) approach for predicting economic events: Theoretical background. International journal of engineering research and applications, 3(5), 605-610.
[8]. Srivastava, P. R., & Eachempati, P. (2021). Intelligent employee retention system for attrition rate analysis and churn prediction: An ensemble machine learning and multi-criteria decision-making approach. Journal of Global Information Management (JGIM), 29(6), 1-29.
[9]. Frye, A., Boomhower, C., Smith, M., Vitovsky, L., & Fabricant, S. (2018). Employee attrition: what makes an employee quit?. SMU Data Science Review, 1(1), 9.
[10]. Fallucchi, F., Coladangelo, M., Giuliano, R., & William De Luca, E. (2020). Predicting employee attrition using machine learning techniques. Computers, 9(4), 86.
[11]. Jain, P. K., Jain, M., & Pamula, R. (2020). Explaining and predicting employees’ attrition: a machine learning approach. SN Applied Sciences, 2(4), 757.
[12]. Jain, R., & Nayyar, A. (2018, November). Predicting employee attrition using xgboost machine learning approach. In 2018 international conference on system modeling & advancement in research trends (smart) (pp. 113-120). IEEE.
[13]. Conte, J. M., Heffner, T. S., Roesch, S. C., & Aasen, B. (2017). A person-centric investigation of personality types, job performance, and attrition. Personality and Individual Differences, 104, 554-559.
[14]. Buckland, M., & Gey, F. (1994). The relationship between recall and precision. Journal of the American society for information science, 45(1), 12-19.
Cite this article
Yu,P.;Gao,Y.;Fan,Y. (2025). Predicting Employee Attrition with Big Five Personality Involved Using Machine Learning. Advances in Economics, Management and Political Sciences,215,20-29.
Data availability
The datasets used and/or analyzed during the current study will be available from the authors upon reasonable request.
Disclaimer/Publisher's Note
The statements, opinions and data contained in all publications are solely those of the individual author(s) and contributor(s) and not of EWA Publishing and/or the editor(s). EWA Publishing and/or the editor(s) disclaim responsibility for any injury to people or property resulting from any ideas, methods, instructions or products referred to in the content.
About volume
Volume title: Proceedings of the 4th International Conference on Financial Technology and Business Analysis
© 2024 by the author(s). Licensee EWA Publishing, Oxford, UK. This article is an open access article distributed under the terms and
conditions of the Creative Commons Attribution (CC BY) license. Authors who
publish this series agree to the following terms:
1. Authors retain copyright and grant the series right of first publication with the work simultaneously licensed under a Creative Commons
Attribution License that allows others to share the work with an acknowledgment of the work's authorship and initial publication in this
series.
2. Authors are able to enter into separate, additional contractual arrangements for the non-exclusive distribution of the series's published
version of the work (e.g., post it to an institutional repository or publish it in a book), with an acknowledgment of its initial
publication in this series.
3. Authors are permitted and encouraged to post their work online (e.g., in institutional repositories or on their website) prior to and
during the submission process, as it can lead to productive exchanges, as well as earlier and greater citation of published work (See
Open access policy for details).
References
[1]. Alao, D. A. B. A., & Adeyemo, A. B. (2013). Analyzing employee attrition using decision tree algorithms. Computing, Information Systems, Development Informatics and Allied Research Journal, 4(1), 17-28.
[2]. Tolles, J., & Meurer, W. J. (2016). Logistic regression: relating patient characteristics to outcomes. Jama, 316(5), 533-534.
[3]. Tu, J. V. (1996). Advantages and disadvantages of using artificial neural networks versus logistic regression for predicting medical outcomes. Journal of clinical epidemiology, 49(11), 1225-1231.
[4]. Myles, A. J., Feudale, R. N., Liu, Y., Woody, N. A., & Brown, S. D. (2004). An introduction to decision tree modeling. Journal of Chemometrics: A Journal of the Chemometrics Society, 18(6), 275-285.
[5]. Mahesh, B. (2020). Machine learning algorithms-a review. International Journal of Science and Research (IJSR). [Internet], 9(1), 381-386.
[6]. Ho, T. K. (1995, August). Random decision forests. In Proceedings of 3rd international conference on document analysis and recognition (Vol. 1, pp. 278-282). IEEE.
[7]. Imandoust, S. B., & Bolandraftar, M. (2013). Application of k-nearest neighbor (knn) approach for predicting economic events: Theoretical background. International journal of engineering research and applications, 3(5), 605-610.
[8]. Srivastava, P. R., & Eachempati, P. (2021). Intelligent employee retention system for attrition rate analysis and churn prediction: An ensemble machine learning and multi-criteria decision-making approach. Journal of Global Information Management (JGIM), 29(6), 1-29.
[9]. Frye, A., Boomhower, C., Smith, M., Vitovsky, L., & Fabricant, S. (2018). Employee attrition: what makes an employee quit?. SMU Data Science Review, 1(1), 9.
[10]. Fallucchi, F., Coladangelo, M., Giuliano, R., & William De Luca, E. (2020). Predicting employee attrition using machine learning techniques. Computers, 9(4), 86.
[11]. Jain, P. K., Jain, M., & Pamula, R. (2020). Explaining and predicting employees’ attrition: a machine learning approach. SN Applied Sciences, 2(4), 757.
[12]. Jain, R., & Nayyar, A. (2018, November). Predicting employee attrition using xgboost machine learning approach. In 2018 international conference on system modeling & advancement in research trends (smart) (pp. 113-120). IEEE.
[13]. Conte, J. M., Heffner, T. S., Roesch, S. C., & Aasen, B. (2017). A person-centric investigation of personality types, job performance, and attrition. Personality and Individual Differences, 104, 554-559.
[14]. Buckland, M., & Gey, F. (1994). The relationship between recall and precision. Journal of the American society for information science, 45(1), 12-19.