


1. Introduction
In the digital economy, customer loyalty on e-commerce platforms has emerged as a critical driver of sustainable business growth. Amid intensifying online retail competition, platforms contend with high customer acquisition costs and significant churn risks—empirical evidence suggests average e-commerce churn rates range between 20% and 30% [1]. Conversely, loyal customers demonstrate substantially greater value, generating 5 to 10 times the lifetime value of new patrons [2]. Consequently, accurately predicting and enhancing customer loyalty represents a crucial challenge for optimizing marketing resource allocation and overall profitability.
Existing literature establishes that loyalty is influenced by multiple behavioral factors, with purchase frequency and shopping satisfaction identified as core mediating variables directly driving loyalty [3, 4]. However, systematically identifying the underlying behavioral traits that affect purchase frequency, shopping satisfaction, or simultaneously affect both—thereby indirectly strengthening loyalty—remains an underexplored area. Addressing this theoretical gap is the primary aim of this study, which seeks to answer the following research question: Which customer behaviors indirectly determine platform loyalty by affecting purchase frequency and shopping satisfaction, or simultaneously influence both? To address this question, the study proposes two key hypotheses. First, specific behavioral traits—such as browsing frequency and personalized recommendation frequency—exert a statistically significant positive influence on purchase frequency, shopping satisfaction, or both. Second, the positive effect of key customer behaviors on platform loyalty is sequentially mediated through increased purchase frequency and enhanced shopping satisfaction.
Addressing this gap carries significant practical implications. Firstly, revealing key pre-loyalty behaviors facilitates the optimization of platform strategies through the development of targeted retention mechanisms, such as refining recommendation systems and creating alternative product discovery methods. Secondly, the ability to predict loyalty through behavioral analytics enables the early identification of high-value users for intervention, thereby reducing acquisition costs by minimizing inefficient marketing expenditure [5]. Methodologically, machine learning is leveraged to analyze an Amazon customer behavior dataset (featuring eight core variables, including age, browsing frequency, and personalized recommendation frequency). Ensemble tree models (XGBoost, Gradient Boosting, AdaBoost) are employed to develop a loyalty prediction framework, evaluated using metrics such as F1-score, recall, and precision. A key analytical phase involves identifying behavioral variables with the highest predictive contribution to loyalty. Ultimately, the study reveals eight key behaviors (e.g., Cart Addition Browsing, Personalized Recommendation Frequency, Importance of Customer Reviews, Recommendation Accuracy) as central loyalty predictors, providing actionable insights for platform optimization.
2. Literature review
The rapid evolution of internet technologies has fundamentally reshaped consumer expectations within the e-commerce sector, leading to heightened demands for more personalized, efficient, and trustworthy online experiences. As a result, cultivating customer loyalty has emerged as a critical and enduring concern for both scholars and practitioners [6-9]. Customer loyalty, broadly defined as a consumer’s sustained preference for and commitment to a particular platform, is typically evidenced through repeated transactions and continued engagement [10]. This loyalty is often attributed to favorable customer experiences, satisfaction with product or service offerings, and trust in the platform's reliability [11-12].
Existing research shows that personalization allows services provided by platforms to be customized on the basis of individual user preferences, thereby increasing participation, customer satisfaction, and loyalty. It is considered to play a central role [13-14].In addition, an empirical study conducted by 50 Internet buyers revealed that the main factors of customer satisfaction and loyalty are the quality of electronic services, in particular the ability to respond to services, compensation for service failures, and the quality of services on the website. Easy to use, stress the importance of information security [15]. These results have been confirmed in various industries, including online retailers and digital tourism [16-17].
Furthermore, researchers have discovered that by providing user-centered content as a mechanism to enhance satisfaction and loyalty, especially when searching for the desired products, satisfaction and loyalty can be improved by minimizing consumers' cognitive and time costs to the greatest extent. It emphasizes the importance of rationalized experiences [18]. Recent studies have shown that personalized marketing strategies have great potential to cultivate long-term customer commitment if they are based on profound insights into consumers [19]. This series of studies reveals the multifaceted nature of e-commerce loyalty formation and highlights some methods for enterprises to strengthen customer retention in the increasingly competitive digital market.
Beyond service quality and personalization, recent studies have increasingly highlighted the predictive value of consumer behaviors and perceptions in shaping loyalty outcomes. For instance, the perceived importance of online customer reviews has been shown to influence not only initial purchase decisions but also long-term trust and platform commitment, as reviews serve as credible, user-generated cues in environments marked by information asymmetry [23,25]. Additionally, behavioral signals such as browsing frequency and cart-addition behavior—often interpreted as proxies for user engagement—have been linked to elevated purchase intent and repeated platform use [24]. Another factor that contributes to consumer retention is product assortment: platforms offering a broader range of items are more likely to satisfy heterogeneous needs, thereby increasing perceived value and encouraging return visits [26].
Recent research increasingly utilizes advanced machine learning techniques to model and predict customer loyalty in the e-commerce environment based on the availability of digital behavior data. For example, a workflow uses a deep neural network trained on Twitter data to measure and predict user-specific loyalty and represent consumer commitment to social activities. The feasibility of the signal is demonstrated [20]. In this regard, researchers have achieved a model based on XGBoost, which includes behavioral attributes to predict users' confidence in and long-term participation on e-commerce platforms [21]. Similarly, another study analyzed behavioral patterns on an e-commerce shopping guide platform, particularly focusing on revealing the driving forces of continuous social interaction among users. Pragmatism [22]. These data-driven methods highlight the potential of machine learning to improve the predictive accuracy and theoretical understanding of the underlying mechanisms for enhancing digital consumer loyalty. However, previous studies reflect the limitation of focusing on either service quality or personalization in isolation. Few of them systematically explore the predictive power of different behavioral and perceptual factors on e-commerce loyalty. To address this gap, the present study examines which consumer behaviors and perceptions most strongly influence loyalty (measured through purchase frequency and shopping satisfaction) using machine learning models.
3. Methodology
This study adopts a quantitative research approach to investigate the factors influencing customer loyalty on e-commerce platforms. Using a publicly available dataset from Amazon, this study built predictive models to examine two key aspects of loyalty: purchase frequency and shopping satisfaction. The methodology consists of several stages, including data collection and description, data preprocessing, EDA and modeling. Multiple machine learning algorithms were employed to compare performance and identify the most influential predictors of customer loyalty.
3.1. Data collection and description
The dataset offers a general overview of Amazon customer behavior through various attributes, providing detailed insights into shopping habits and preferences. In particular, the dataset captures the following key attributes:
• Age: The age of the customer serves as a fundamental demographic factor. Age can significantly influence purchasing patterns, as different age groups often exhibit different product preferences, spending capacities, and shopping frequencies.
• Browsing Frequency: How often the customer browses the Amazon platform. Possible responses include Rarely, A few times a month, A few times a week, and Multiple times a day. This attribute reflects the level of customer engagement and potential purchasing incentive, since frequent browsing may indicate a high interest in products.
• Personalized Recommendation Frequency: How often the customer receives personalized product recommendations from Amazon. This is typically rated from 1 to 5, and higher values indicating more frequent recommendation exposure. A high value implies that Amazon’s system regularly provides the user with suitable product suggestions, reflecting the intensity of the platform’s personalization efforts for that user.
• Importance of Customer Reviews (Customer Reviews Importance): The significance of customer reviews in the user’s decision-making process, rated on a scale from 1 (not important) to 5 (very important). A higher rating means the customer heavily relies on other buyers’ reviews when considering purchasing, underscoring the influence of peer feedback on their shopping decisions.
• Recommendation Accuracy (Relevance)(Rating Accuracy): A self-reported rating of how relevant and accurate the personalized recommendations are, from 1 to 5. Higher scores demonstrate that the customer finds that Amazon’s recommended products closely match their interests and needs, which suggests effective alignment of the recommendation algorithms with the customer’s preferences.
• Search Method Other (Product Search Method_others): This attribute captures non-standard search approaches (e.g., voice search, image recognition, or external links) beyond filters/keywords/categories. Identifying these methods uncovers new user behaviors and chances to innovate Amazon's search infrastructure.
• Service Appreciation Selection (Service Appreciation_Wide product selection): Measures customer valuation of Amazon’s extensive product diversity. High appreciation signals that variety is a key loyalty driver, emphasizing the need to maintain a broad inventory and enhance discoverable algorithms to serve diverse demand.
• Cart Addition Browsing (Add to Cart Browsing_Yes): This binary attribute captures whether customers add products to their shopping cart while browsing Amazon's platform:(a)True: Indicates active engagement and purchase consideration during browsing sessions;(b)False: Reflects passive browsing behavior without immediate purchase intent.
Each of these attributes develops unique insights, and they provide a holistic view of Amazon customer behavior jointly. By integrating demographic information, browsing and purchasing behavior, and attitudinal measures (like opinions on reviews and recommendations), the dataset enables in-depth analysis of purchasing patterns, the factors influencing customer decisions, and potential opportunities for improving the online shopping experience.
3.2. Data preprocessing
Before feeding the data into machine learning models, several essential preprocessing steps are made to ensure data quality and model performance:
Removing Specific Values: During the data preprocessing stage, certain features were removed from both models to enhance interpretability and reduce noise. To be specific, the variable Timestamp was removed because of its lack of analytical significance in relation to customer behavior. In addition, Purchase Categories was excluded due to its high cardinality, which could negatively affect model performance without offering proportional predictive value.
Handling Missing Values: To address missing values in the dataset, median imputation was applied. For each feature with missing data, the median value was calculated to replace the missing data. This approach is effective for fixing outliers and preserving the overall distribution of the variable.
Encoding Categorical Variables: Purchase frequency was measured on a five-level categorical scale, and shopping satisfaction was rated on a 1–5 scale. For analysis, both variables were recoded into binary form, with 0 representing low frequency and satisfaction(rated 1-3), and 1 representing high frequency and satisfaction(rated 4-5). Other categorical variables, such as Search Method Other, Service Appreciation Selection, and Browsing Frequency, are converted into numerical representations using one-hot encoding. This transformation allows machine learning algorithms to understand and process these features effectively.
Class Imbalance Handling: Class imbalance was fixed using the Synthetic Minority Over-sampling Technique (SMOTE). This method generates synthetic samples for the minority class by reconstructing between existing instances, aiming to balance the class distribution in the training set. SMOTE was applied separately to each model before training, ensuring that the classifiers were not biased toward the majority class. This step was crucial, particularly for targeted variables where the positive class was underrepresented, such as in the Consumer Satisfaction model and Purchase Frequency model.
3.3. Exploratory Data Analysis (EDA)
EDA is undertaken to reveal underlying trends, anomalies, and potential relationships between variables, thus ensuring an understanding of the data's inherent structure and providing valuable guidance for informed decisions about model selection and building.
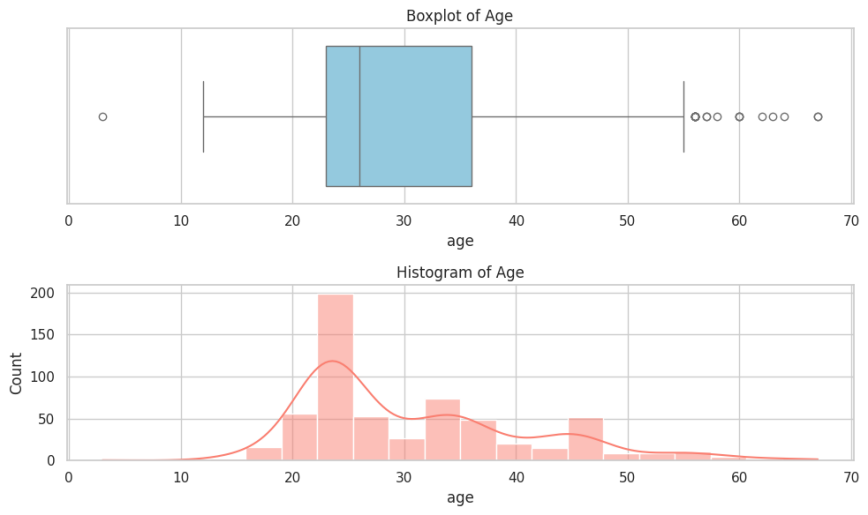
Based on the provided boxplot and histogram of the Age variable (Figure 1), the distribution exhibits a positive-skewed pattern, indicating that the majority of Amazon customers in this dataset fall within younger age brackets. The histogram reveals a concentration of users primarily between their 20s and 30s. The boxplot further confirms this skewness by showing a median age probably in the early 30s. This aligns with the demographic’s role as a key behavioral predictor, reflecting younger users' dominance in e-commerce engagement and their distinct purchasing patterns.
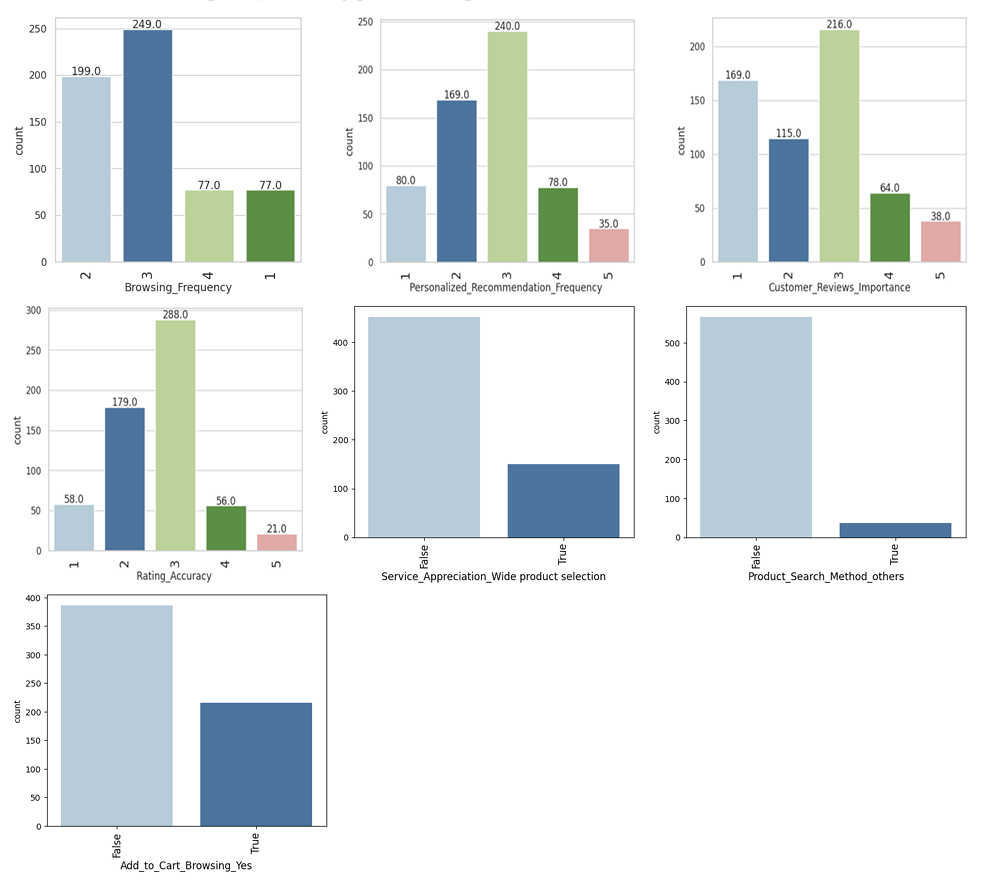
Based on the Distribution Profiles of Key Behavioral Variables (Figure 2), Cart Addition Browsing reveals a near-balanced split, with 249 customers actively adding items to carts (indicating high purchase intent) versus 199 passive browsers, underscoring its critical role as a behavioral intent signal identified in feature importance analysis. Personalized Recommendation Frequency exhibits that 240 users report high exposure (ratings 4-5), confirming intensive algorithmic personalization efforts aligned with its predictive significance for both purchase frequency and satisfaction. Other variables show distinct patterns, validating key behavioral segments, with cart activity and recommendation frequency holding particular operational relevance.
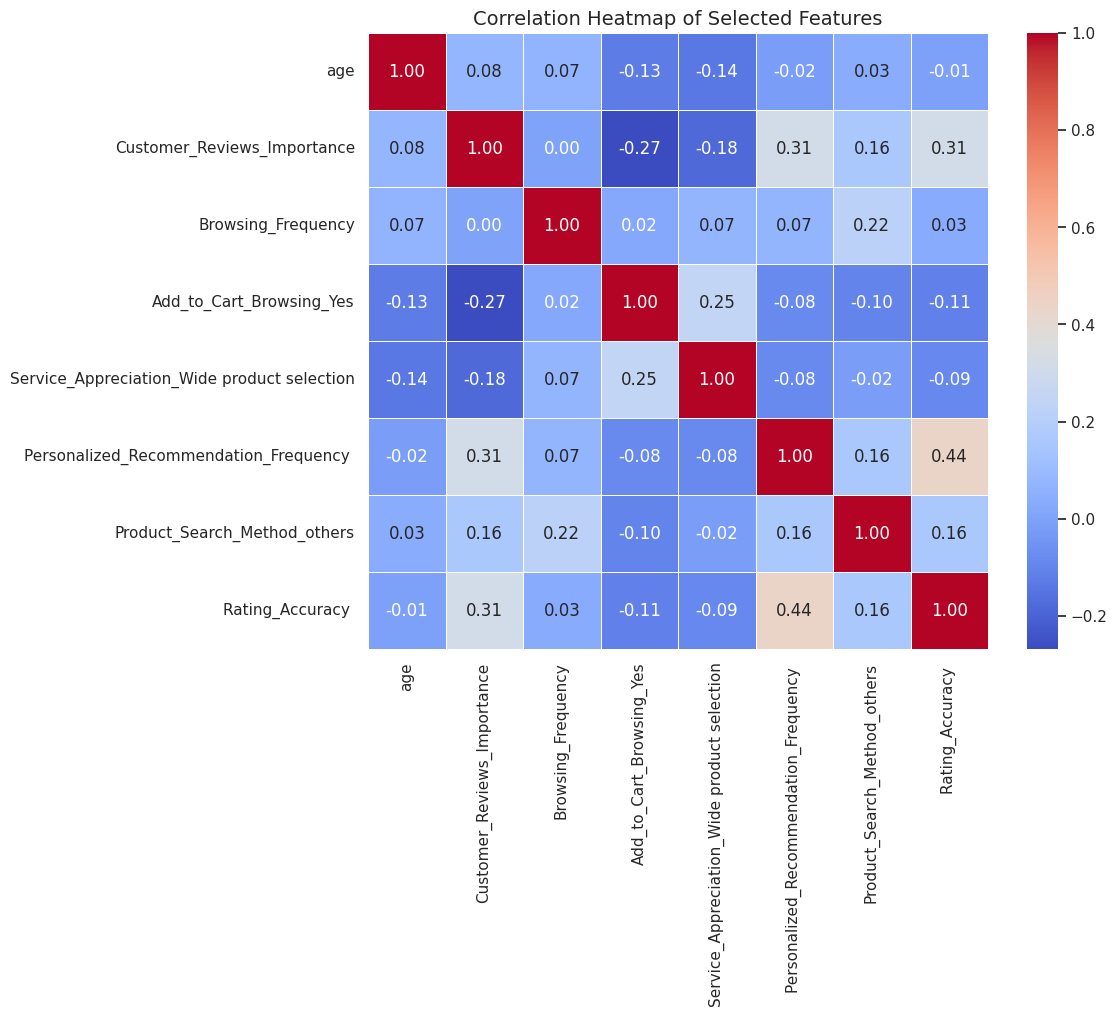
The correlation heatmap (Figure 3) reveals complex interrelationships among eight key behavioral variables influencing Amazon loyalty metrics. Some notable correlations warrant specific attention. For instance, Personalized Recommendation Frequency exhibits a positive correlation with Rating Accuracy (r=0.44), indicating that users receiving frequent recommendations perceive them as more relevant, validating algorithmic personalization efficacy. Moreover, a negative correlation exists between Customer Reviews Importance and Service Appreciation (r=–0.18), suggesting that customers prioritizing peer reviews derive less value from broad product assortments, potentially due to decision fatigue or preference for validated options.
3.4. Modeling and evaluating metrics
To ensure robust and comprehensive modeling of customer loyalty behaviors, this study employed a diverse set of classification algorithms, including Decision Tree, Random Forest, AdaBoost, Gradient Boosting, and XGBoost. To evaluate model performance and generalizability, the dataset was randomly split into a training set (70%) and a testing set (30%) using stratified sampling to maintain class distributions. All models were trained on the training set and evaluated on the testing set. Model performance was evaluated using several classification metrics, including accuracy, precision, recall, F1-score, and area under the ROC curve (AUC), providing a comprehensive assessment of predictive performance. Among all evaluation metrics, F1-score was prioritized as the primary performance indicator. Because F1-score balances precision and recall, making it particularly suitable for evaluating how well the model identifies both loyal and disloyal customers. The primary objective of this study is to examine the factors driving customer loyalty, and it is crucial to minimize both false positives (misclassifying disloyal customers as loyal) and false negatives (failing to detect loyal customers). By optimizing for F1-score, this study aims to build models that perform well in real-world applications and reduce poor business decisions caused by both types of misclassifications. Threshold optimization was performed for some selected models (AdaBoost, Gradient Boosting, and XGBoost) by identifying the threshold that yielded the best F1-score on the validation set.
3.5. Features importance analysis
To better understand the drivers of customer loyalty, the study conducted a feature importance analysis using AdaBoost, Gradient Boosting, and XGBoost, which inherently provide measures of feature relevance. For AdaBoost and Gradient Boosting, feature importance was calculated based on the total reduction of Gini impurity across all splits involving the feature. For XGBoost, the importance reflected the number of times a feature was used in tree splits, which serves as a proxy for its relevance to the model’s predictive capability.
4. Result
4.1. Model performance on purchase frequency
As illustrated in Table 1, among all models, XGBoost outperformed the other models across nearly all metrics. It achieved the highest F1-score (0.769), indicating a balance between precision (0.789) and recall (0.750). In addition, its accuracy reached 0.926, and its ROC AUC score of 0.937 reflects a strong ability to distinguish between customers with different purchasing behaviors. While Gradient Boosting showed a slightly better recall, its overall effectiveness was lower. Comparatively, XGBoost is the most robust and consistent model for this prediction task.
|
Model |
Accuracy |
Precision |
Recall |
F1-score |
ROC AUC |
|
Decision Tree |
0.696 |
0.558 |
0.400 |
0.466 |
0.621 |
|
Random Forest |
0.691 |
0.750 |
0.100 |
0.176 |
0.757 |
|
AdaBoost |
0.876 |
0.692 |
0.450 |
0.545 |
0.787 |
|
Gradient Boosting |
0.860 |
0.548 |
0.850 |
0.667 |
0.914 |
|
XGBoost |
0.926 |
0.789 |
0.750 |
0.769 |
0.937 |
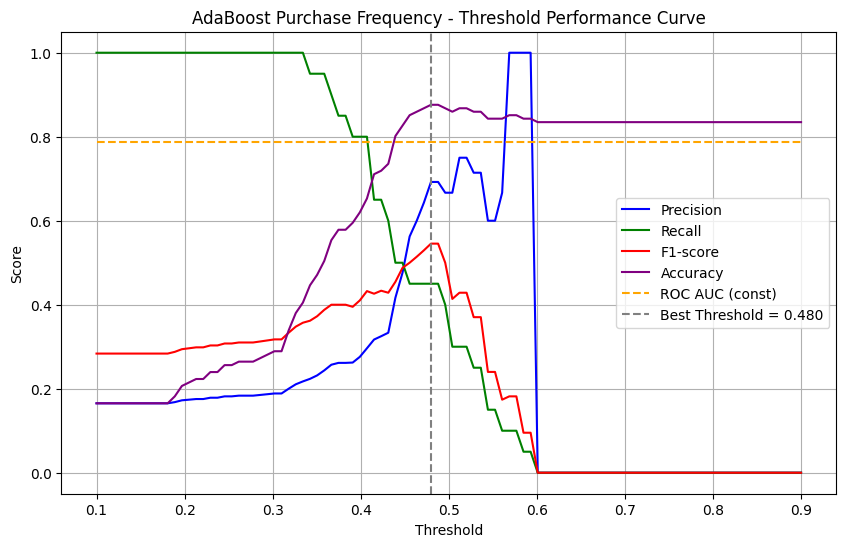
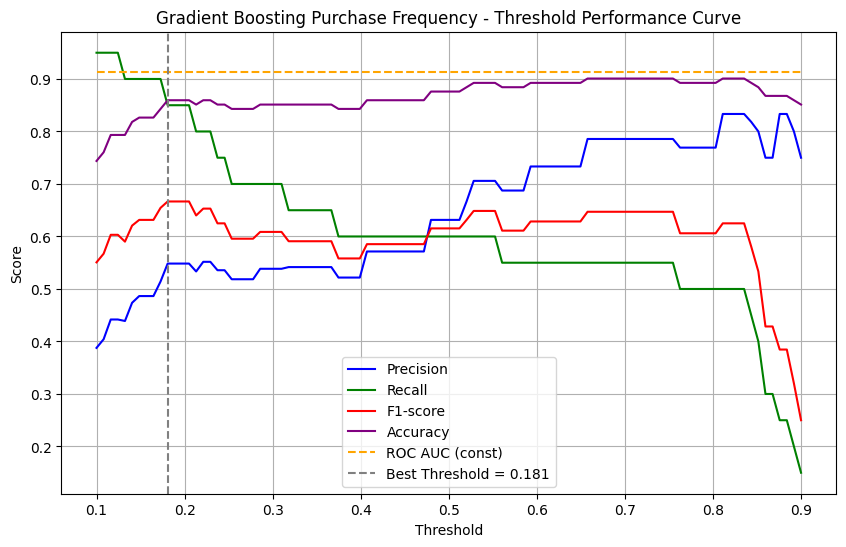
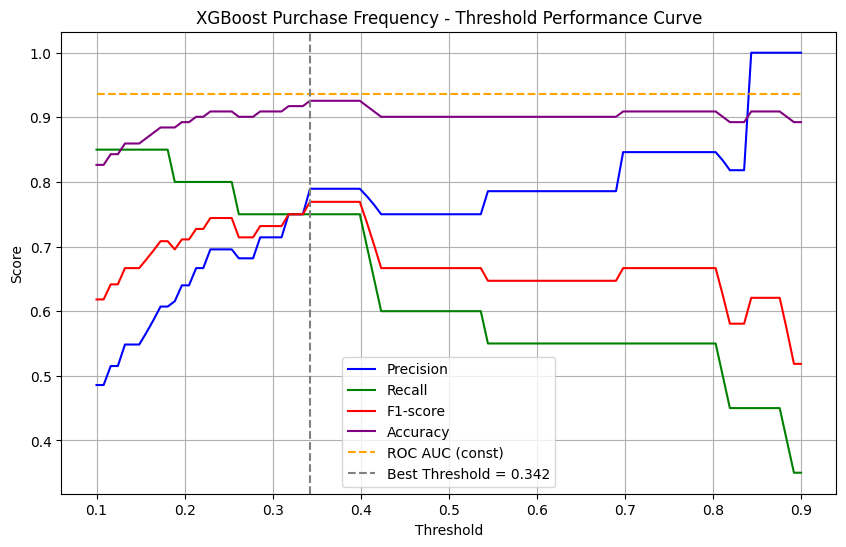
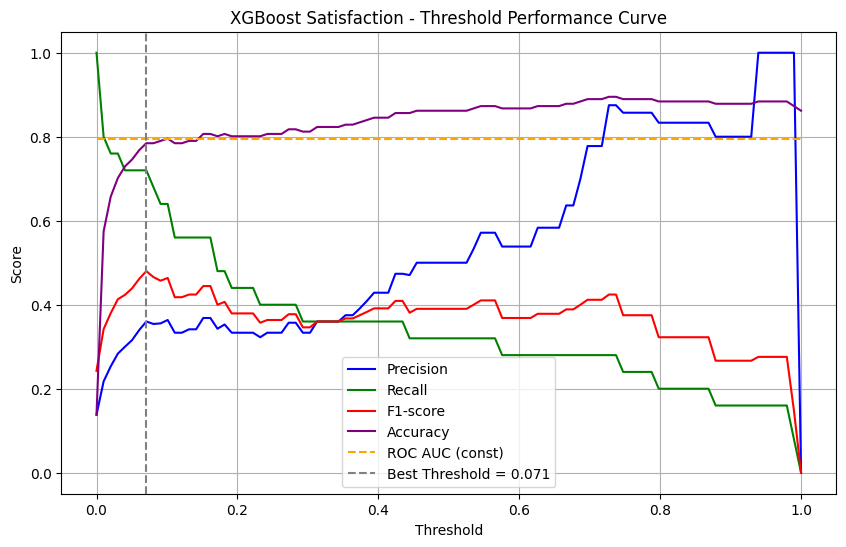
To further evaluate the performance of the Boosting models (AdaBoost, Gradient Boosting, and XGBoost), the study conducted threshold tuning by plotting F1-score curves and those of other metrics across a range of classification thresholds, allowing observation of dynamic relationships between testing metrics.
Figures 4-6 below display the relationships between the five metrics when predicting Purchase Frequency. In each model, the threshold that yielded the highest F1-score was selected as the best cutoff point for classifying loyal and disloyal customers.
4.2. Model performance on consumer satisfaction
According to Table 2, among the five models evaluated for predicting consumer Shopping Satisfaction, AdaBoost was the most balanced and effective model. It achieved the highest F1-score (0.500), indicating a well-balanced tradeoff between precision (0.522) and recall (0.480). Additionally, it recorded the highest accuracy (0.867) and a strong ROC AUC score (0.796), suggesting that it not only made accurate predictions but also effectively identified satisfied and dissatisfied customers. Although XGBoost and Gradient Boosting showed competitive recall and AUC scores, their overall F1-scores were slightly lower, making AdaBoost the most suitable model for this task.
|
Model |
Accuracy |
Precision |
Recall |
F1-score |
ROC AUC |
|
Decision Tree |
0.785 |
0.344 |
0.379 |
0.361 |
0.621 |
|
Random Forest |
0.865 |
0.800 |
0.138 |
0.235 |
0.754 |
|
AdaBoost |
0.867 |
0.522 |
0.480 |
0.500 |
0.796 |
|
Gradient Boosting |
0.818 |
0.395 |
0.600 |
0.476 |
0.766 |
|
XGBoost |
0.785 |
0.360 |
0.720 |
0.480 |
0.794 |
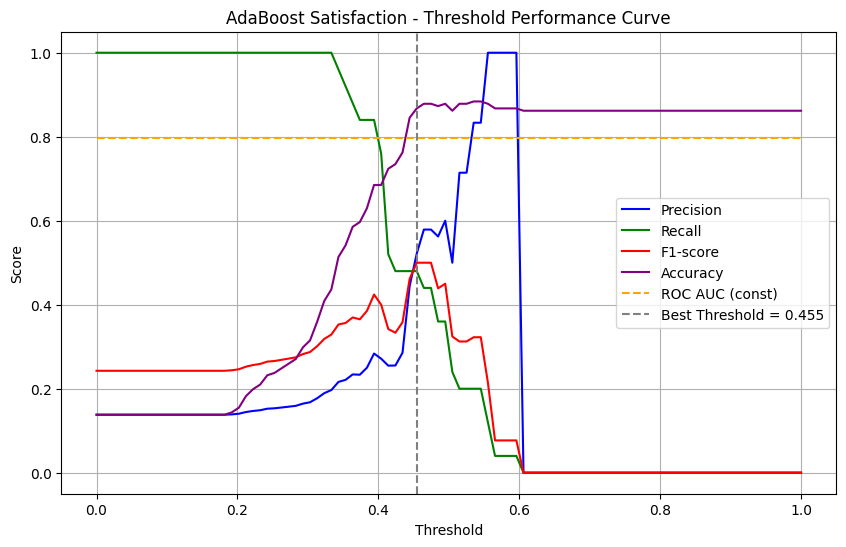
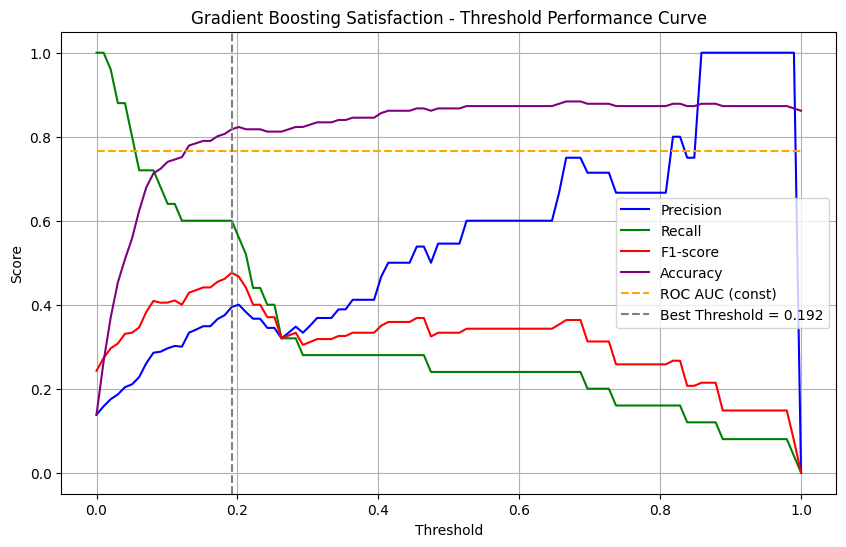
Figures 7-9 below display the relationship between the five metrics for each model when predicting shopping satisfaction.
4.3. Feature importance analysis result
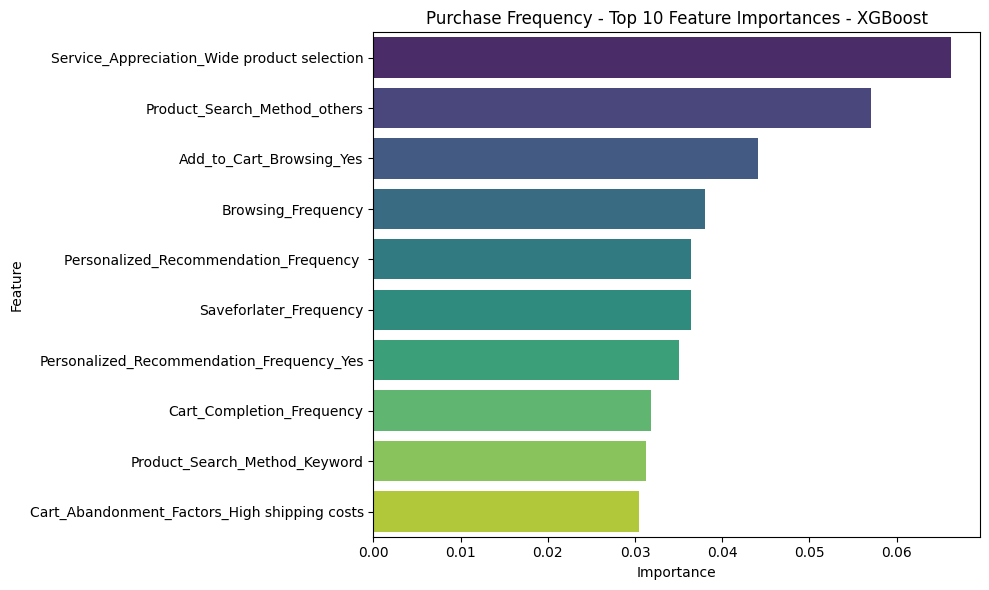
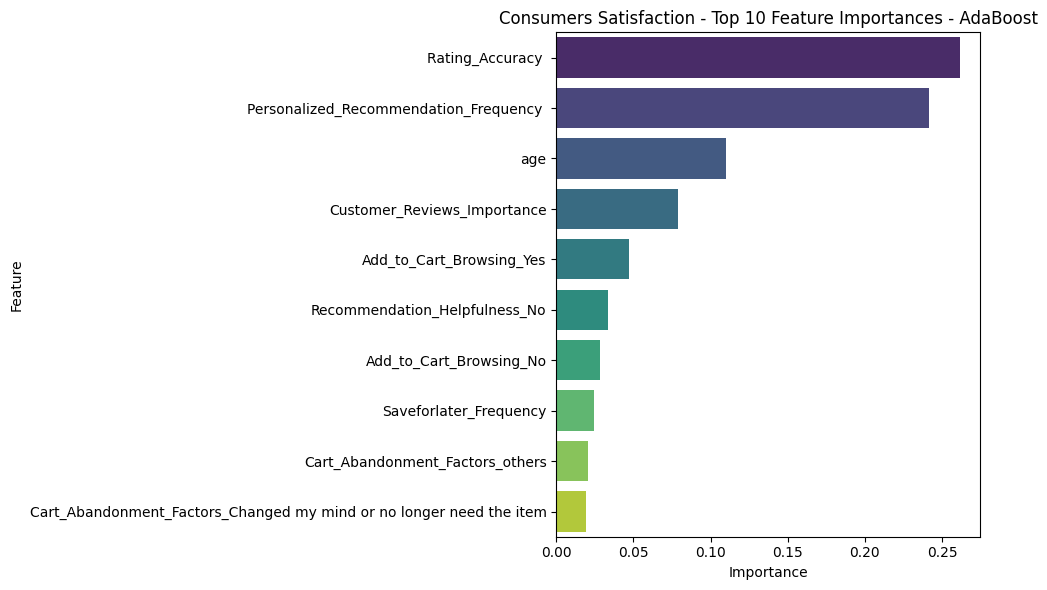
To gain insight into the motivations of customer loyalty, the study conducted a feature importance analysis on the top-performing models: XGBoost when predicting purchase frequency and AdaBoost when predicting shopping satisfaction. These ensemble boosting models performed relatively well and showed no signs of severe overfitting in training. Specifically, Figure 10 illustrates the top 10 most important features identified by the XGBoost model, the best-performing model, when predicting customers’ purchase frequency. To explore the most important factors that affect customers’ purchase frequency, the study focuses on the top 5 features--Rating Accuracy, Personalized Recommendation Frequency, age, Customer Reviews Importance, and Add to Cart Browsing-Yes. Figure 11 exhibits important features affecting customers’ Shopping Satisfaction in AdaBoost. Similarly, the top 5 features (Service Appreciation-Wide product selection, Product Search Method -others, Add to Cart Browsing-Yes, Browsing Frequency, and Personalized Recommendation Frequency) are given serious attention.
5. Discussion & conclusion
In the digital economy, accurately predicting e-commerce loyalty remains crucial for sustainable growth amid high churn rates [1] and the disproportionate value of loyal customers [2]. This study bridges a critical theoretical gap by systematically identifying eight core customer behaviors—including Recommendation Accuracy, Cart Addition Browsing, and Importance of Customer Reviews—that indirectly strengthen platform loyalty through enhanced Purchase Frequency and Shopping Satisfaction. Leveraging ensemble machine learning models (XGBoost, AdaBoost, Gradient Boosting), the analysis established Cart Addition Browsing and Personalized Recommendation Frequency as the most influential predictors for both mediators, underscoring their centrality in loyalty formation.
The findings extend prior literature across four interconnected dimensions. First, regarding Personalization Efficacy, algorithmic accuracy directly accelerates purchases and raises satisfaction by reducing decision friction [13]. Second, in terms of Behavioral Intent Signals, cart additions function as micro-conversions predictive of macro-conversions and affective loyalty [24]. Third, the role of Social Proof Dynamics is confirmed, wherein review diagnostics mitigates information asymmetry to foster trust [23]. Fourth, Discovery Flexibility emerges as critical, with non-standard search methods stimulating purchases by lowering cognitive load [27, 28]. Methodologically, this study demonstrates ensemble trees’ superiority over traditional SEM approaches in modeling high-dimensional behavioral data [16, 21].
These insights translate to actionable business strategies. Organizations should prioritize refining their personalization engines to simultaneously increase recommendation frequency and accuracy, as these interconnected features emerged as dominant predictors across both key loyalty mediators; this necessitates deploying advanced ensemble algorithms akin to XGBoost for continuous optimization, leveraging real-time behavioral data to ensure suggestions align dynamically with evolving customer preferences across different age cohorts. Concurrently, platforms must capitalize on behavioral intent signals by implementing targeted interventions when users exhibit "Add to Cart Browsing" behavior – a robust predictor for both purchase frequency and satisfaction – such as offering time-sensitive incentives or streamlined checkout pathways to convert high-intent browsing sessions into transactions, thereby transforming micro-conversions into macro-conversions. Furthermore, the significant influence of Service Appreciation for Wide Product Selection and non-standard Search Methods on satisfaction underscores the imperative to enhance discovery infrastructure, including investments in voice/image search capabilities and AI-driven curation tools that intelligently navigate extensive inventories to reduce cognitive load and surface hyper-relevant products, particularly for users expressing high valuation of variety. To leverage Social Proof Dynamics, platforms should strategically surface contextual review snippets during high-friction decision points, given the critical role of Customer Reviews Importance in purchase frequency predictions, while ensuring review visibility complements rather than overwhelms personalized recommendations. These integrated interventions – algorithm refinement, intent-based engagement, discovery innovation, and contextual social proof – collectively form a systemic loyalty architecture where operational enhancements directly address the identified behavioral drivers, enabling organizations to transform analytical insights into sustainable competitive advantage while continuously monitoring for unintended consequences like recommendation bias or incentive dependency through the robust model evaluation frameworks demonstrated in this study.
However, several limitations warrant acknowledgment. The reliance on Amazon data may constrain generalizability to niche platforms such as luxury goods marketplaces. Additionally, the cross-sectional design cannot capture loyalty evolution over time, necessitating longitudinal tracking for causal inference. Unexplored psychological factors like brand attachment and cultural variables may further modulate observed behavioral effects. The data set also contains bias, with the age distribution concentrated around 20-30-year-olds, lacking observation of older customers. Therefore, future research should validate this framework across diverse sectors, including travel and C2C marketplaces, while employing longitudinal designs to trace behavioral trajectories. Integrating psychometric scales with behavioral analytics would quantify emotional drivers, and exploring cultural moderators would enhance the explanatory power of this indirect loyalty framework. Relative research should also study customers with a wide range of age distribution in order to gain a more diverse understanding and increase the generalizability of customer loyalty.
Acknowledgement
Yuhan Yan and Yiwen Zheng contributed equally to this work and should be considered co-first authors.
References
[1]. Statista. (2024). *Global E-commerce Customer Churn Rate Report 2024*. Hamburg: Statista GmbH.
[2]. Reichheld, F. F., & Schefter, P. (2000). E-loyalty: your secret weapon on the web. Harvard business review, 78(4), 105-113.
[3]. Chiu, C.-M., Wang, E. T. G., Fang, Y.-H., & Huang, H.-Y. (2014). Understanding customers’ repeat purchase intentions in B2C e-commerce: the roles of utilitarian value, hedonic value and perceived risk. Information Systems Journal, 24(1), 85–114. https: //doi.org/10.1111/j.1365-2575.2012.00407.x
[4]. Oliver, R. L. (1999). Whence Consumer Loyalty? Journal of Marketing, 63(4), 33–44.
[5]. Kumar, V., Bhaskaran, V., Mirchandani, R., & Shah, M. (2013). Practice Prize Winner—Creating a Measurable Social Media Marketing Strategy: Increasing the Value and ROI of Intangibles and Tangibles for Hokey Pokey. Marketing Science, 32(2), 194–212. https: //doi.org/10.1287/mksc.1120.0768
[6]. Ren, H., & Luo, Z. (2024). Decisions and Coordination of E-Commerce Supply Chain Considering Product Quality and Marketing Efforts under Different Power Structures. Sustainability, 16(13), 5536. https: //doi.org/10.3390/su16135536
[7]. Pei, Y., Xue, W., Yang, Y., Li, D., & Li, Y. (2019). The Impacts of user experience on user loyalty based on O2O innovation platform. Journal of Electronic Commerce in Organizations (JECO), 17(2), 79-87.
[8]. Handarkho, Y. D. (2020). The factors influencing customer loyalty in social commerce platform: variety-seeking and social impact perspective. International Journal of Web Information Systems, 16(4), 369-386.
[9]. Cheng, R. (2021, January). Research on Marketing Model of Social E-commerce Based on Customer Loyalty. In the 6th Annual International Conference on Social Science and Contemporary Humanity Development (SSCHD 2020) (pp. 590-595). Atlantis Press.
[10]. Duan, X., Chen, C. N., & Shokouhifar, M. (2024). Impacts of social media Advertising on purchase intention and customer loyalty in e-commerce systems. ACM Transactions on Asian and Low-Resource Language Information Processing, 23(8), 1-15.
[11]. Esmeli, R., Can, A. S., Awad, A., & Bader-El-Den, M. (2025). Understanding customer loyalty-aware recommender systems in E-commerce: an analytical perspective. Electronic Commerce Research, 1-27.
[12]. Ghali, Z. (2021). Motives of customers’e-loyalty towards e-banking services: a study in Saudi Arabia. Journal of Decision Systems, 30(2-3), 172-193.
[13]. Nguyen, T. T., Maxwell Harper, F., Terveen, L., & Konstan, J. A. (2018). User personality and user satisfaction with recommender systems. Information Systems Frontiers, 20, 1173–1189.
[14]. Ting, O. S., Arif, M. S. M., Zakuan, N., Sulaiman, Z., & Saman, M. Z. M. (2016). E-service quality, e-satisfaction and e-loyalty of online shoppers in business to consumer market; evidence form malaysia. IOP Conference Series: Materials Science and Engineering, 131, 0120212.
[15]. Shafee, M. M., & Bazargan, N. A. (2018). Behavioral customer loyalty in online shopping: the role of e-service quality and e-recovery. Journal of Theoretical and Applied Electronic Commerce Research, 13(1), 26–38.
[16]. Rodríguez, P. G., Villarreal, R., Valiño, P. C., & Blozis, S. (2020). A pls-sem approach to understanding e-sq, e-satisfaction and e-loyalty for fashion e-retailers in Spain. Journal of Retailing and Consumer Services, 57, 102201.
[17]. Roger-Monzó, V., Martí-Sánchez, M., & Guijarro-García, M. (2015). Using online consumer loyalty to gain competitive advantage in travel agencies. Journal of Business Research, 68(7), 1638–1640.
[18]. Ghali, Z. (2024). Impact of socioeconomic status on customer e-loyalty under the moderating role of perceived self-efficacy. Journal of Decision Systems, 33(1), 53–78.
[19]. Hallikainen, H., Luongo, M., Dhir, A., & Laukkanen, T. (2022). Consequences of personalized product recommendations and price promotions in online grocery shopping. Journal of Retailing and Consumer Services, 69, 103088.
[20]. Urolagin, S., & Patel, S. (2023). User-specific loyalty measure and prediction using deep neural network from Twitter Data. IEEE Transactions on Computational Social Systems, 11(1), 1046-1061.
[21]. Zhou, X., Khaw, K., & Wu, Y. (2024, November). Prediction of user trust and long-term commitment in e-commerce platforms based on user behavior characteristics. In Proceedings of the 5th International Conference on Artificial Intelligence and Computer Engineering (pp. 123-127).
[22]. Ling, K., & Hu, C. (2024, August). Determinants of Sustained Social Interactions on E-commerce Shopping Guide Platforms: A Machine Learning Perspective. In 2024 5th International Conference on Education, Knowledge and Information Management (ICEKIM 2024) (pp. 528-538). Atlantis Press.
[23]. Mudambi, S. M., & Schuff, D. (2010). Research note: What makes a helpful online review? A study of customer reviews on Amazon. com. MIS quarterly, 185-200.
[24]. Moe, W. W. (2003). Buying, searching, or browsing: Differentiating between online shoppers using in-store navigational clickstream. Journal of consumer psychology, 13(1-2), 29-39.
[25]. Chevalier, J. A., & Mayzlin, D. (2006). The effect of word of mouth on sales: Online book reviews. Journal of marketing research, 43(3), 345-354.
[26]. Morales, A., Kahn, B. E., McAlister, L., & Broniarczyk, S. M. (2005). Perceptions of assortment variety: The effects of congruency between consumers’ internal and retailers’ external organization. Journal of Retailing, 81(2), 159-169.
[27]. Verhoef, P. C., Lemon, K. N., Parasuraman, A., Roggeveen, A., Tsiros, M., & Schlesinger, L. A. (2009). Customer experience creation: Determinants, dynamics and management strategies. Journal of retailing, 85(1), 31-41.
[28]. Chellaiah, Colin Crispin. (2024). SEARCH CONVENIENCE, PERCEIVED VALUE, AND PURCHASE INTENTION OF ONLINE CONSUMERS: AN EMPIRICAL METHOD. 8. 2021-149.
Cite this article
Yan,Y.;Zheng,Y.;Xing,Y.;Zhang,Z. (2025). Forecasting User Loyalty on E-commerce Platforms by Analyzing Behavior with Machine Learning. Advances in Economics, Management and Political Sciences,226,100-114.
Data availability
The datasets used and/or analyzed during the current study will be available from the authors upon reasonable request.
Disclaimer/Publisher's Note
The statements, opinions and data contained in all publications are solely those of the individual author(s) and contributor(s) and not of EWA Publishing and/or the editor(s). EWA Publishing and/or the editor(s) disclaim responsibility for any injury to people or property resulting from any ideas, methods, instructions or products referred to in the content.
About volume
Volume title: Proceedings of ICEMGD 2025 Symposium: Innovating in Management and Economic Development
© 2024 by the author(s). Licensee EWA Publishing, Oxford, UK. This article is an open access article distributed under the terms and
conditions of the Creative Commons Attribution (CC BY) license. Authors who
publish this series agree to the following terms:
1. Authors retain copyright and grant the series right of first publication with the work simultaneously licensed under a Creative Commons
Attribution License that allows others to share the work with an acknowledgment of the work's authorship and initial publication in this
series.
2. Authors are able to enter into separate, additional contractual arrangements for the non-exclusive distribution of the series's published
version of the work (e.g., post it to an institutional repository or publish it in a book), with an acknowledgment of its initial
publication in this series.
3. Authors are permitted and encouraged to post their work online (e.g., in institutional repositories or on their website) prior to and
during the submission process, as it can lead to productive exchanges, as well as earlier and greater citation of published work (See
Open access policy for details).
References
[1]. Statista. (2024). *Global E-commerce Customer Churn Rate Report 2024*. Hamburg: Statista GmbH.
[2]. Reichheld, F. F., & Schefter, P. (2000). E-loyalty: your secret weapon on the web. Harvard business review, 78(4), 105-113.
[3]. Chiu, C.-M., Wang, E. T. G., Fang, Y.-H., & Huang, H.-Y. (2014). Understanding customers’ repeat purchase intentions in B2C e-commerce: the roles of utilitarian value, hedonic value and perceived risk. Information Systems Journal, 24(1), 85–114. https: //doi.org/10.1111/j.1365-2575.2012.00407.x
[4]. Oliver, R. L. (1999). Whence Consumer Loyalty? Journal of Marketing, 63(4), 33–44.
[5]. Kumar, V., Bhaskaran, V., Mirchandani, R., & Shah, M. (2013). Practice Prize Winner—Creating a Measurable Social Media Marketing Strategy: Increasing the Value and ROI of Intangibles and Tangibles for Hokey Pokey. Marketing Science, 32(2), 194–212. https: //doi.org/10.1287/mksc.1120.0768
[6]. Ren, H., & Luo, Z. (2024). Decisions and Coordination of E-Commerce Supply Chain Considering Product Quality and Marketing Efforts under Different Power Structures. Sustainability, 16(13), 5536. https: //doi.org/10.3390/su16135536
[7]. Pei, Y., Xue, W., Yang, Y., Li, D., & Li, Y. (2019). The Impacts of user experience on user loyalty based on O2O innovation platform. Journal of Electronic Commerce in Organizations (JECO), 17(2), 79-87.
[8]. Handarkho, Y. D. (2020). The factors influencing customer loyalty in social commerce platform: variety-seeking and social impact perspective. International Journal of Web Information Systems, 16(4), 369-386.
[9]. Cheng, R. (2021, January). Research on Marketing Model of Social E-commerce Based on Customer Loyalty. In the 6th Annual International Conference on Social Science and Contemporary Humanity Development (SSCHD 2020) (pp. 590-595). Atlantis Press.
[10]. Duan, X., Chen, C. N., & Shokouhifar, M. (2024). Impacts of social media Advertising on purchase intention and customer loyalty in e-commerce systems. ACM Transactions on Asian and Low-Resource Language Information Processing, 23(8), 1-15.
[11]. Esmeli, R., Can, A. S., Awad, A., & Bader-El-Den, M. (2025). Understanding customer loyalty-aware recommender systems in E-commerce: an analytical perspective. Electronic Commerce Research, 1-27.
[12]. Ghali, Z. (2021). Motives of customers’e-loyalty towards e-banking services: a study in Saudi Arabia. Journal of Decision Systems, 30(2-3), 172-193.
[13]. Nguyen, T. T., Maxwell Harper, F., Terveen, L., & Konstan, J. A. (2018). User personality and user satisfaction with recommender systems. Information Systems Frontiers, 20, 1173–1189.
[14]. Ting, O. S., Arif, M. S. M., Zakuan, N., Sulaiman, Z., & Saman, M. Z. M. (2016). E-service quality, e-satisfaction and e-loyalty of online shoppers in business to consumer market; evidence form malaysia. IOP Conference Series: Materials Science and Engineering, 131, 0120212.
[15]. Shafee, M. M., & Bazargan, N. A. (2018). Behavioral customer loyalty in online shopping: the role of e-service quality and e-recovery. Journal of Theoretical and Applied Electronic Commerce Research, 13(1), 26–38.
[16]. Rodríguez, P. G., Villarreal, R., Valiño, P. C., & Blozis, S. (2020). A pls-sem approach to understanding e-sq, e-satisfaction and e-loyalty for fashion e-retailers in Spain. Journal of Retailing and Consumer Services, 57, 102201.
[17]. Roger-Monzó, V., Martí-Sánchez, M., & Guijarro-García, M. (2015). Using online consumer loyalty to gain competitive advantage in travel agencies. Journal of Business Research, 68(7), 1638–1640.
[18]. Ghali, Z. (2024). Impact of socioeconomic status on customer e-loyalty under the moderating role of perceived self-efficacy. Journal of Decision Systems, 33(1), 53–78.
[19]. Hallikainen, H., Luongo, M., Dhir, A., & Laukkanen, T. (2022). Consequences of personalized product recommendations and price promotions in online grocery shopping. Journal of Retailing and Consumer Services, 69, 103088.
[20]. Urolagin, S., & Patel, S. (2023). User-specific loyalty measure and prediction using deep neural network from Twitter Data. IEEE Transactions on Computational Social Systems, 11(1), 1046-1061.
[21]. Zhou, X., Khaw, K., & Wu, Y. (2024, November). Prediction of user trust and long-term commitment in e-commerce platforms based on user behavior characteristics. In Proceedings of the 5th International Conference on Artificial Intelligence and Computer Engineering (pp. 123-127).
[22]. Ling, K., & Hu, C. (2024, August). Determinants of Sustained Social Interactions on E-commerce Shopping Guide Platforms: A Machine Learning Perspective. In 2024 5th International Conference on Education, Knowledge and Information Management (ICEKIM 2024) (pp. 528-538). Atlantis Press.
[23]. Mudambi, S. M., & Schuff, D. (2010). Research note: What makes a helpful online review? A study of customer reviews on Amazon. com. MIS quarterly, 185-200.
[24]. Moe, W. W. (2003). Buying, searching, or browsing: Differentiating between online shoppers using in-store navigational clickstream. Journal of consumer psychology, 13(1-2), 29-39.
[25]. Chevalier, J. A., & Mayzlin, D. (2006). The effect of word of mouth on sales: Online book reviews. Journal of marketing research, 43(3), 345-354.
[26]. Morales, A., Kahn, B. E., McAlister, L., & Broniarczyk, S. M. (2005). Perceptions of assortment variety: The effects of congruency between consumers’ internal and retailers’ external organization. Journal of Retailing, 81(2), 159-169.
[27]. Verhoef, P. C., Lemon, K. N., Parasuraman, A., Roggeveen, A., Tsiros, M., & Schlesinger, L. A. (2009). Customer experience creation: Determinants, dynamics and management strategies. Journal of retailing, 85(1), 31-41.
[28]. Chellaiah, Colin Crispin. (2024). SEARCH CONVENIENCE, PERCEIVED VALUE, AND PURCHASE INTENTION OF ONLINE CONSUMERS: AN EMPIRICAL METHOD. 8. 2021-149.