


1. Introduction
China is confronting a demographic crisis. China's total fertility rate reached 1.18 children per woman of childbearing age in 2022 from a level well below the generational replacement of around 2.1 in recent years [1]. In such a scenario, the population of China started to decline in the early 2020s. Demographic experts attribute significant portions of China's population decline to structural factors with high costs of raising children and male-skewed sex ratios, for instance [2,3]. Analysis finds it difficult to reverse population decline under current structural conditions [4].
In turn, the Chinese government relaxed birth-control policies gradually by first lifting the ban on having two children per family starting in 2016 and then allowing three children per family starting in 2021. However, these policies have only had a temporary effect. A surge in births after 2016 damped back down to a declining trend, for example [5]. During 2024–2025, the Chinese government launched policies providing direct monetary incentives to have children. In July 2025, central authorities announced a subsidy of 3,600 yuan per child from birth to age three annually [6]. Local governments have been supportive of this national policy for the past two years. Provincial and city governments have implemented various child allowances from about 1,000 yuan to 100,000 yuan per child over their jurisdictions in addition to housing and education subsidies, for instance [7].
Regardless, demographic analysts report that 3,600 yuan per child is not much compared with the high cost of raising children [8].
To appreciate the expected impact of China's fertility subsidies, it is illuminating to study instances in other low-fertility settings. International studies on cash subsidy policies offer relevant evidence. The Family 500+ in Poland amounted to ~0.5% of GDP and initially raised TFR by 13–15% [9,10], whereas the maternity capital grants in Russia increased long-run fertility by about 0.15 children per woman [11].
This study simulates the impact of cash subsidies on national fertility in China using a two-step design. First, fit an ARIMA model to produce a counterfactual forecast of fertility in China in the absence of any new interventions. Second, include policy scenarios in the model using an exponential-decay semi-elasticity design and international evidence on fertility responses to financial incentives [12,13]. This design captures both the strong responsiveness of fertility to subsidy generosity at the outset, as well as the waning impact over time, consistent with international experience.
By comparing historical data with international experiences, the paper investigates whether new Chinese subsidies can be expected to move birth rates hardly at all. If fertility rates increase only slightly but transfers are substantial, this suggests that it is necessary to complement the discussion about new policies with an argument in favor of extensive structural reforms such as the further development of childcare, housing support, and protection in the workplace. The intention of this paper is to contribute to the debate on fertility policy by offering realistic basis assumptions for both the expected near- and long-term effects of fiscal fertility policies.
2. Literature review
Low fertility is a global trend. Is China’s low fertility different from the rest of the world?
China’s total fertility rate (TFR) dropped to around 1.2 by 2022, far below the replacement level of 2.1. People face many cultural and economic constraints that make them disinclined to have children. These include high costs of raising children, the housing pressure, and male-oriented cultural values [2,3]. Before the introduction of the subsidy policy, a comprehensive survey in eastern China found that only 15.1% of couples with young children wanted to have a second child, reflecting a low fertility intention [14].
Experience around the world shows that money can boost fertility, but the increase is usually small and temporary. For example, the fertility rate increased by approximately 13% to 15% in Poland due to the family welfare program [9]. A systematic review concludes that although most fiscal incentives offer a temporary boost, the long-term impact depends on whether there is accompanying support in areas such as childcare and parental leave [15].
Previous studies in China have reached similar conclusions. Results from surveys show that money can boost fertility willingness in some households, but the response is small and confined to those who already want a second child [14]. Most couples mention the high costs of housing and education, as well as the time required for raising children, as factors that prevent them from having more children, all of which subsidies cannot address. Demographers have long used statistical models and time-series approaches to predict fertility trends. For example, using the Holt exponential smoothing method to impute missing values, a study forecasted that fertility in China would continue to decline [16]. India’s TFR has also been reliably forecasted by ARIMA models in a classical framework and a Bayesian framework [17]. Holt methods capture broad trends, whereas comparative studies show that ARIMA models often provide more accurate forecasts. Recently, researchers have included hypothetical policy changes in forecasting exercises. They found that subsidies cause a temporary increase unless they are embedded in some structural change. In a comparative study of Norway and Spain, only generous and gender-inclusive family policies led to sustained increases in fertility, while limited support led to a return to the fertility rates before the crisis [18].
Therefore, the literature suggests that direct cash subsidies may marginally increase fertility in the short term, but the impacts of cash decline over time unless accompanied by structural changes. The literature also shows that initial increases in fertility in three countries (China, Russia, and Poland) are followed by stagnation or decline [9,11,16]. Forecasting studies indicate that small changes in policy will only lead to temporary improvements, and fertility will continue to decline unless there are significant cultural and institutional changes [15].
3. Methodology
3.1. Data source
Annual fertility (China TFR) and GDP per capita data were extracted from the World Bank World Development database Indicators [19]. All variables and covariates (e.g., GDP per capita) are World Bank statistics. The baseline fertility time series spans back to 1960–2023, as this is the largest time period available.
3.2. Baseline prediction using an ARIMA model
An ARIMA time-series model was fit to the previous TFR data. An ARIMA model captures autocorrelation and long-term trends and is a standard econometric forecast. Following the procedure in [17], the Auto ARIMA package in R was used to fit an optimal ARIMA(p,d,q) model to the data by the information criteria. The fitted model is then used to extend the trend to obtain annual TFR for 2024-2030 under a baseline scenario with no new policies.
The general ARIMA model takes the form:
Where:
• X = log(TFR) at time t
• L = lag operator
• d = degree of differencing
• φᵢ = autoregressive parameters
• θⱼ = moving average parameters
• ε = error term
The fitted model is then used to make a "baseline" estimate of annual TFR from 2024-2030, which is a scenario in which no further policy changes are expected. This baseline would predict that fertility continues to decrease toward low levels, which has been the trend in the past [19].
3.3. Simulation of child subsidy impacts on fertility
The simulation examines the impacts of child subsidies beginning in 2025 under two policy scenarios. Scenario A reflects a moderate subsidy of 3,600 yuan per child per year (around $514), which is exactly what the newly released central government policy announced. Scenario B reflects a generous subsidy of 12,000 yuan per child per year (around $1,714), which represents the upper-bound scenario for the generosity of child subsidies.
3.3.1. Model framework
To capture fertility effects, the analysis applies an exponential-decay semi-elasticity model calibrated on international estimates of family policy responsiveness [12,20]. The change in fertility relative to baseline projections is expressed as:
Where:
•
•
•
• The exponential term ensures that the policy impact gradually diminishes.
To reflect the waning effectiveness of subsidies over time, an exponential decay factor is applied. While the magnitude of fertility responses to policies is strongest in the immediate period after introduction, the long-term effect declines as households adapt their expectations and behavior. In line with this view, the OECD notes that “family policy impacts are generally more pronounced in the short run, although their long-term effects tend to be smaller” [20]. In line with this conclusion, the decay coefficient is set to 0.25, so the half-life is around 2.8 years. This follows standard demographic modelling practice for policy effects to decay within 2–3 years and ensures that impacts are not negligible in the medium term but do not exaggerate persistence.
3.3.2. Coefficient interpretation
Empirical studies suggest that every additional PPP-adjusted $1,000 subsidy per child is associated with an increase in TFR. For example, in Germany, research finds that child benefits significantly boost fertility rates [12]. Based on the calculations from these findings, this translates to approximately 1.7% per $1,000 PPP. Considering China's social, economic, and cultural context—including substantially higher child-rearing costs and more conservative fertility preferences relative to Europe [13]—it is reasonable to adopt a more conservative semi-elasticity range of 1.2%–1.6% per USD 1,000 PPP when applying these estimates to Chinese households. Applying this elasticity to China’s subsidy levels, the following estimated impacts from each scenario are obtained: Scenario A gives an additional subsidy of CNY 3,600 (~USD 857 PPP) per child per year. Multiplying 0.857 by the semi-elasticity range 0.012 – 0.016 implies a proportional fertility gain of +1.0% to +1.4% relative to baseline. Scenario B gives an additional subsidy of CNY 12,000 (~USD 2,857 PPP) per child per year. Multiplying 2.857 by the semi-elasticity range 0.012 – 0.016 implies a proportional fertility gain of +3.4% to +4.6% relative to baseline.
4. Results
The ARIMA baseline forecast forecasts that China’s TFR will continue to decline over 2024-2030. The fitted model forecasts that the TFR of around 0.949 in 2024 will decline to around 0.790 by 2030. This downward trend is in line with previous studies predicting a continued downward trend without policy change [16]. Figure 1 shows the black baseline prediction, and the two subsidy scenarios: Scenario A (¥3600 per child, conservative) in blue and Scenario B (¥12,000 per child, aggressive) in red. By 2030, without any subsidy, TFR is predicted to be around 0.790 children per woman.
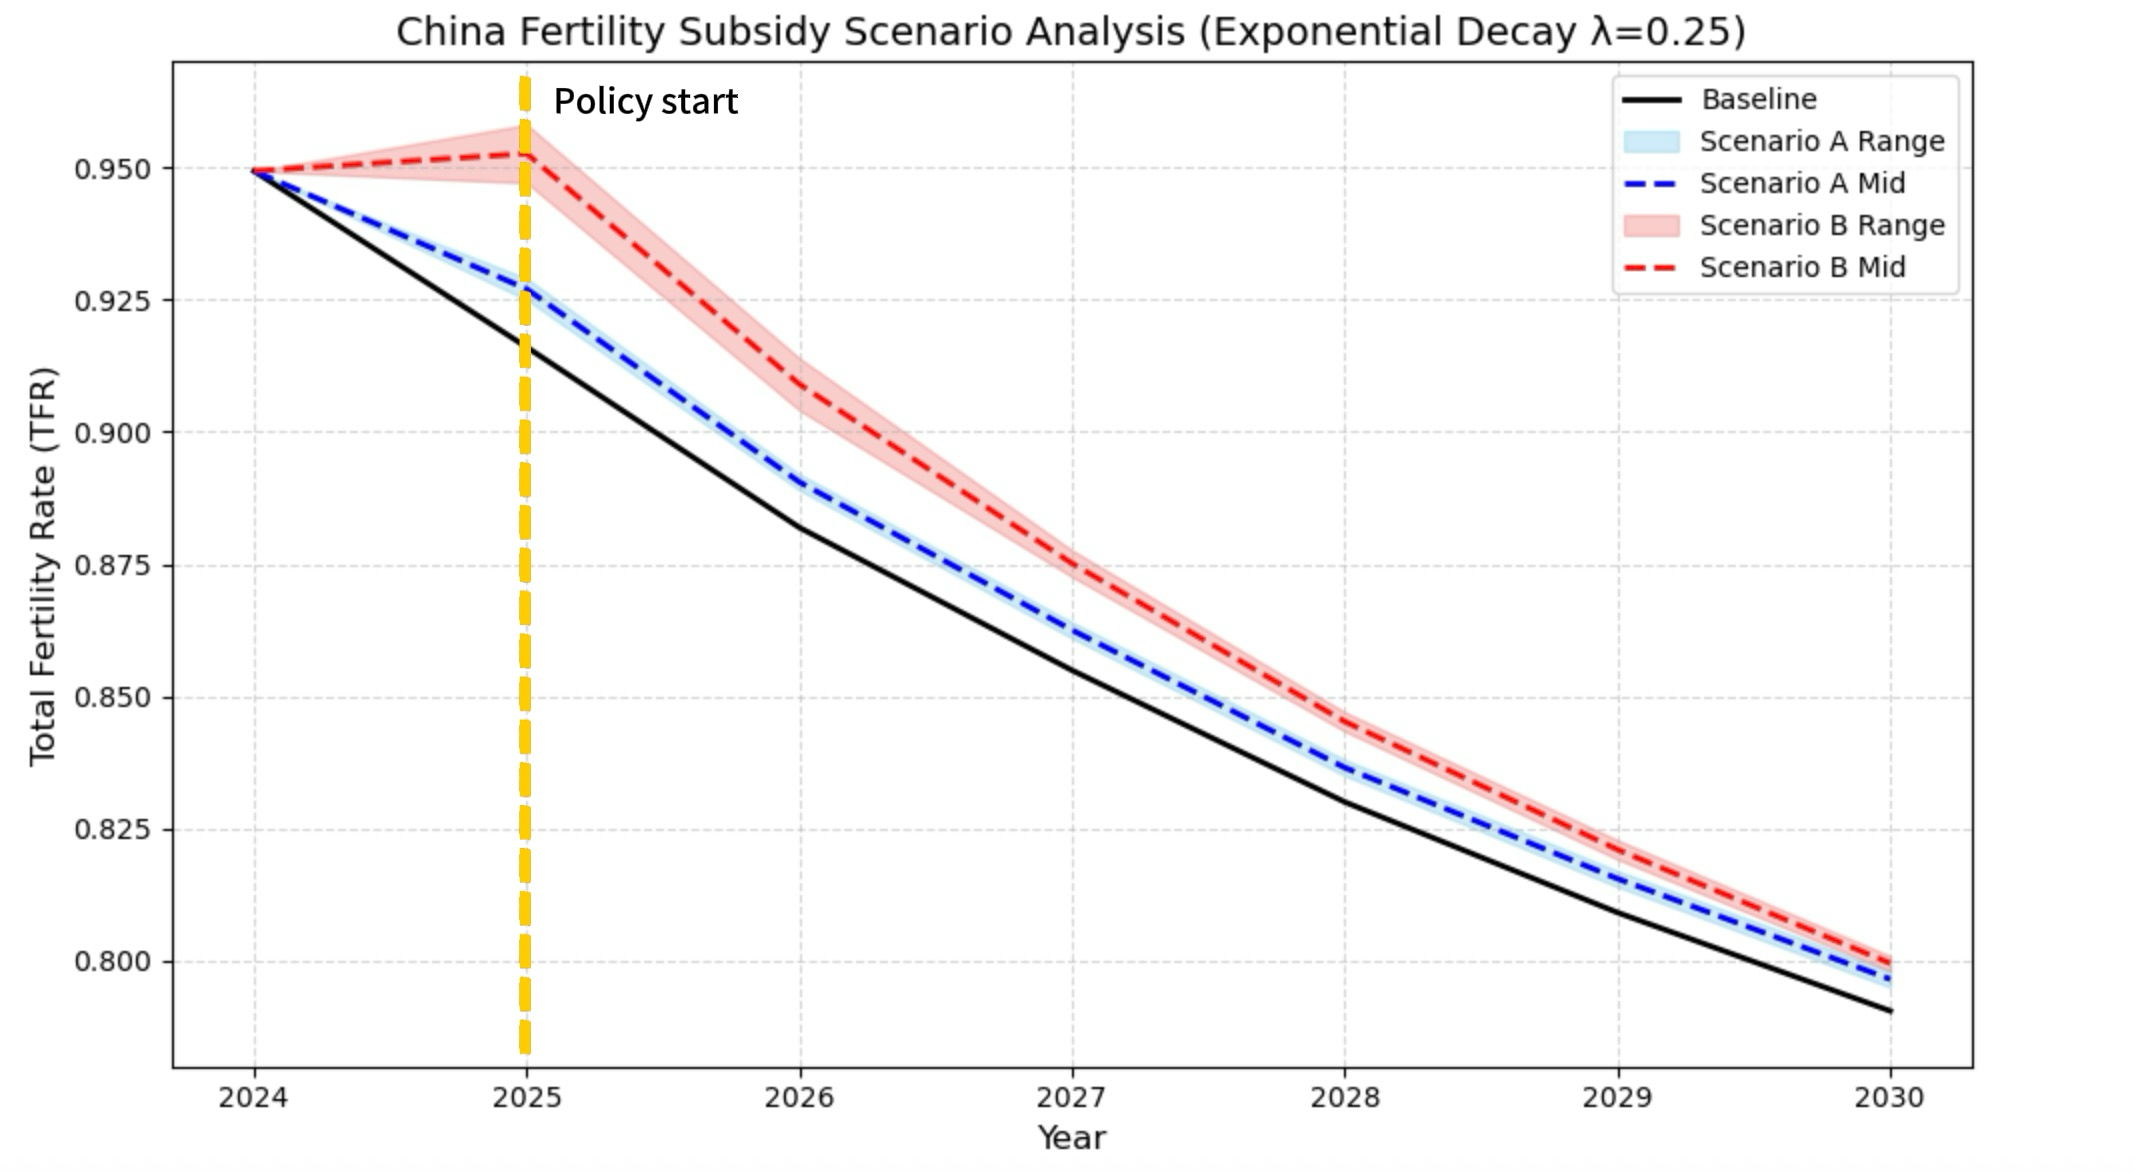
For Scenario A, the subsidy yields a small impact. In 2025, the TFR increases from 0.916 to 0.927–0.929, a percent increase of +1.0% to +1.4%. In subsequent years, the impact decays rapidly due to the effect of λ. The TFR reaches 0.796–0.798 in 2030, a percent increase of +0.7% to +1.0% over baseline.
For Scenario B, the larger subsidy results in a larger percent increase. In 2025, the TFR increases to 0.947–0.958, a percent increase of +3.4% to +4.6%. In subsequent years, the percent increase decays rapidly due to the effect of λ. The TFR reaches 0.809–0.820 in 2030, a percent increase of +2.4% to +3.7% over baseline. Even with the larger subsidy in Scenario B, the long-term gain in TFR is small relative to the amount required to reach replacement-level TFR.
Quantitatively, the results are displayed in Tables 1 and 2, which display the annual TFR for the baseline and Scenarios A and B, respectively, along with the percent increase compared to the baseline.
|
Year |
Baseline Prediction |
Scenario A Low |
Scenario A High |
Increase in TFR_Low (%) |
Increase in TFR_High (%) |
|
2024 |
0.949 |
/ |
/ |
/ |
/ |
|
2025 |
0.916 |
0.925 |
0.929 |
0.98 |
1.42 |
|
2026 |
0.882 |
0.889 |
0.892 |
0.81 |
1.15 |
|
2027 |
0.855 |
0.862 |
0.864 |
0.71 |
1.06 |
|
2028 |
0.830 |
0.835 |
0.838 |
0.60 |
0.96 |
|
2029 |
0.809 |
0.814 |
0.817 |
0.61 |
0.98 |
|
2030 |
0.791 |
0.795 |
0.798 |
0.57 |
0.95 |
|
Year |
Baseline Prediction |
Scenario B Low |
Scenario B High |
Increase in TFR_Low (%) |
Increase in TFR_High (%) |
|
2024 |
0.949 |
/ |
/ |
/ |
/ |
|
2025 |
0.916 |
0.947 |
0.958 |
3.39 |
4.59 |
|
2026 |
0.882 |
0.904 |
0.914 |
2.53 |
3.28 |
|
2027 |
0.855 |
0.873 |
0.878 |
2.09 |
2.73 |
|
2028 |
0.830 |
0.843 |
0.847 |
1.63 |
2.04 |
|
2029 |
0.809 |
0.819 |
0.823 |
1.25 |
1.62 |
|
2030 |
0.791 |
0.798 |
0.801 |
0.97 |
1.67 |
These results suggest that direct cash transfers have only a small impact on China’s aggregate TFR. Under conservative subsidy (Scenario A), an additional ~0.006–0.008 children are expected per woman by 2030. Under the high-subsidy case (Scenario B), an additional ~0.018–0.029 children are expected per woman by 2030 (i.e., if subsidies were to be tripled from ¥3,600 to ¥12,000, the long-run TFR increase is only ~0.7–3.7%). In other words, cash transfers cannot reverse the decline in replacement fertility.
Moreover, results from scenario projections show the importance of diminishing returns. Scenario B leads to a larger absolute increase in TFR in the first year, but the percentage effect on TFR declines over subsequent years due to the exponential decay (λ = 0.25) [9]. This pattern echoes previous experiences with policies that temporarily raised birth rates (e.g., Poland) [9]. These results corroborate findings that only generous and gender-inclusive family policies can lead to significant fertility increases, while moderate or one-off support leaves fertility at low levels [10].
In sum, cash subsidies are so small as to be inconsequential to China’s TFR. Even under optimistic assumptions, the model predicts an increase of a few percent at most. It reinforces the view that other structural factors, such as housing, childcare, and career support, must also be addressed [14]. Given the limited effectiveness of direct cash transfers, it is clear that a comprehensive fertility policy is needed. Given the modest positive step of ¥3,600 and the diminishing returns, it is also clear that increasing payment returns diminishes benefits. Perhaps policy resources could do more if applied to addressing structural barriers and offering a comprehensive fertility policy. That is, a combination of modest cash transfers with reforms in education, housing, and workplace flexibility may achieve the greatest demographic impact [15].
5. Discussion
Parents in surveys report that work-life stress, housing costs, and education costs are bigger barriers to childbearing than direct monetary benefits [14]. Scenario simulations show that direct cash transfers result in only small, short-term increases in fertility. A comparison of subsidy intensity in terms of percentage of GDP helps explain part of the difference: Poland’s Family 500+ reached approximately 0.5% of GDP and led to a significant fertility boost, while China’s current subsidy, around 0.02% of GDP, has produced only modest gains [9]. This suggests that China’s limited fertility response may stem both from the relatively small scale of subsidies and from the fact that cash transfers alone are insufficient. Without other policy reforms, China’s overall fertility is expected to continue to decline in the next decade. Evidence from low-fertility contexts shows that comprehensive policies—including support for childcare, gender-equal parental leave, and flexible work arrangements—are more successful in maintaining higher fertility [15]. Structural and cultural factors, therefore, fundamentally constrain the effectiveness of financial incentives alone.
6. Conclusion
In this study, a univariate ARIMA time-series model was used to project the trajectory of China’s fertility rate and to evaluate policy scenarios in which cash subsidies were introduced as shocks to the baseline path. The baseline forecast points to a continued, gradual decline that does not recover to replacement level within the projection horizon. When subsidy scenarios are superimposed on the forecast, the level of the series improves briefly, but the effect is modest and fades as the process reverts toward its underlying trend. In other words, direct transfers can nudge near-term outcomes but do not materially alter the medium- to long-run dynamics implied by the historical data.
Taken together with the discussion in the paper, these results underscore that fertility decisions are shaped by structural constraints that lie beyond one-off financial incentives: the cost of childcare and education, housing and employment pressures, time conflicts between caregiving and careers, and expectations within households. Cash benefits can complement, but not substitute for, wider institutional support. Policy emphasis should therefore shift from isolated transfers to a coordinated package that expands affordable childcare, reduces schooling and housing burdens, strengthens workplace flexibility and parental leave, and improves protection of women’s career prospects—so that the perceived lifetime cost and risk of child-rearing are genuinely lowered.
Methodologically, the ARIMA framework offers a transparent statistical baseline but cannot isolate causal effects of specific policies and is sensitive to model specification, sample length, and structural breaks. The analysis should be read as evidence about tendencies in the observed series rather than definitive estimates of policy impact. Future work can enrich the framework by incorporating exogenous drivers (ARIMAX), testing seasonal or regime-switching variants when appropriate, conducting rolling or recursive re-estimation to handle breaks, and comparing bundles of policy scenarios. Overall, the study provides a practical forecasting baseline and shows that durable improvement in fertility will depend on structural reforms working alongside, not in place of, cash support.
References
[1]. Pew Research Center, “Key facts about China’s declining population, ” Pew Research Center. [Online]. Available: https: //www.pewresearch.org/short-reads/2022/12/05/key-facts-about-chinas-declining-population/ [Accessed: Sep. 9, 2025].
[2]. YuWa Population Research Institute, “Cost of raising children in China is second-highest in world relative to GDP per capita, ” The Guardian, Feb. 21, 2024. [Online]. Available: https: //www.theguardian.com/world/2024/feb/21/cost-of-raising-children-in-china-is-second-highest-in-the-world-think-tank-reveals
[3]. S.-J. Wei, “Sex and the Chinese economy, ” Project Syndicate – Columbia Business School. [Online]. Available: https: //leading.business.columbia.edu/economics-policy/chazen-global-insights/sex-and-chinese-economy [Accessed: Sep. 9, 2025].
[4]. Q. Jiang, “Revisiting fertility transition in China, ” China Population and Development Studies, vol. 8, pp. 1–16, 2024, doi: 10.1007/s42379-024-00169-0.
[5]. F. Jin, “Analysis of birth rate in mainland China under the universal two-child policy, ” Int. J. Popul. Sci., 2025, doi: 10.36922/IJPS025140053.
[6]. Xinhua News Agency, “Childcare subsidy to benefit tens of millions of Chinese families, ” Xinhua, Jul. 30, 2025. [Online]. Available: https: //www.xinhuanet.com/english/20250730/64bc25c636384691a03d9f7403b5d68d/c.html
[7]. Global Times, “23 provincial-level regions implement childbirth subsidy policies, ” Global Times, Aug. 15, 2025. [Online]. Available: https: //www.globaltimes.cn/page/202508/1318456.shtml
[8]. The Economic Times, “3, 600 yuan for one kid: China once fined families for extra babies, now it’s paying couples to have them, ” Aug. 6, 2025. [Online]. Available: https: //m.economictimes.com/news/international/global-trends/3600-yuan-for-one-kid-china-slapped-fines-for-extra-babies-now-its-paying-couples-to-have-them/articleshow/123139690.cms
[9]. A. Bokun, “Evidence from Poland’s Family 500+ policy, ” Demographic Research, vol. 51, no. 28, pp. 815–846, 2022. [Online]. Available: https: //www.demographic-research.org/volumes/vol51/28/51-28.pdf
[10]. M. Kowalski and P. Nowak, “The effect of family fertility support policies on fertility in OECD countries, ” Popul. Dev. Rev., vol. 49, no. 3, pp. 412–438, 2023, doi: 10.1111/padr.12543.
[11]. F. Slonimczyk and A. Yurko, “Assessing the impact of the maternity capital policy in Russia using a dynamic model of fertility and employment, ” Labour Econ., vol. 30, pp. 31–53, 2014, doi: 10.1016/j.labeco.2014.04.001.
[12]. A. Raute, "Can financial incentives reduce the baby gap? Evidence from a reform in maternity leave benefits, " Journal of Public Economics, vol. 169, pp. 203-222, Jan. 2019, doi: 10.1016/j.jpubeco.2018.07.010.
[13]. YuWa Population Research Institute, "The Cost of Raising Children in China and International Comparison, " Research Report, Beijing, China, Feb. 2022. [Online]. Available: https: //www.globaltimes.cn/page/202202/1252843.shtml
[14]. W.-H. Dong, X. Wang, F. Yuan, L. Wang, T.-M. Gu, B.-Q. Zhu, and J. Shao, “Will a government subsidy increase couples’ further fertility intentions? A real-world study from a large-scale online survey in Eastern China, ” Hum. Reprod. Open, vol. 2024, no. 4, hoae055, 2024, doi: 10.1093/hropen/hoae055.
[15]. O. Chi, “Can government financial aid save an aging society? A systematic review on the effect of financial incentives on the fertility rate, ” Open J. Bus. Manag., vol. 13, no. 2, pp. 1018–1046, 2025, doi: 10.4236/ojbm.2025.132055.
[16]. M. Wang, “A retrospective and predictive study of fertility rates in China using Holt’s exponential smoothing models, ” BMC Public Health, vol. 19, p. 7581, 2019, doi: 10.1186/s12889-019-7581-4.
[17]. P. K. Tripathi, R. K. Mishra, and S. K. Upadhyay, “Bayes and classical prediction of total fertility rate of India using autoregressive integrated moving average model, ” J. Stat. Appl. Probab., vol. 7, no. 2, pp. 233–244, 2018. [Online]. Available: https: //digitalcommons.aaru.edu.jo/jsap/vol7/iss2/2/
[18]. V. Díaz-Gandasegui, B. Elizalde-San Miguel, and M. T. Sanz, “Back to the future: A sensitivity analysis to predict future fertility rates considering the influence of family policies—The cases of Spain and Norway, ” Soc. Indic. Res., vol. 154, no. 3, pp. 943–968, 2021, doi: 10.1007/s11205-020-02566-7.
[19]. World Bank, World development indicators. Washington, DC: World Bank Group, 2024. [Online]. Available: https: //databank.worldbank.org/source/world-development-indicators
[20]. OECD, Fertility, employment, and family policy: A cross-country panel analysis, OECD Social, Employment and Migration Working Papers, no. 299. Paris: OECD Publishing, 2023, doi: 10.1787/5a13b8c7-en.
Cite this article
Sun,A. (2025). Predicting China’s Fertility Rate Using an ARIMA Model and Assessing the Impact of Cash Subsidies. Advances in Economics, Management and Political Sciences,224,164-171.
Data availability
The datasets used and/or analyzed during the current study will be available from the authors upon reasonable request.
Disclaimer/Publisher's Note
The statements, opinions and data contained in all publications are solely those of the individual author(s) and contributor(s) and not of EWA Publishing and/or the editor(s). EWA Publishing and/or the editor(s) disclaim responsibility for any injury to people or property resulting from any ideas, methods, instructions or products referred to in the content.
About volume
Volume title: Proceedings of ICFTBA 2025 Symposium: Data-Driven Decision Making in Business and Economics
© 2024 by the author(s). Licensee EWA Publishing, Oxford, UK. This article is an open access article distributed under the terms and
conditions of the Creative Commons Attribution (CC BY) license. Authors who
publish this series agree to the following terms:
1. Authors retain copyright and grant the series right of first publication with the work simultaneously licensed under a Creative Commons
Attribution License that allows others to share the work with an acknowledgment of the work's authorship and initial publication in this
series.
2. Authors are able to enter into separate, additional contractual arrangements for the non-exclusive distribution of the series's published
version of the work (e.g., post it to an institutional repository or publish it in a book), with an acknowledgment of its initial
publication in this series.
3. Authors are permitted and encouraged to post their work online (e.g., in institutional repositories or on their website) prior to and
during the submission process, as it can lead to productive exchanges, as well as earlier and greater citation of published work (See
Open access policy for details).
References
[1]. Pew Research Center, “Key facts about China’s declining population, ” Pew Research Center. [Online]. Available: https: //www.pewresearch.org/short-reads/2022/12/05/key-facts-about-chinas-declining-population/ [Accessed: Sep. 9, 2025].
[2]. YuWa Population Research Institute, “Cost of raising children in China is second-highest in world relative to GDP per capita, ” The Guardian, Feb. 21, 2024. [Online]. Available: https: //www.theguardian.com/world/2024/feb/21/cost-of-raising-children-in-china-is-second-highest-in-the-world-think-tank-reveals
[3]. S.-J. Wei, “Sex and the Chinese economy, ” Project Syndicate – Columbia Business School. [Online]. Available: https: //leading.business.columbia.edu/economics-policy/chazen-global-insights/sex-and-chinese-economy [Accessed: Sep. 9, 2025].
[4]. Q. Jiang, “Revisiting fertility transition in China, ” China Population and Development Studies, vol. 8, pp. 1–16, 2024, doi: 10.1007/s42379-024-00169-0.
[5]. F. Jin, “Analysis of birth rate in mainland China under the universal two-child policy, ” Int. J. Popul. Sci., 2025, doi: 10.36922/IJPS025140053.
[6]. Xinhua News Agency, “Childcare subsidy to benefit tens of millions of Chinese families, ” Xinhua, Jul. 30, 2025. [Online]. Available: https: //www.xinhuanet.com/english/20250730/64bc25c636384691a03d9f7403b5d68d/c.html
[7]. Global Times, “23 provincial-level regions implement childbirth subsidy policies, ” Global Times, Aug. 15, 2025. [Online]. Available: https: //www.globaltimes.cn/page/202508/1318456.shtml
[8]. The Economic Times, “3, 600 yuan for one kid: China once fined families for extra babies, now it’s paying couples to have them, ” Aug. 6, 2025. [Online]. Available: https: //m.economictimes.com/news/international/global-trends/3600-yuan-for-one-kid-china-slapped-fines-for-extra-babies-now-its-paying-couples-to-have-them/articleshow/123139690.cms
[9]. A. Bokun, “Evidence from Poland’s Family 500+ policy, ” Demographic Research, vol. 51, no. 28, pp. 815–846, 2022. [Online]. Available: https: //www.demographic-research.org/volumes/vol51/28/51-28.pdf
[10]. M. Kowalski and P. Nowak, “The effect of family fertility support policies on fertility in OECD countries, ” Popul. Dev. Rev., vol. 49, no. 3, pp. 412–438, 2023, doi: 10.1111/padr.12543.
[11]. F. Slonimczyk and A. Yurko, “Assessing the impact of the maternity capital policy in Russia using a dynamic model of fertility and employment, ” Labour Econ., vol. 30, pp. 31–53, 2014, doi: 10.1016/j.labeco.2014.04.001.
[12]. A. Raute, "Can financial incentives reduce the baby gap? Evidence from a reform in maternity leave benefits, " Journal of Public Economics, vol. 169, pp. 203-222, Jan. 2019, doi: 10.1016/j.jpubeco.2018.07.010.
[13]. YuWa Population Research Institute, "The Cost of Raising Children in China and International Comparison, " Research Report, Beijing, China, Feb. 2022. [Online]. Available: https: //www.globaltimes.cn/page/202202/1252843.shtml
[14]. W.-H. Dong, X. Wang, F. Yuan, L. Wang, T.-M. Gu, B.-Q. Zhu, and J. Shao, “Will a government subsidy increase couples’ further fertility intentions? A real-world study from a large-scale online survey in Eastern China, ” Hum. Reprod. Open, vol. 2024, no. 4, hoae055, 2024, doi: 10.1093/hropen/hoae055.
[15]. O. Chi, “Can government financial aid save an aging society? A systematic review on the effect of financial incentives on the fertility rate, ” Open J. Bus. Manag., vol. 13, no. 2, pp. 1018–1046, 2025, doi: 10.4236/ojbm.2025.132055.
[16]. M. Wang, “A retrospective and predictive study of fertility rates in China using Holt’s exponential smoothing models, ” BMC Public Health, vol. 19, p. 7581, 2019, doi: 10.1186/s12889-019-7581-4.
[17]. P. K. Tripathi, R. K. Mishra, and S. K. Upadhyay, “Bayes and classical prediction of total fertility rate of India using autoregressive integrated moving average model, ” J. Stat. Appl. Probab., vol. 7, no. 2, pp. 233–244, 2018. [Online]. Available: https: //digitalcommons.aaru.edu.jo/jsap/vol7/iss2/2/
[18]. V. Díaz-Gandasegui, B. Elizalde-San Miguel, and M. T. Sanz, “Back to the future: A sensitivity analysis to predict future fertility rates considering the influence of family policies—The cases of Spain and Norway, ” Soc. Indic. Res., vol. 154, no. 3, pp. 943–968, 2021, doi: 10.1007/s11205-020-02566-7.
[19]. World Bank, World development indicators. Washington, DC: World Bank Group, 2024. [Online]. Available: https: //databank.worldbank.org/source/world-development-indicators
[20]. OECD, Fertility, employment, and family policy: A cross-country panel analysis, OECD Social, Employment and Migration Working Papers, no. 299. Paris: OECD Publishing, 2023, doi: 10.1787/5a13b8c7-en.