


1. Introduction
In the context of the booming sports industry, the National Football League (NFL), as a highly commercially valuable and widely influential event, has always attracted much attention. NFL games are not only a stage for sports competitions but also the core of a huge commercial system. The success of its commercial operations is closely linked to the high viewership of the events. In NFL games, quarterbacks, as key organizers of the team's offense, their performance statistics have a pivotal impact on the game results and the appreciation of the events, which may in turn have a complex connection with viewership.
Previous studies have mostly focused on the changing trends of overall NFL viewership and macro-level factors affecting viewership, such as rule changes, market environment, and social culture. However, there are relatively few studies on the relationship between specific statistical data of quarterbacks and viewership. Especially over the decade from 2015 to 2024, with the development of NFL events and the dynamic changes in players' performance, in-depth exploration of the intrinsic connection between quarterbacks' passing attempts, passing completions, passing touchdowns and viewership has important practical significance and research value. Research questions of this study are:
(1) What is the relationship between quarterback passing attempts, completions, and touchdowns, and NFL television ratings?
(2) Do non-performance factors, such as the frequency of game interruptions, score differentials, and celebrity involvement, influence viewership trends?
This study aims to fill this research gap. By systematically analyzing the passing attempts, passing completions, and passing touchdowns of NFL quarterbacks from 2015 to 2024, using statistical analysis and correlation research methods, it will explore the association between these data and viewership, trying to reveal the potential laws between quarterbacks' performance and the attractiveness of events, so as to provide decision-making references for NFL event operators, broadcasters, and related stakeholders to better enhance the commercial value and appreciation of the events.
2. Literature review
The National Football League (NFL), which is a dominant game, has experienced great shifts in traditional television viewership. Although the NFL maintains great commercial value, recent trends suggest that changes in media consumption preference, evolving rules, and on-field developments are changing how fans engage in this sport. This literature review synthesizes key scholarly findings across sports economics, media studies, and performance analytics to find factors which contribute to this decline.
2.1. Rule changes, game tempo, and viewer engagement
The NFL has consistently revised its rules to increase player’s safety, competitive integrity, and entertainment value, especially quarterbacks—have effectively reduced head injuries [1]. But they have also been criticized for decreasing the sport’s physical intensity and disrupting game flow. Lehman et al found that the introduction of protection rules for defenseless players in 2009 significantly increased penalty calls, potentially influencing the viewing experience [2].
Commercial breaks and official reviews increase viewer dissatisfaction. Beyer noted that the frequency of these interruptions undermines immersive engagement [3]. Pelechrinis and Papalexakis, in their “Footballonomics” study, used quantitative models to demonstrate how fourth-down decisions affect game rhythm and win possibility—both of which influence viewer satisfaction [4]. Moreover, Pagels found that the combination of poorly scheduled games (e.g., Thursday Night Football) and rule inconsistencies (e.g., overtime regulations) has a statistically negative impact on ratings, highlighting the sensitivity of audiences to the game’s structural design [5].
2.2. Celebrity effects and shifting fan loyalty
In the contemporary sports environment, fan loyalty is increasingly shaped by individual athletes rather than team identity. Fortunato argued that the rise of Fantasy Football has shifted attention from team success to player performance, contributing to a more individualized fan experience. This evolution in loyalty underscores the growing “celebrity effect” in NFL media dynamics [6].
Tom Brady offers a great example. According to Pro Football Network [7], his team transition significantly influenced fan interest and franchise popularity.
Growth in both social media activity and viewership shows that celebrity athletes amplify fan engagement and media attention, further solidifying the role of individual stars in shaping viewership trends
While Dufur et al. primarily studied the social effects of team success, their findings on community-level impact can be inferred that how star-driven success affects local and national media attention [8]. When such players leave, fan interest often follows with them, intensifying the media’s reliance on star-centered narratives.
2.3. Tactical innovation and the changing role of the quarterback
Strategic transformation—especially in offensive tactics—has deeply altered the structure and tempo of NFL games. The adoption of data analytics has encouraged coaches to move beyond conservative play-calling. Canes-Wrone et al observed a growing acceptance of data-driven decisions, such as aggressive fourth-down attempts, which introduce greater strategic risk and enhance game excitement [9].
The quarterback (QB) position has undergone the most significant alteration. Traditionally dominated by stationary pocket passers. Nowadays, the role is increasingly filled by dual-threat quarterbacks who can both pass and run effectively. Lopez used player-tracking data to show how quarterback mobility under pressure has become a key performance factor [10]. This evolution adds unpredictability and excitement to offensive play, which is central to viewer engagement. Pelechrinis also emphasized that a balanced offensive scheme—including passing and rushing—contributes to greater competitive uncertainty and aesthetic satisfaction [11]. Furthermore, Albert and Angelis analyzed the sensitivity of QB rating systems, revealing how new metrics are reshaping fan discourse and perceptions of value [12].
NFL viewership is influenced by a complex interplay of institutional, cultural, and tactical factors. Rule changes aimed at player safety must be carefully managed to avoid undermining game flow. At the same time, the celebrity-driven nature of modern fandom calls for a reevaluation of how loyalty is formed and maintained. Finally, offensive tactical evolution, particularly through analytics and the redefinition of the QB role, has introduced fresh excitement but also challenges traditional narratives.
3. Methodology and dataset
This study adopts a mixed-methods approach to explore the relationship between NFL quarterback performance and viewership. Quantitative methods include descriptive statistics, box plots for distribution analysis, and Pearson correlation coefficients to assess associations between variables. Qualitative analysis draws on literature to examine non-competitive factors. Competitive factors focus on quarterback metrics and their trends relative to viewership, while non-competitive factors involve thematic discussions of interruptions, score dynamics, and celebrity influences.
The dataset comprises aggregated annual statistics for NFL quarterbacks and average game viewership from 2015 to 2024, covering 10 years and 304 quarterback observations (those with sufficient playing time to qualify for league leaders).
Figure 1 shows the trend in NFL viewership per game from 2015 to 2024.
Viewership Data are sourced from Statista, Ministry of Sports, and The Memo. These provide aggregated average viewership per game, focusing on television and streaming metrics. Quarterback statistics is source from https://www.pro-football-reference.com/
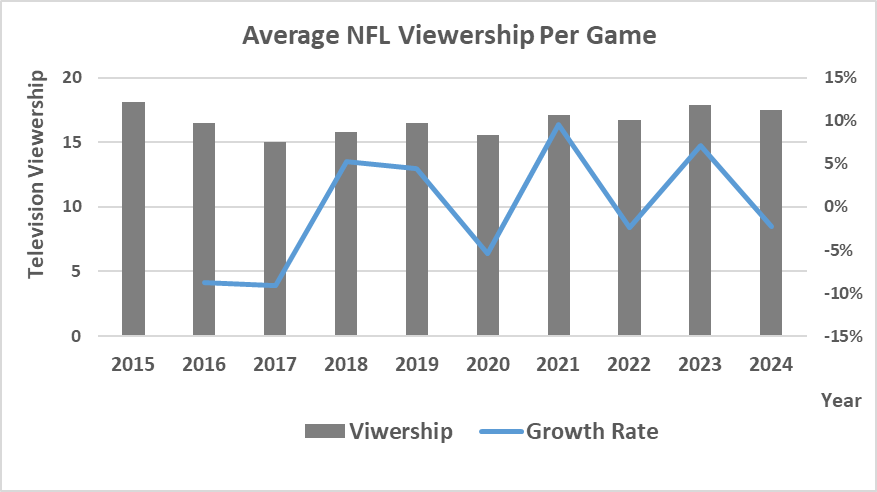
Source: Statista, Ministry of Sports, The Memo.
Table 1 Variables Definition below summarizes the key variables in this study.
|
Terms |
Abbr. |
Definition |
Units |
|
Touchdown |
TD |
The number of touchdowns scored, often referring to passing touchdowns in quarterback stats, where a pass is completed in the end zone. |
Count (number) |
|
Attempts |
Att |
The number of pass attempts by a quarterback. |
Count (number) |
|
Completions |
Cmp |
The number of successfully completed passes. |
Count (number) |
|
Interceptions |
Int |
The number of passes intercepted by the defense (for quarterbacks, interceptions thrown). |
Count (number) |
|
Yards per Game |
Y/G |
The average number of yards gained per game, typically passing yards per game for quarterbacks. |
Yards per game |
|
Net Yards per Attempt |
NY/A |
A measure of passing efficiency calculated as (passing yards - sack yards) divided by (pass attempts + sacks). |
Yards per attempt |
|
Fourth Quarter Comebacks |
4QC |
The number of times a quarterback has led a comeback victory in the fourth quarter. |
Count (number) |
|
TD |
Att |
Cmp |
Int |
Y/G |
NY/A |
4QC |
|
|
Mean |
22.5 |
482.0 |
312.4 |
10.4 |
242.2 |
6.4 |
1.8 |
|
Standard Error |
0.5 |
6.3 |
4.3 |
0.2 |
2.1 |
0.0 |
0.1 |
|
Median |
22 |
494 |
319 |
10 |
244 |
6 |
2 |
|
Mode |
26 |
483 |
407 |
12 |
266 |
6 |
1 |
|
Standard Deviation |
8.8 |
109.1 |
75.7 |
3.9 |
36.5 |
0.8 |
1.4 |
|
Kurtosis |
-0.3 |
-0.3 |
-0.4 |
1.5 |
-0.5 |
0.1 |
1.9 |
|
Skewness |
0.3 |
-0.4 |
-0.3 |
0.6 |
-0.1 |
0.1 |
1.0 |
|
Range |
46.0 |
604.0 |
408.0 |
28.0 |
178.7 |
4.7 |
8.0 |
|
Minimum |
4 |
129 |
82 |
2 |
149.5 |
4.07 |
0 |
|
Maximum |
50 |
733 |
490 |
30 |
328.2 |
8.81 |
8 |
|
Count |
304 |
304 |
304 |
304 |
303 |
302 |
301 |
Table 2 Descriptive Statistics provides an overview of the distribution and central tendencies of quarterback performance metrics across the 304 observations. The data reveal moderate variability in passing volume and outcomes, with attempts and completions showing higher standard deviations due to differences in playing time and team strategies. Skewness values are generally close to zero, indicating near-symmetric distributions, though interceptions exhibit positive skewness (0.6), suggesting a tail of higher-turnover seasons. Kurtosis is mostly negative, implying flatter distributions than normal. Overall, these statistics highlight consistent quarterback performance patterns over the decade, with maxima reflecting elite seasons (e.g., 50 TDs, 733 attempts).
|
Year |
Viewership |
Att |
TD |
Cmp |
Int |
YG |
NYA |
4QC |
|
2015 |
18.1 |
493.0 |
24.1 |
313.7 |
11.1 |
257.5 |
6.6 |
1.9 |
|
2016 |
16.5 |
525.1 |
23.3 |
333.9 |
11.1 |
253.3 |
6.5 |
2.3 |
|
2017 |
15.0 |
477.6 |
20.8 |
300.1 |
10.9 |
233.4 |
6.2 |
1.3 |
|
2018 |
15.8 |
484.5 |
24.3 |
319.2 |
10.7 |
258.4 |
6.7 |
1.9 |
|
2019 |
16.5 |
492.6 |
23.1 |
315.8 |
10.6 |
252.6 |
6.5 |
1.8 |
|
2020 |
15.6 |
479.4 |
24.5 |
316.3 |
9.7 |
248.3 |
6.6 |
1.6 |
|
2021 |
17.1 |
512.2 |
23.9 |
336.1 |
11.3 |
241.3 |
6.3 |
1.8 |
|
2022 |
16.7 |
448.4 |
19.7 |
292.0 |
9.3 |
225.9 |
6.2 |
2.4 |
|
2023 |
17.9 |
455.3 |
19.7 |
296.8 |
9.8 |
227.6 |
6.1 |
1.5 |
|
2024 |
17.5 |
455.6 |
22.4 |
302.7 |
9.5 |
225.4 |
6.4 |
1.9 |
As Table 3 shown, Viewership declined from 18.1 million in 2015 to 15.0 million in 2017, with a partial recovery to 17.9 million in 2023 and 17.5 million in 2024, showing fluctuations. Attempts (Att) peaked in 2016, dipped in 2022, and stabilized around 455 in 2023–2024, reflecting varying passing volumes. Touchdowns (TD) ranged from 19.7 (2023) to 24.5 (2020), indicating stable scoring output. Completions (Cmp) reached highest in 2021 (336.1), lowest in 2022 (292.0), showing variability tied to passing strategies. Interceptions (Int) declined slightly from 11.1 (2015) to 9.5 (2024), suggesting improved ball security or defensive changes. Yards per Game (YG) decreased from 257.5 (2015) to 225.4 (2024), possibly reflecting shorter, more efficient plays. Net Yards per Attempt (NYA) is stable, ranging from 6.1 (2023) to 6.7 (2018), indicating consistent passing efficiency. Fourth Quarter Comebacks (4QC) is fluctuated between 1.3 (2017) and 2.4 (2022), highlighting variability in clutch performance.
4. Competitive factors analysis
4.1. Box plots
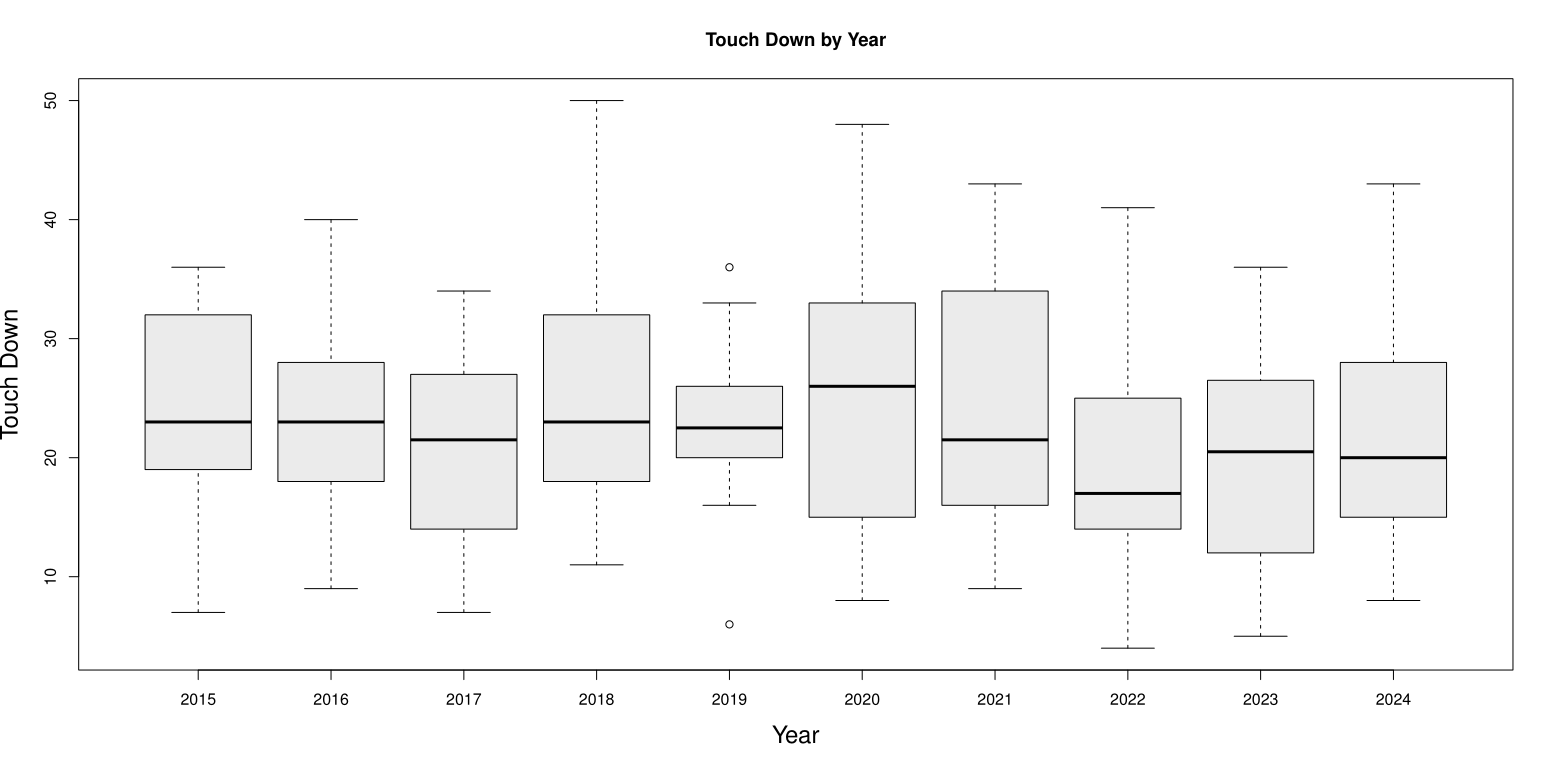
The box plot for TD reveals a median of 22 touchdowns, with the interquartile range (IQR) spanning approximately 16 to 29, based on the mean (22.5) and standard deviation (8.8). The distribution is slightly positively skewed (0.3) with negative kurtosis (-0.3), indicating a flatter shape and a tail toward higher values. Outliers are present at the upper end (up to 50), representing exceptional seasons by elite quarterbacks, while the minimum of 4 suggests limited opportunities for some players. This suggests TD performance is relatively consistent but with notable high performers.
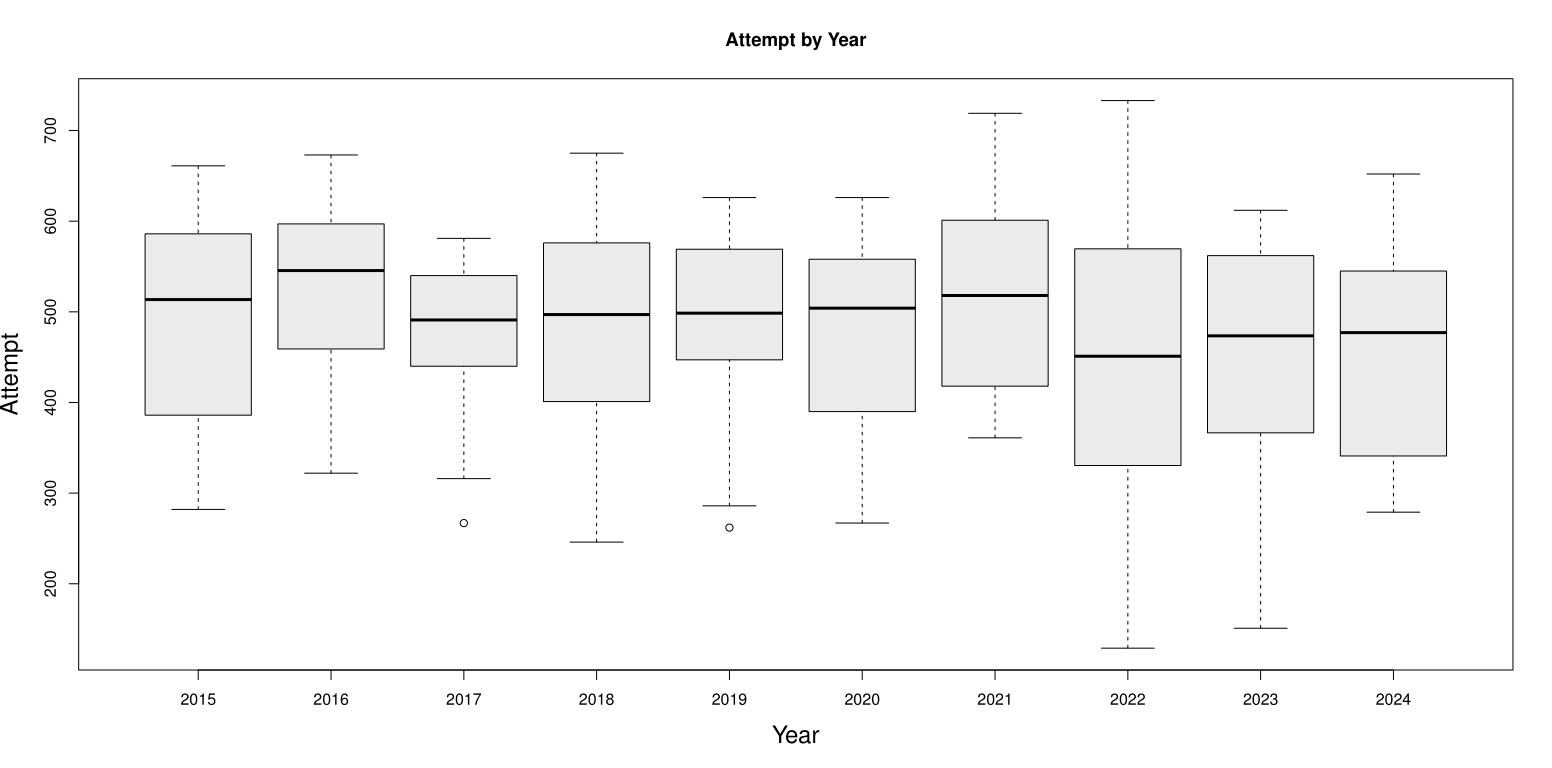
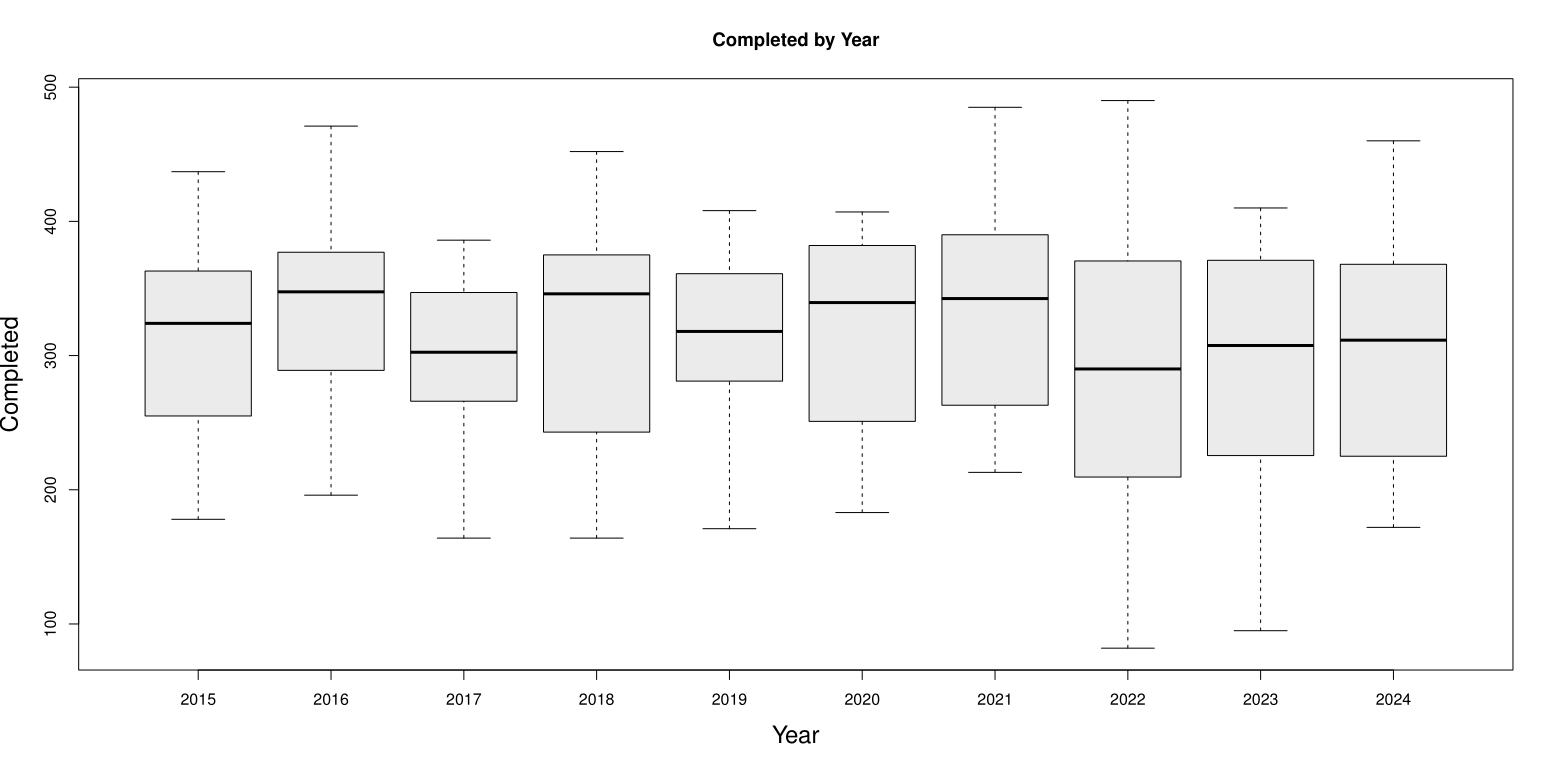
For attempts (Att), the box plot shows a median of 494, with a wider IQR due to higher variability (SD 109.1). Negative skewness (-0.4) and kurtosis (-0.3) indicate a distribution pulled toward lower values, with minima at 129 (likely injury-affected seasons) and maxima at 733. Completions (Cmp) mirror this pattern, with a median of 319, negative skewness (-0.3), and outliers in high-volume passing seasons. These plots underscore the role of playing time in passing volume, with most quarterbacks clustering around 300-500 attempts/completions.
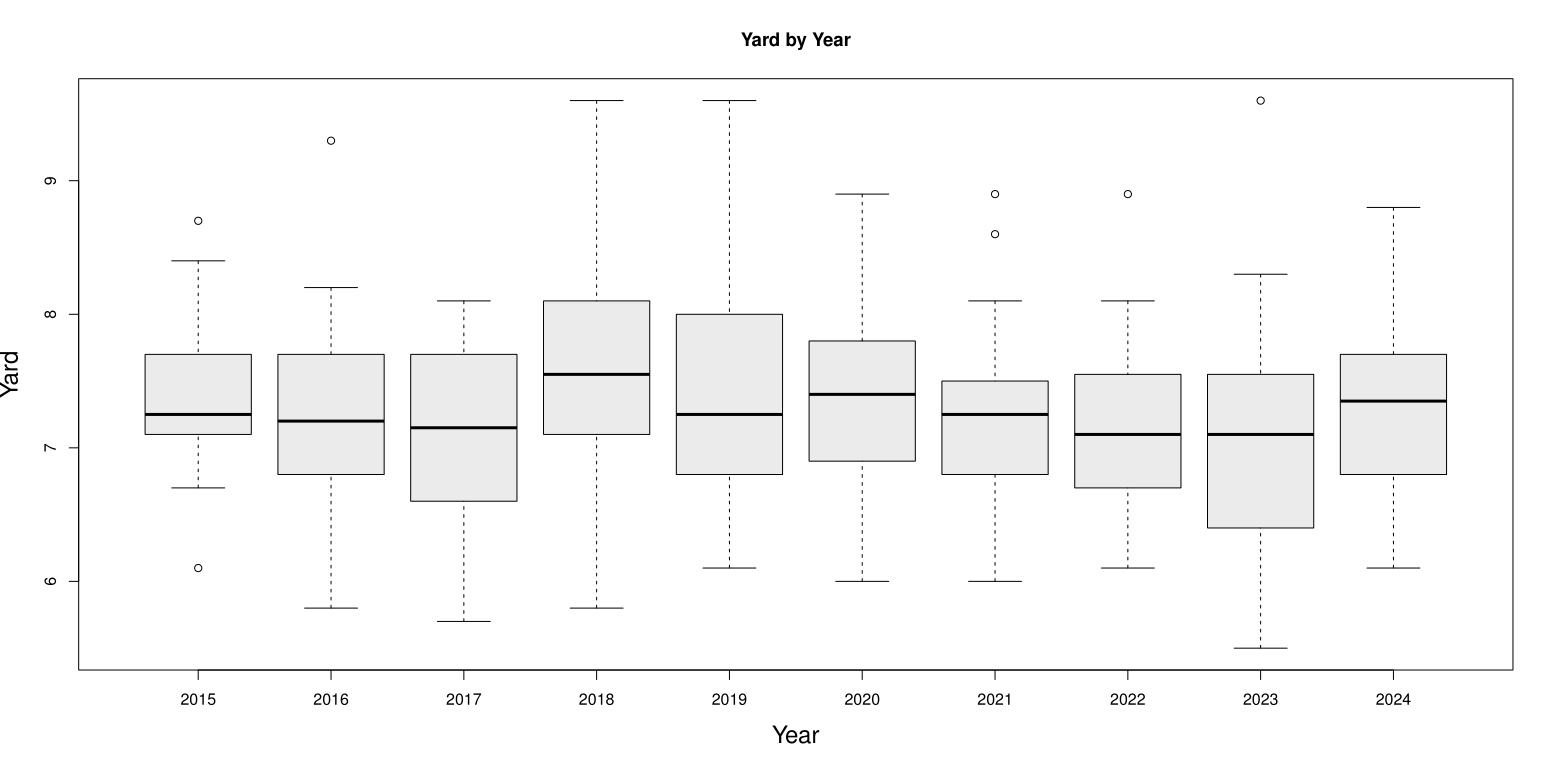
For yards (Yds), the median is 3682, with negative skewness (-0.3) and kurtosis (-0.6), showing variability (SD 881.9) from 850 to 5316. Yards per game (Y/G) has a median of 243.7, near-symmetric (skew -0.1). NY/A, an efficiency metric, is tightly distributed (median 6.36, SD 0.8), with slight positive skewness (0.1), ranging from 4.07 to 8.81, reflecting consistent but varying efficiency levels.
4.2. Correlation table
|
Viewership |
TD |
Att |
Cmp |
Int |
YG |
NYA |
4QC |
|
|
Viewership |
1 |
|||||||
|
TD |
-0.125 |
1 |
||||||
|
Att |
-0.105 |
0.667 |
1 |
|||||
|
Cmp |
-0.070 |
0.931 |
0.788 |
1 |
||||
|
Int |
-0.113 |
0.872 |
0.494 |
0.721 |
1 |
|||
|
YG |
-0.168 |
0.727 |
0.812 |
0.690 |
0.644 |
1 |
||
|
NYA |
-0.198 |
0.527 |
0.906 |
0.591 |
0.383 |
0.873 |
1 |
|
|
4QC |
0.270 |
0.156 |
0.101 |
0.212 |
-0.062 |
0.145 |
0.196 |
1 |
The correlation analysis in Table 4 indicates weak relationships between viewership and most quarterback metrics. Negative coefficients dominate, such as -0.198 for NY/A and -0.168 for Y/G, implying that higher efficiency or yardage may coincide with lower viewership, possibly due to less competitive or exciting games. TD and Cmp show even weaker negatives (-0.125 and -0.070), suggesting passing success does not strongly drive ratings.
In contrast, 4QC has a positive correlation (0.270), the strongest observed, indicating that late-game drama enhances viewer appeal. Inter-variable correlations are stronger and positive, reflecting interconnected performance aspects. Overall, these results suggest quarterback stats alone explain little variance in viewership, emphasizing the need to consider game context.
4.3. Empirical result
Viewership is aggregated annually (10 data points), while quarterback metrics are per player-season (305 data points). To perform regression, aggregate the quarterback metrics to annual means, resulting in 10 data points for each metric to match the viewership data. Dependent Variable (Y) is Viewership (average viewers per game in millions). Independent Variables (X) are Att, TD, Cmp, Int, Y/G, NY/A, 4QC. The multi-regression used in the analysis is as followed:
where
|
Coefficients |
P-value |
|
|
Intercept |
64.64 |
0.44 |
|
TD |
-0.02 |
0.89 |
|
Att |
0.89 |
0.62 |
|
Cmp |
-0.04 |
0.88 |
|
Int |
0.36 |
0.88 |
|
YG |
0.04 |
0.79 |
|
NYA |
-9.98 |
0.56 |
|
4QC |
1.75 |
0.51 |
|
Adjusted R Square |
0.41 |
|
|
Significance F |
0.12 |
|
Note. ***p<0.001, **p<0.01, *p<0.05
As the result shown in Table 5, 4QC has a positive but not marginally significant effect. Other coefficients are non-significant negative, and the model explains 41% of variance (R²=0.412), though adjusted R² is lower due to many predictors.
Then, the second regression to further investigate the impact of NYA and 4QC on viewership is:
where
|
Coefficients |
P-value |
|
|
Intercept |
22.31 |
0.09 |
|
NYA |
-1.13 |
0.55 |
|
4QC |
0.89 |
0.44 |
|
Adjusted R Square |
0.14 |
|
|
Significance F |
0.66 |
|
Note. ***p<0.001, **p<0.01, *p<0.05
As the result shown in Table 6, 4QC has a positive but not marginally significant effect. NYA has a non-significant negative impact. The model explains 14% of variance (R²=0.14). Practically, these findings suggest that while passing efficiency (NY/A) may not drive ratings, dramatic elements like comebacks (4QC) could, reinforcing the paper's emphasis on non-competitive factors (e.g., suspense) over raw stats.
5. Non-competitive factors analysis
5.1. Game interruptions
In National Football League (NFL)’s game television broadcasts, frequent commercial advertisements and game stops are prominent features and have a great effect on audiences’ viewing experiences and overall satisfaction. The research indicates that in a typical NFL game, the advertisement time takes one-third in the overall time—about 63 minutes. (Bisciotti, 2017). These frequent stoppages include advertisement, emergencies, referees’ reviews, two-minute warning. Although they are important parts in game rules and commercial works, it can still influence audiences’ feelings and satisfaction. These decrease people’s viewing experiences. (Tracy, 2016)
The audience’s perception of interruptions in NFL games varies. On one hand, some audiences use this time to have a rest or work on personal jobs. On the other hand, too many interruptions may cause audiences to feel upset, especially in the critical moments when the game’s pace is heightened. For instance, the NFL has received a lot of complaints about the interruptions for commercial advertisements being too long, and it announced that they are trying to adjust the stoppage frequency and length. These include decreasing the number of stops from five to four to increase the viewing experiences without losing revenue from commercial advertisements. (Cleveland.com, 2017; Variety, 2017). Nevertheless, these effects for adjustments and audiences’ acceptance of them still require ongoing evaluations.
Also, with the widespread adoption of streaming media technology, have already become important factor which influence viewer satisfaction. A report by InterDigital indicates that more than half of streaming sports viewers have faced technical issues, which undoubtedly negatively impacts viewership rates, especially among younger audiences who have higher expectations for a seamless viewing experience.
5.2. Changes in scores
One of the main driving forces behind the attraction of sporting events is the uncertainty of the outcome, a concept referred to in sports economics as the "Uncertainty of Outcome Hypothesis" (UOH). This hypothesis was first proposed by Rottenberg, suggesting that audiences derive greater enjoyment from watching games with a higher degree of suspense regarding the outcome. Therefore, they are more likely to watch highly competitive games with unpredictable results. In the NFL, the influence of score fluctuations and competitive balance on viewership is really obvious.
When the score of a game is close and the teams are evenly matched, audience engagement and television viewership often reach the peak. For instance, research has shown that the more competitive a game is, the higher the television viewership. This suggests that the NFL's implementation of mechanisms such as salary caps and draft systems to promote competitive balance among teams serves not only to maintain fairness in the game but also to continuously attract audiences and ensure that every game remains enough entertaining.
However, the impact of uncertainty of outcome (UOH) is not absolute. Some studies suggest that UOH's influence on viewership may be more obvious at particular stages of a game, especially as the game closes its end, the score gap narrows, and suspense increases, significantly enhancing audience interest (Within-game uncertainty of outcome and the demand for nationally televised NBA basketball viewing, n.d.). Additionally, factors such as geographical loyalty to teams, the personal attraction of star players, and the strong identification of fans with specific teams may also affect the effect of score changes on viewership to some extent. Even in one-sided games, if they feature teams or players that fans are particularly invested in, viewership may still remain relatively high.
5.3. The celebrity effect
The celebrity effect plays an increasingly significant role in the modern sports industry and has greatly impacted traditional viewership of the NFL. The involvement or attention of star athletes, entertainment celebrities, and even political figures can attract additional exposure and viewers to sporting events.
The most notable case in recent times is the relationship between pop music superstar Taylor Swift and Kansas City Chiefs player Travis Kelce. Swift's frequent appearances at NFL games have significantly boosted the NFL's popularity, especially among non-traditional sports fans. According to USA Today, the proportion of female viewers of the NFL has approached 50%, with part of this growth attributed to the "Taylor Swift effect. by IDX further indicates that Swift's presence has resulted in an increase of over 2 million female viewers and has added hundreds of millions of dollars in brand value to the NFL.
Apart from celebrities in the entertainment industry, the retirement of sports stars can also impact viewership. For instance, Tom Brady, one of the greatest quarterbacks in NFL history, has undoubtedly caused widespread attention with his retirement. Data from EDO indicates that games featuring Brady attracted an average of 2 million more viewers than those without him over the past six regular seasons. His retirement could theoretically result in the loss of some loyal viewers. However, some analysts suggest that the overall brand influence of the NFL and the depth of the league are sufficient to decrease the impact of individual superstars' retirements, making a great decline in viewership unlikely. This suggests that while superstars can make considerable personal influence, the NFL, as a mature sports league, owes its appeal more to the competitiveness of the games, the league's marketing strategies, and its extensive fan base.
The positive impact of the celebrity effect relies in its ability to expand the audience base, attract non-traditional sports fans, and create new business opportunities for the league. However, the sustainability and depth of this effect require further examination. Although celebrities can generate short-term peaks in viewership and media attention, the long-term sustainability of viewership relies mainly on the quality of the games, competitive balance, and the league's ongoing innovation.
6. Conclusion
Our analysis of NFL data from 2015 to 2024 indicates that television viewership is shaped by a complex interplay of on-field performance and off-field dynamics.
On the competitive front, most quarterback performance metrics (e.g., completions, touchdowns) show weak negative correlations with viewership, suggesting that raw offensive output alone does not drive higher ratings. However, fourth-quarter comebacks—a marker of late-game drama—exhibit a modest positive correlation, highlighting the importance of suspenseful, high-stakes moments in engaging viewers.
Off the field, non-competitive factors further influence viewership: games with fewer interruptions, tighter score differentials, and notable celebrity involvement consistently attract larger audiences.
These insights offer actionable strategies for the NFL and its broadcast partners:
i. Prioritize enhancing on-field excitement, particularly by fostering late-game drama.
ii. Streamline game flow by reducing unnecessary interruptions, balancing commercial interests with viewer experience.
iii. Strategically leverage star power and cultural relevance to broaden audience appeal, especially among non-traditional fans.
References
[1]. Mills, B. D., Ellenbogen, R. G., & Guskiewicz, K. M. (2021). The National Football League's concussion protocol: A systematic review and meta-analysis. Neurosurgery, 88(6), 1131–1139. https: //doi.org/10.1093/neuros/nyab069
[2]. Lehman, E. J., Kim, N., & Baron, S. L. (2017). Effect of the 2009 National Football League rule change on concussion rates. The American Journal of Sports Medicine, 45(7), 1531–1536. https: //doi.org/10.1177/0363546516688508
[3]. Beyer, S. (2016, October 20). The NFL's TV ratings are dropping, and it's because of oversaturation. Forbes.
[4]. Pelechrinis, K., & Papalexakis, E. (2016). Footballonomics: A new framework for mining and analyzing football data. arXiv preprint arXiv: 1601.04302.
[5]. Pagels, J. (2018). The impact of scheduling and rule changes on NFL television ratings. Journal of Sports Analytics, 4(2), 125–138.
[6]. Fortunato, J. A. (2011). The fantasy football phenomenon and its effect on the National Football League. Journal of Sponsorship, 4(2), 164–174.
[7]. Pro Football Network. (2022, September 20). The Tom Brady effect: How the GOAT has impacted TV ratings since leaving the Patriots.
[8]. Dufur, M. J., Spjeldnes, S., & Bahr, S. J. (2015) The visible hand of the market: The role of sports teams in crime control. Sociology of Sport Journal, 32(1), 23–42. https: //doi.org/10.1123/ssj.2013-0136
[9]. Canes-Wrone, B., Clark, J. R., & Kelly, S. P. (2021). A fourth-down gamble: The perennial conservatism of NFL coaches. Journal of Sports Analytics, 7(3), 173–187. https: //doi.org/10.3233/JSA-200466
[10]. Lopez, M. J. (2021). Chasing the ghost: Analyzing the effect of pressure on quarterback performance in the National Football League. Journal of Quantitative Analysis in Sports, 17(1), 1–17. https: //doi.org/10.1515/jqas-2019-0078
[11]. Pelechrinis, K. (2020). Quantifying the role of balance in the evolution of the National Football League. EPJ Data Science, 9(1), 1–18. https: //doi.org/10.1140/epjds/s13688-020-00244-9
[12]. Albert, M. A., & Angelis, L. (2019). Sensitivity analysis of the NFL's passer rating formula. Journal of Sports Analytics, 5(4), 267–282. https: //doi.org/10.3233/JSA-190240
Cite this article
Lu,Y.;Zeng,X. (2025). The Impact of Quarterback Performance Metrics on NFL Broadcast Viewership: A Decade-Long Correlation and Regression Analysis (2015–2024). Advances in Economics, Management and Political Sciences,231,27-38.
Data availability
The datasets used and/or analyzed during the current study will be available from the authors upon reasonable request.
Disclaimer/Publisher's Note
The statements, opinions and data contained in all publications are solely those of the individual author(s) and contributor(s) and not of EWA Publishing and/or the editor(s). EWA Publishing and/or the editor(s) disclaim responsibility for any injury to people or property resulting from any ideas, methods, instructions or products referred to in the content.
About volume
Volume title: Proceedings of ICEMGD 2025 Symposium: Resilient Business Strategies in Global Markets
© 2024 by the author(s). Licensee EWA Publishing, Oxford, UK. This article is an open access article distributed under the terms and
conditions of the Creative Commons Attribution (CC BY) license. Authors who
publish this series agree to the following terms:
1. Authors retain copyright and grant the series right of first publication with the work simultaneously licensed under a Creative Commons
Attribution License that allows others to share the work with an acknowledgment of the work's authorship and initial publication in this
series.
2. Authors are able to enter into separate, additional contractual arrangements for the non-exclusive distribution of the series's published
version of the work (e.g., post it to an institutional repository or publish it in a book), with an acknowledgment of its initial
publication in this series.
3. Authors are permitted and encouraged to post their work online (e.g., in institutional repositories or on their website) prior to and
during the submission process, as it can lead to productive exchanges, as well as earlier and greater citation of published work (See
Open access policy for details).
References
[1]. Mills, B. D., Ellenbogen, R. G., & Guskiewicz, K. M. (2021). The National Football League's concussion protocol: A systematic review and meta-analysis. Neurosurgery, 88(6), 1131–1139. https: //doi.org/10.1093/neuros/nyab069
[2]. Lehman, E. J., Kim, N., & Baron, S. L. (2017). Effect of the 2009 National Football League rule change on concussion rates. The American Journal of Sports Medicine, 45(7), 1531–1536. https: //doi.org/10.1177/0363546516688508
[3]. Beyer, S. (2016, October 20). The NFL's TV ratings are dropping, and it's because of oversaturation. Forbes.
[4]. Pelechrinis, K., & Papalexakis, E. (2016). Footballonomics: A new framework for mining and analyzing football data. arXiv preprint arXiv: 1601.04302.
[5]. Pagels, J. (2018). The impact of scheduling and rule changes on NFL television ratings. Journal of Sports Analytics, 4(2), 125–138.
[6]. Fortunato, J. A. (2011). The fantasy football phenomenon and its effect on the National Football League. Journal of Sponsorship, 4(2), 164–174.
[7]. Pro Football Network. (2022, September 20). The Tom Brady effect: How the GOAT has impacted TV ratings since leaving the Patriots.
[8]. Dufur, M. J., Spjeldnes, S., & Bahr, S. J. (2015) The visible hand of the market: The role of sports teams in crime control. Sociology of Sport Journal, 32(1), 23–42. https: //doi.org/10.1123/ssj.2013-0136
[9]. Canes-Wrone, B., Clark, J. R., & Kelly, S. P. (2021). A fourth-down gamble: The perennial conservatism of NFL coaches. Journal of Sports Analytics, 7(3), 173–187. https: //doi.org/10.3233/JSA-200466
[10]. Lopez, M. J. (2021). Chasing the ghost: Analyzing the effect of pressure on quarterback performance in the National Football League. Journal of Quantitative Analysis in Sports, 17(1), 1–17. https: //doi.org/10.1515/jqas-2019-0078
[11]. Pelechrinis, K. (2020). Quantifying the role of balance in the evolution of the National Football League. EPJ Data Science, 9(1), 1–18. https: //doi.org/10.1140/epjds/s13688-020-00244-9
[12]. Albert, M. A., & Angelis, L. (2019). Sensitivity analysis of the NFL's passer rating formula. Journal of Sports Analytics, 5(4), 267–282. https: //doi.org/10.3233/JSA-190240