


1. Introduction
The "ESG" concept, which stands for Environmental, Social, and Governance, is an investment philosophy and corporate evaluation criterion that focuses on the performance of enterprises in terms of environmental protection, social responsibility, and corporate governance [1]. This concept integrates considerations from the three dimensions of environment, society, and governance [2-3]. In order to better manage risks and generate sustainable long-term returns, the concept of corporate ESG is also gradually becoming a key indicator for measuring corporate sustainability and social responsibility worldwide. As global climate change, resource depletion, social inequality and corporate governance issues become increasingly prominent, investors, consumers and regulators are paying unprecedented attention to the non-financial performance of enterprises.
Strategy is a firm’s overarching action plan and model for engaging with the external environment [4]. As ESG’s emerging value assessment intersects with established business strategies, how and why do different strategies shape ESG performance? Does strategy directly determine ESG investment willingness/ability, or act indirectly through mediators like innovation or financial status? How do these effects vary across institutional environments and industries? By integrating strategic management and sustainable development theories, this paper constructs a framework to unpack these issues, aiming to offer new theoretical insights into corporate strategy’s non-market impacts and practical guidance for balancing business success with social value in high-quality development.
The value and significance of this study are reflected in both theoretical and practical aspects.
At present, there is a lack of theoretical dialogue and empirical integration in the field of strategic management and sustainable finance [5-6]. This study introduces classic theories such as Myers-Snow strategic typology and Porter's competitive strategy into the ESG analysis framework to test their effectiveness in non-financial performance interpretation. Second, deepen the causal mechanism. Breaking through the limitations of existing research that mainly focuses on the association between ESG and financial performance, by constructing mediating and moderating models, reveal the complete causal chain of "strategy → mechanism →ESG performance" and analyze the internal mechanism of action. Thirdly, enrich the study of strategic consequences. It helps managers clarify the potential impact of strategic choices on ESG, promotes the alignment of business goals with sustainable development goals, and avoids opposition and disconnection. Second, provide analytical tools for investors. Build a "strategy-oriented ESG" framework to predict corporate ESG performance through strategic types such as exploratory/differentiated, assist in identifying "greenwashing" behavior, and optimize investment decisions. Thirdly, provide a basis for policy-making.
2. Research hypotheses
The business strategy of an enterprise is the fundamental guide to its resource allocation and behavioral patterns [7]. Therefore, different types of strategies inherently contain affinity or exclusion for different dimensions of ESG. We can put forward the following theoretical assumptions based on the core logic of various strategies.
Hypothesis 1: Explorers or differentiated strategy enterprises have better ESG performance. Such strategies are centered on "novelty" and "uniqueness", and are more inclined to use ESG as a source of differentiating advantage in order to build a unique brand, technology, or customer experience: actively investing in green technologies in the environmental dimension to develop environmentally friendly products and explore new markets; The social dimension focuses on employee benefits and supply chain responsibility to maintain brand reputation; The governance dimension builds transparent and flexible structures to attract long-term investors and systematically enhance ESG performance [8].
Hypothesis 2: Defenders or cost-leading strategy companies have a dual ESG performance: efficiency-related environmental indicatorsmay be better, but social and partial environmental indicators that require additional investment perform poorly. The core logic is "stability" and "savings" : the pursuit of efficiency drives environmental improvements such as reduced energy consumption, but cost pressures make it only meet the minimum ESG compliance requirements, or even cut long-term investments in the social dimension [9].
Hypothesis 3: The ESG performance of the analyst strategy enterprise tends to the industry average, showing equilibrium or following characteristics. As a "smart follower", it is defensive in a stable business while selectively imitating the proven ESG practices of explorers , and its ESG performance is influenced by industry trends and benchmark enterprises, neither a leader nor a laggner [10].
Hypothesis 4: Responder strategy companies have the worst and most volatile ESG performance. These companies lack a coherent strategy, ESG investment is driven by external pressures , and it is difficult to form a systematic management system, resulting in long-term low ESG levels and sharp fluctuations due to event shocks.
3. .Indicator construction and methodology determination
3.1. Variable definitions
To systematically test the hypothesis and explore its underlying mechanism, this paper constructs a comprehensive research model that includes mediating and moderating effects.
3.1.1. Explained variables (ESG performance)
ESG Score: A comprehensive score reflecting an enterprise’s overall ESG performance, with data sourced from third-party institutions such as Wind, Huazheng, MSCI, and Sustainalytics.
3.1.2. Explanatory variables (Strategic Types)
Strategy Type: The type of business strategy adopted by the enterprise, measured through two methods: Text analysis—building a dictionary based on the "Management Discussion and Analysis" section of annual reports, calculating word frequency scores, and performing cluster analysis to construct continuous indicators; Questionnaire survey—self-categorization by senior executives through questionnaires. Porter Strategy: Strategic tendencies based on Porter’s theory, measured by constructing word frequency metrics for differentiation and cost leadership through text analysis.
3.1.3. Mediating variables (transmission mechanisms)
Innovation: Technological innovation activities and outputs of enterprises, measured using indicators such as R&D investment to sales revenue ratio and number of patent applications from CSMAR and Wind databases. Performance: Financial performance of enterprises, measured using indicators such as return on total assets (ROA), return on net assets (ROE), and Tobin’s Q value from CSMAR and Wind databases. Financing Constraints: The difficulty for enterprises to obtain external financing, measured by calculating common proxy variables (e.g., SA index, WW index) using CSMAR financial data, or based on bank loan and bond issuance costs. Risk Taking: The level of risk-taking of enterprises, measured using indicators such as earnings volatility, capital expenditure to total assets ratio, and long-term debt ratio derived from CSMAR financial data. Agency Costs: Agency costs between shareholders and managers, measured using indicators such as management expense ratio, asset turnover ratio, and free cash flow calculated from CSMAR financial data.
3.1.4. Moderating variables (contextual factors)
Institutional Environment: The quality of the institutional environment in the region where the enterprise is located, measured using indicators such as the marketization index and rule of law environment score. Digitalization: The level of digital transformation of enterprises, measured using the frequency of digital transformation-related keywords in annual report text analysis or the proportion of digital-related assets in intangible assets. Industry: Industry characteristics of the enterprise, measured using industry classification dummy variables (e.g., high-pollution industry = 1) or industry competition levels (e.g., Herfindahl-Hirschman Index [HHI]). Ownership: The ownership nature of the enterprise, measured using a dummy variable (state-owned enterprise = 1, private enterprise = 0), with data sourced from CSMAR.
Based on the above variables, a more refined theoretical model can be constructed. For example, the Explorer strategy may improve environmental performance (e-score) by enhancing technological innovation (mediators). And the intensity of this mediating effect may be influenced by the institutional environment (regulation) : in regions with stricter environmental regulations, companies have greater motivation and pressure to translate their innovations into environmental performance that meets regulatory requirements, making this mediating path more pronounced.
3.2. Research method determined
3.2.1. Sample and data sources
All listed companies on the Shanghai and Shenzhen A-share markets in China from 2016 to 2023 were selected as the initial sample. To ensure data quality, the following screening was carried out: ① Financial industry companies were excluded because their financial statement structure and ESG risk exposure were significantly different from those in other industries. ② ST, *ST and PT companies were excluded because of their abnormal operating conditions. ③ Companies that were listed or delisted during the sample period were excluded to ensure the balance of panel data. ④ Samples with severely missing key variable data were excluded.
ESG data was mainly obtained from domestic authoritative databases such as Wind Information Financial Terminal or Huazheng ESG Rating. For robustness tests, ratings of Chinese companies from major international rating agencies MSCI and Sustainalytics are collected. The different rating systems need to be standardized for comparison. Financial and corporate governance data are sourced from CSMAR (Guotai 'an Database), the most authoritative research database for listed companies in China, with some data supplemented by Wind database. The strategic data sources are annual reports of listed companies, which can be downloaded in bulk from the official websites of the Shanghai Stock Exchange, the Shenzhen Stock Exchange or Juchao Information Network. The core analysis text is the "Management Discussion and Analysis" section in the annual report. Macro and institutional data such as the provincial marketization index are derived from the China Provincial Marketization Index Report.
3.2.2. Data preprocessing
To ensure the reliability of the measurement results, rigorous preprocessing of the raw data is required. (1) Missing value handling: For a small number of randomly missing continuous variables, mean, median or linear interpolation methods are used to fill in the missing values. For cases with a large number of missing values, use more robust multiple interpolation to better preserve the uncertainty of the data. (2) Outlier handling: To prevent extreme values from having an excessive impact on the regression results, all continuous variables should be truncated at the top and bottom 1% or 5% quantiles. (3) Variable normalization: For variables that need to compare coefficient sizes within the same model, such as strategic scores in different dimensions, or to reduce multicollinearity, Z-score normalization can be performed on the variables, subtracting the mean and then dividing by the standard deviation.
3.2.3. Model setup and analysis
To test the direct impact of corporate business strategy on ESG performance, construct the following panel data fixed effects model:
ESG_it represents company i 'S ESG performance in year t, which can be the total ESG score or the individual scores of E, S, and G. Strategy_it is the core explanatory variable, which can be the "comprehensive score of strategic inclination" or the dummy variables of "exploratory" and "analytical" when examining Myers-Snow strategy, with "defensive" as the benchmark group; When testing Porter strategy, it is Diff_Score or Cost_Score.
Controls_itk stands for - series of control variables. Year_t and Industry_i respectively represent the fixed effects for the year and industry, used to control macroeconomic shocks that change over time and industry characteristics that do not change over time. ε_it is the random disturbance term. This article mainly focuses on the sign and significance of the coefficient β 1. If β1 is significantly positive, it indicates that the strategy type has a positive promoting effect on ESG performance, and vice versa.
4. .Quantitative empirical research
4.1. Descriptive statistics
Before conducting the regression analysis, descriptive statistics were performed on the primary variables in this paper to understand the basic distribution characteristics of the data. The sample covered non-financial A-share listed companies in China from 2016 to 2023, and after data cleaning, A total of 18,102 companies' annual observations were obtained as unbalanced panel data. The following table shows the statistical characteristics of the main variables.
|
Variables |
Symbols |
Number of observations |
Mean |
Standard deviation |
Minimum value |
Maximum value |
|
ESG score |
ESG Score |
25,480 |
6.25 |
1.88 |
1.00 |
9.00 |
|
Strategic Inclination score |
MS Score |
25,480 |
0.05 |
1.52 |
-4.12 |
4.89 |
|
Differentiation Strategy score |
Diff_Score |
25,480 |
0.31 |
0.45 |
0.00 |
2.51 |
|
Cost leadership strategy score |
Cost Score |
25,480 |
0.19 |
0.33 |
0.00 |
2.15 |
|
Enterprise innovation (R&D investment) |
RD_Input |
25,480 |
19.56 |
1.67 |
0.00 |
23.45 |
|
Digital transformation |
Digitalization |
25,480 |
2.89 |
1.21 |
0.00 |
6.78 |
|
Company size (logarithm of total assets) |
Size |
25,480 |
22.50 |
1.35 |
19.80 |
26.10 |
|
Asset-liability ratio |
Lev |
25,480 |
0.45 |
0.20 |
0.05 |
0.95 |
|
Return on total assets |
ROA |
25,480 |
0.04 |
0.06 |
-0.25 |
0.28 |
Note: For simplicity, only some core variables are shown here. All consecutive variables are undertailed by 1% and 99%.
It can be seen from the table that there are significant differences among companies in ESG performance and strategic choices. The standard deviation of the total ESG score is 1.88, indicating significant differences in ESG levels among different companies. The wide distribution of the strategic propensity score (MS_Score) indicates that the sample includes both typical exploratory and defensive companies. The mean and standard deviation of differentiation and cost leadership strategy scores also suggest that companies place varying degrees of emphasis on these two strategies in their annual reports.
4.2. Benchmark regression
This paper uses a multiple regression model controlled for year and industry fixed effects to examine the impact of different business strategies on the overall ESG score of enterprises. Table 2 reports the core results.
|
Variables |
Model (1)-MS |
Model (2)-Porter |
|
Prospector |
0.582 * * * |
|
|
(0.091) |
||
|
Analyzer |
0.215 * * |
|
|
(0.088) |
||
|
Differentiation Strategy (Diff_Score) |
0.451 * * * |
|
|
(0.075) |
||
|
Cost leadership Strategy (Cost_Score |
0.198 * |
|
|
(0.102) |
||
|
Control variables |
Controlled |
Controlled |
|
Year fixed effect |
is |
is |
|
Industry fixed effects |
is |
is |
|
Observations |
25,480 |
25,480 |
|
R-squared |
0.412 |
0.405 |
Note: Robust standard errors are in parentheses. ***, **, * indicate significant at the 1%, 5%, and 10% levels, respectively. In Model (1), the Defender is the benchmark group.
The regression results clearly reveal the systematic impact of a company's business strategy on its ESG performance, which is highly consistent with the theoretical expectations of this paper.
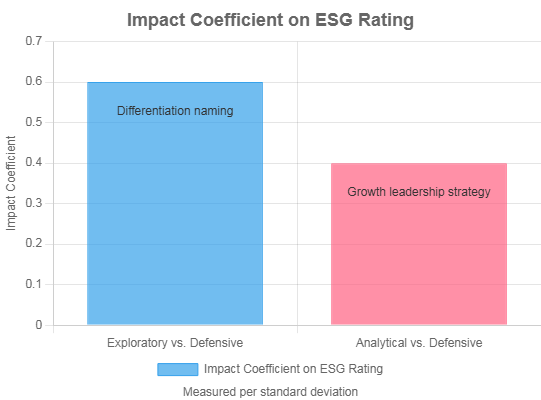
The impact of the Myers-Snow strategy. Exploratory strategies significantly promote ESG models (1) showing that exploratory companies score 0.582 points higher in ESG compared to defensive companies. The core logic is that the exploratory strategy relies on external environment sensitivity, stakeholder collaboration and long-term value investment, which naturally aligns with ESG requirements. Attracting talent requires a favorable environment, new markets require a reputation for social responsibility, and the development of cutting-edge technologies requires green innovation, all of which align with the core requirements of ESG. The analytical strategy has a weaker ESG effect, scoring only 0.215 points higher, because as a "follower", ESG behavior is more about imitating the risk-averse strategies of explorers rather than being driven by intrinsic value.
4.3. The impact of Porter's competitive strategy
Differentiation strategy and ESG Strong Positive Correlation model (2) shows that for every 1 standard deviation increase in the strategy score, the ESG score increases by 0.451 points. Differentiation is built on uniqueness, and ESG itself is a core source of differentiation that attracts responsible consumers and investors and earns a premium. Cost leadership strategies suppress ESG, with negative coefficients that are significant at the 10% level, as they overly focus on cost control and tend to view ESG investment as a non-essential cost.
To gain a deeper understanding of the path of strategic impact, this paper breaks down the total ESG score into three dimensions: environmental, social, and governance, and conducts regression on each of them. The results reveal richer heterogeneous effects:
Impact on the environmental dimension: The facilitation effect of exploratory and differentiated strategies is most significant, which is directly related to the motivation of enterprises to invest in green technologies, develop environmentally friendly products, and build sustainable supply chains. Enterprises under these strategies are more willing to incorporate environmental friendliness as part of innovation and brand building. The impact of cost leadership strategies is uncertain. Some companies may reduce costs by improving energy efficiency, while others may reduce costs by cutting environmental spending.
Impact on the social dimension: Exploratory and differentiated strategies also show strong positive effects. Exploratory companies need to attract and retain innovative talent, and therefore invest more in employee benefits, career development, and corporate culture building. Differentiation companies, on the other hand, focus heavily on brand image and customer relationships, which leads them to perform better in terms of product safety, consumer rights protection and community contribution.
Impact on the governance dimension: The direct impact of business strategy on the governance dimension is relatively weak. Corporate governance is more influenced by equity structure, regulatory requirements and historical evolution. However, this paper finds that exploratory companies may adopt more flexible and decentralized governance models to support quick decision-making and innovation, which may score less on some traditional governance indicators but are more adaptable.
4.4. Mediating effect model
Taking the examination of the mediating effect of enterprise Innovation as an example, this paper follows Baron-& Kenny's three-step method and combines the Bootstrap method for the examination: This paper examines two potential mediating paths: enterprise innovation and financing constraints, using the Bootstrap method and repeated sampling 5,000 times to estimate the confidence intervals of the indirect effects. The mediating role of corporate innovation. Assume that innovation-oriented strategies such as exploratory and differentiated ones mainly enhance ESG performance by stimulating a higher level of innovation activities within enterprises. The test results confirm that corporate innovation plays a significant partial mediating role in the relationship of "exploration/differentiation strategy → ESG performance".
|
Paths |
Effect type |
Coefficient estimation |
95% confidence interval |
Mediating effect proportion |
|
Exploratory → Innovative → ESG |
Total effect (c) |
0.582 * * * |
[0.402, 0.762] |
100% |
|
Direct effect (c') |
0.395 * * * |
[0.221, 0.569] |
67.9% |
|
|
Indirect effect (a*b) |
0.187 * * * |
[0.115, 0.259] |
32.1% |
|
|
Differentiation → Innovation → ESG |
Total effect (c) |
0.451 * * * |
[0.303, 0.599] |
100% |
|
Direct effect (c') |
0.310 * * * |
[0.178, 0.442] |
68.7% |
|
|
Indirect effect (a*b) |
0.141 * * * |
[0.088, 0.194] |
31.3% |
Note: *** indicates that the confidence interval does not contain 0.
Results show exploratory strategies significantly enhance ESG performance via the "strategy-innovation-ESG" path (direct effect 0.395), with indirect effects accounting for 32.1%, driven by R&D investment (path a → path b). Differentiation strategies follow a similar mechanism, indicating innovation is inherently embedded in their implementation, making it an endogenous driver of ESG practices.
Further, cost leadership strategies harm ESG through financing constraints: they intensify financing constraints (mediating effect -0.152), leading firms to cut ESG investment and creating a "low ESG-high financing constraints" vicious cycle. This reveals capital markets’ feedback on strategic choices affects ESG investment, underscoring the need to integrate ESG into core strategies—differentiation strategies require ESG legitimacy to secure capital, while cost leadership strategies ignoring ESG face financing risks.
4.5. Moderating effects model
The impact of corporate strategy on ESG is not a vacuum but is modulated by the company's own capabilities and the external environment. This paper focuses on two key moderating variables: digital transformation and institutional environment.
Assume that the level of digital transformation of enterprises will enhance the positive impact of innovation-oriented strategies on ESG performance. Regression results show that the coefficients of the interaction term between exploratory strategy and digital transformation (Prospector * Digitalization) and the interaction term between differentiated strategy and digital transformation (Diff_Score * Digitalization) are both significantly positive. Proving the positive moderating effect of digital transformation.
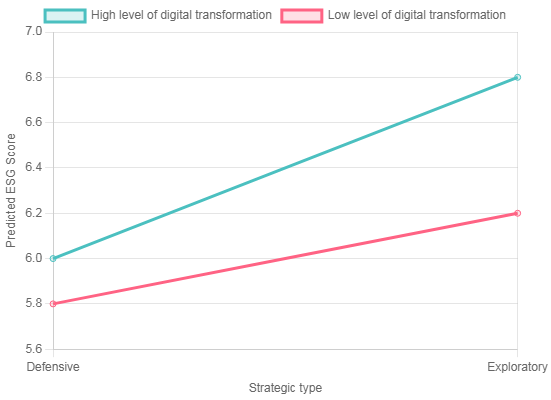
Figure 2 shows that the level of digital transformation negatively moderates the impact of strategies on ESG. In low-digital enterprises, the improvement in ESG from defensive to exploratory strategies is limited; In highly digitalized enterprises, the increase is significantly greater, indicating that digitalization is an "amplifier" of strategic dividends. The mechanism of action is that digital tools significantly increase the ESG return on investment of innovation-oriented strategies by reducing information management costs and enhancing ESG management efficiency, encouraging companies to increase investment.
5. Conclusion
Strategy determines the ESG path: Business strategy is a key prerequisite for ESG performance. Research has confirmed that offensive strategy companies have significantly higher ESG total scores and sub-scores (E, S, G) than defensive strategy companies. The former view ESG as a core element for building a long-term competitive advantage and enhancing brand value; The latter, with a focus on cost control and efficiency improvement, is more passive in ESG, which is not a direct financial return, and often adopts compliance-oriented inefficient strategies. In terms of the influence mechanism, innovation is the key bridge connecting strategy and ESG. The offensive strategy significantly improves ESG performance by driving growth in R&D investment and an increase in patent output; Financing constraints, on the other hand, reflect the value judgments of the capital market on different strategies and have a counter-effect on the ability of enterprises to invest in sustainable development - enterprises with high financing constraints have more limited ESG investment. Context-dependent is significant. Digitalization and institutional environment are "amplifiers" of strategic effects: enterprises with a high level of digital transformation efficiently implement ESG strategies through capabilities such as data analysis and intelligent manufacturing, strengthening investment motivation; In highly marketized regions, stakeholder oversight and market reward and punishment mechanisms are more sensitive, and corporate strategy is more closely linked to ESG behavior.
References
[1]. CHEVROLLIER N, ZHANG J, VAN LEEUWEN T, et al. The predictive value of strategic orientation for ESG performance over time [J]. Corporate Governance, 2020, 20(4): 632-648.
[2]. Business strategy heterogeneity and ESG disclosure [J]. International Review of Financial Analysis, 2025.
[3]. Strategic orientation, risk-taking, corporate life cycle and environmental, social and governance (ESG) practices: Evidence from ASEAN countries [J]. Business Strategy and Development, 2023.
[4]. Strategic Linkages to ESG Performance: The Role of Performance Management Systems [J]. Business Strategy and the Environment, 2025.
[5]. Wang Xiaohong, Zhao Meilin, Zhang Shaopeng, Cheng Lei. Corporate strategic Aggressiveness, digital transformation and ESG performance [J]. Soft Science, 2024.
[6]. Zhang Duolei, Xu Shaoshan, Xue Fei, et al. Strategic aggressiveness and corporate social responsibility fulfillment: From the perspective of Resource acquisition [J]. China Soft Science, 2022(6): 111-123.
[7]. Sun Jian, Wang Qiangsheng, Cao Feng, et al. Does corporate strategy affect earnings management? [J]. Management World, 2016(3): 160-169.
[8]. Wu Fei, Hu Huizhi, Lin Huiyan, et al. Enterprise Digital Transformation and Capital Market Performance: Empirical Evidence from Stock liquidity [J]. Management World, 2021, 37(7): 130-144+10.
[9]. MILES R E, SNOW C C. Organizational Strategy, Structure, and Process [M]. New York: McGraw-Hill, 1978.
[10]. KONG X W, JIANG F, ZHU L. Business Strategy, Corporate Social Responsibility, and Within-Firm Pay Gap [J]. Economic Modelling, 2022, 106: 105703.
Cite this article
Shen,W. (2025). Research on the Impact of Corporate Business Strategy Differences on ESG Performance Levels. Advances in Economics, Management and Political Sciences,231,83-92.
Data availability
The datasets used and/or analyzed during the current study will be available from the authors upon reasonable request.
Disclaimer/Publisher's Note
The statements, opinions and data contained in all publications are solely those of the individual author(s) and contributor(s) and not of EWA Publishing and/or the editor(s). EWA Publishing and/or the editor(s) disclaim responsibility for any injury to people or property resulting from any ideas, methods, instructions or products referred to in the content.
About volume
Volume title: Proceedings of ICEMGD 2025 Symposium: Resilient Business Strategies in Global Markets
© 2024 by the author(s). Licensee EWA Publishing, Oxford, UK. This article is an open access article distributed under the terms and
conditions of the Creative Commons Attribution (CC BY) license. Authors who
publish this series agree to the following terms:
1. Authors retain copyright and grant the series right of first publication with the work simultaneously licensed under a Creative Commons
Attribution License that allows others to share the work with an acknowledgment of the work's authorship and initial publication in this
series.
2. Authors are able to enter into separate, additional contractual arrangements for the non-exclusive distribution of the series's published
version of the work (e.g., post it to an institutional repository or publish it in a book), with an acknowledgment of its initial
publication in this series.
3. Authors are permitted and encouraged to post their work online (e.g., in institutional repositories or on their website) prior to and
during the submission process, as it can lead to productive exchanges, as well as earlier and greater citation of published work (See
Open access policy for details).
References
[1]. CHEVROLLIER N, ZHANG J, VAN LEEUWEN T, et al. The predictive value of strategic orientation for ESG performance over time [J]. Corporate Governance, 2020, 20(4): 632-648.
[2]. Business strategy heterogeneity and ESG disclosure [J]. International Review of Financial Analysis, 2025.
[3]. Strategic orientation, risk-taking, corporate life cycle and environmental, social and governance (ESG) practices: Evidence from ASEAN countries [J]. Business Strategy and Development, 2023.
[4]. Strategic Linkages to ESG Performance: The Role of Performance Management Systems [J]. Business Strategy and the Environment, 2025.
[5]. Wang Xiaohong, Zhao Meilin, Zhang Shaopeng, Cheng Lei. Corporate strategic Aggressiveness, digital transformation and ESG performance [J]. Soft Science, 2024.
[6]. Zhang Duolei, Xu Shaoshan, Xue Fei, et al. Strategic aggressiveness and corporate social responsibility fulfillment: From the perspective of Resource acquisition [J]. China Soft Science, 2022(6): 111-123.
[7]. Sun Jian, Wang Qiangsheng, Cao Feng, et al. Does corporate strategy affect earnings management? [J]. Management World, 2016(3): 160-169.
[8]. Wu Fei, Hu Huizhi, Lin Huiyan, et al. Enterprise Digital Transformation and Capital Market Performance: Empirical Evidence from Stock liquidity [J]. Management World, 2021, 37(7): 130-144+10.
[9]. MILES R E, SNOW C C. Organizational Strategy, Structure, and Process [M]. New York: McGraw-Hill, 1978.
[10]. KONG X W, JIANG F, ZHU L. Business Strategy, Corporate Social Responsibility, and Within-Firm Pay Gap [J]. Economic Modelling, 2022, 106: 105703.