


1. Introduction
The process of measuring the business cycle requires the definition of the cycle, the definition of procedures for detecting business cycles, and the description of methodologies for measuring business cycles.
According to Burns and Mitchell (1946), the business cycle is a pattern observable in any time series assumed to represent aggregate economic activity. Four main phases of business cycles have been noted: trough, expansion, peak, and contraction [1]. In other words, the business cycle or economic cycle refers to the transitory fluctuations of the economy around a long-run level [2].
In order to business cycle, the writer used Singapore's yearly real GDP and several of its components-exports, private consumption, and gross fixed capital creation-for the period 1981 to 1991.
The trending nature of these macroeconomic variables, however, obscures any potential cycles. Consequently, the HP filter is applied to separate the trending variables into a secular component and a cyclical component.
Several steps constitute the business cycle measurement procedure:
1. Employing the HP filter to identify the cyclical components of assorted economic variables;
2. Calculating standard deviations;
3. Observing the co-movement between the reference cycle and specific cycles, and then computing their correlation coefficient.
The remaining part of the article is structured as shown below. The second section offers a brief overview of the prior literature; the third section displays the data and methodology applied in the study; the fourth section includes the empirical analysis's results; the final section introduces the author's policy implications, and the final section presents the authors' conclusions.
2. Literature Review
The business cycle, characterized by reoccurring periods of economic prosperity accompanied by times of recession, is a feature representative of the majority of developed economies. Thereafter, economists have long been interested in measuring and explaining business cycle fluctuations.
Up until recently, by evaluating the cyclical components of macroeconomic time series, considerable academics have conducted all sorts of empirical studies of business cycles in different areas. To be more specific, Joshua Brault and Hashmat Khan examined fluctuations in the lead-lag characteristics of the United States business cycle between 1948 and 2016 [3]. Furthermore, Davaajargal Luvsannyam, Khuslen Batmunkh, and Khulan Buyankhishig adopted the quarterly real GDP from 2000Q1 to 2017Q4 to estimate the Mongolian business cycle [4].
Despite the growing interest in the business cycle, there have only been a small number of studies published that exclusively emphasize business cycles in Singapore.
The majority of researchers have concentrated on the causes of business cycles in Singapore but have disregarded an in-depth investigation of the nature of the business cycle’s fluctuation during historical periods.
Specifically, KM Choy investigated the causes of Singapore's macroeconomic volatility by adopting a six-variable structural VAR model. Choy showed that, despite the significance of demand shocks, supply disturbances accounted for more than half of the short-run output increase, indicating that the latter merits extensive research [5]. Furthermore, Hoy Keen Meng exploited a vector autoregressive (VAR) model to explore the supply-side drivers of economic cycles in Singapore, and he supports the notion that both domestic and international variables contribute to business cycles in Singapore [6].
Remarkably, with the application of band-pass filters and unobserved component models, Keen Meng Choy analyzed economic oscillations in Singapore over the period 1975–2005 and then compared them to business cycles in Hong Kong [7]. To explain further, the scholar analyzed the cross-correlations of some macroeconomic variables with Singapore’s cyclical GDP, variables including real interest rate, consumer price index (CPI), private consumption, private investment, government expenditures, and net exports ratio. Based on the empirical evidence and comparison results, Keen Meng Choy asserted that aggregate demand shocks act as the primary determinant of Singapore's business cycles [7].
Nonetheless, no recent paper explores the nature of oscillations in Singapore's business cycle over the past decade.
Thereafter, this study contributes to the business cycle literature in several ways. First, the author analyzed the most recent data from 1981 to 2021 to investigate Singapore's business cycle. In contrast to Keen Meng Choy's use of band-pass filters to detrend economic time series, the authors utilized a different technique—the HP filter—to detrend economic time series [7]. Finally, the author presented policy recommendations for Singapore's economic growth, which were absent in the preceding literature relating to the business cycle.
3. Data and Methodology
This section discusses the statistical techniques utilized in the rest of the paper to investigate business cycles.
All the data necessary for the analysis is accessible on the website of the Singapore department of statistics. The author utilized data on Singapore's yearly real GDP and several of its components, including exports, private consumption, and gross fixed capital formation, as well as CPI from 1981 to 1991. Remarkably, all the data has been seasonally adjusted.
The process of measuring the business cycle takes place in several steps.
1. Adopting the HP filter to determine the cyclical components of various economic variables;
2. Calculating standard deviations;
3. Observing the co-movement between the reference cycle and specific cycles, and then computing their correlation coefficient.
Two prominent characteristics of macroeconomic data are the trend of long-run growth in aggregate economic activity and the cyclical component, known as business cycles, which depicts oscillations in this activity over shorter periods. To study business cycles in observable data, the cyclical component is necessary to be separated from the trend.
Plentiful approaches are employed by researchers to determine business cycles, such as the linear detrending method and the Hodrick–Prescott (1997) filter. The HP filter is still recognized as a landmark in the study of business cycles and is used to extract cyclical components from a variety of macroeconomic time series. The Hodrick-Prescott (1997) method decomposes a seasonally adjusted time series (Yt) into a growth component (Tt) and a cyclical component (Ct) in such a way that [8]:
Yt = Tt + Ct , 𝑡 = 1, 2 , 3 , … , 𝑇 (1)
The original series Yt may be non-stationary and exhibit both deterministic and stochastic trends. The smoothness of the Tt is equal to the sum of the squares of its second difference, and the Ct represents deviations from the Tt.
The method determines a stochastic series (Ct) by minimizing the sum of squared deviations of the original time series (Yt) from its trend (Tt).
\( \underset{[{T_{t}}]_{t=1}^{T}}{min}{ [\sum _{t=1}^{T}{({Y_{t}}-{T_{t}})^{2}} +λ\sum _{t=2}^{T}{[({T_{t+1}}-{T_{t}})-({T_{t}}-{T_{t-1}})]^{2}} ]}, λ \gt 0 \) \( (2) \)
The value of λ reflects a trade-off between the degree of smoothness and the level of fit. To explain further, the larger the value λ, the smoother the solution series. In other words, when the value of λ → 0, Tt corresponds to the time series Yt, whereas if λ → ∞, Tt would correspond to a regression on a linear time trend (that is, a series whose second difference is 0). Commonly, the value of the smoothing parameter, is fixed to 100 (1600) for annual (quarterly) frequency data.
In this paper, the filter is computed by adopting the HP technique with λ equal to 100 on annual real GDP data from 1981 to 2021.
However, Hamilton pointed out several defects in the HP filter. His primary arguments are as follows [9]:
(1) The HP filter generates series with spurious dynamic relations that lack validity in the underlying data generation process;
(2) Filtered values at the end of the sample deviate significantly from those in the middle and exhibit misleading dynamics.
(3) A statistical formalization generally yields values for the smoothing parameter that are highly inconsistent [9].
It is worth noting that Peter C. B. Phillips and Zhentao Shi presented comprehensive responses to Hamilton's criticism of the HP filter and evaluated the performance of Hamilton's regression technique in comparison to their improved HP filter (bHP) [9,13]. Their findings indicate a strong preference for the bHP filter over the Hamilton regression, and they believe that the HP filter is still a useful empirical tool for the assessment of trends and cycles [10].
Once the cyclical component of an indicator for macroeconomic performance has been isolated from the secular trend using the HP filter, the second phase can be conducted—calculating standard deviations of cyclical components of different variables over a window of 41 years, which is a straightforward method for measuring fluctuations.
The third stage is observing and evaluating the co-movement of the reference cycle with specific cycles. Co-movement is measured by the degree of correlation between referential series and time series of cyclical indicators, and the correlation coefficients reveal the direction and extent of an economic variable’s co-movements with the reference cycle.
4. Empirical Results
4.1. Analysis of the Reference Cycle (Real GDP)
For the sake of assessing variations in cyclical fluctuations, there is still no alternative to the reference cycle method, which compares "specific cycles" in individual time series with the "reference cycle" in aggregate economic activity [11].
In the article, Singapore’s reference cycle will be determined by filtering the cyclical element from the annual GDP (Gross Domestic Product). Gross domestic product (GDP) is the market value of all final goods and services produced within a country within a certain period, and GDP is composed of consumption, investment, and government spending components as well as net exports [12]. Real GDP is a high-quality economic indicator that best characterizes the cyclical behavior of the economy [13], and is typically regarded as the most comprehensive indicator of economic activity.
Figure 1 depicts the cyclical components of Singapore's GDP over 41 years.
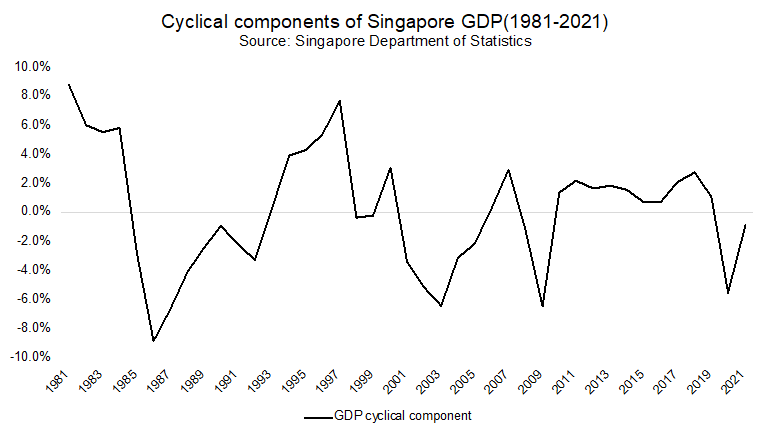
Figure 1: Cyclical components of Singapore’s real GDP.
As stated previously, business cycles include four distinct phases: trough, expansion, peak, and contraction [1]. Therefore, Singapore’s cyclical time series from 1981 to 2021 can be approximately divided into five business cycles: 1985–1992, 1993–1998, 1999–2003, 2004–2009, and 2010–2020. (Since a business cycle begins with an expansion, the author did not account for the first contraction between 1981 and 1984).
These five business cycles are associated with a deep recession that originated from a sharp fall in global demand in 1985, the early 1990s recession, the Asian financial crisis of 1997–1998, the global recession stemming from the dot-com crash in 2000, the 2008–2009 global financial crisis, and the emergence of coronavirus disease in 2020.
The foregoing study revealed that Singapore's real GDP is highly susceptible to exogenous shocks. It is attributable to the peculiarities of Singapore's economy, namely its lack of natural resources, reliance on entrepot trade, and dependency on foreign investment. Consequently, any considerable instability in the external environment could exert a detrimental impact on Singapore’s economy.
4.2. Analysis of Specific Cycles
Furthermore, a complete comprehension of the business cycle necessitates knowledge of the characteristics of specific cycles and the relationship between specific cycles and the reference cycle.
Therefore, assessing the co-movement and the correlation of plentiful cycles is indispensable. In this regard, cycles pertinent to Singapore's economic growth, such as private consumption spending, gross fixed capital formation (private investment), government consumption expenditures, and customer pricing index, merit thorough consideration.
Private consumption expenditure is the spending by households on goods and services, excluding new housing purchases.
The investment consists of expenditures on business capital, residential capital, as well as inventories.
Government consumption expenditures refer to expenses incurred by the general government on consumption of products and services provided to the general public [14].
The consumer price index (CPI) estimates the total cost of the goods and services purchased by customers [12].
The standard deviations of economic variables and correlation coefficient between real GDP and other indicators are computed in table 1.
Table 1: Standard deviation and correlation of Singapore economic indicators.
Variables | Standard deviation | SD/GDP | Correlation coefficient with GDP |
Real GDP | 0.0414 | ||
Private Consumption | 0.0378 | 0.9108 | 0.5725 |
Private investment | 0.1070 | 2.5816 | 0.7105 |
Government Expenditure | 0.0486 | 1.1720 | – 0.2759 |
CPI | 0.0204 | 0.4918 | 0.5159 |
Figure 2 and figure 3 illustrate the cycles of consumption and investment in Singapore, and the co-movement with the reference cycle.
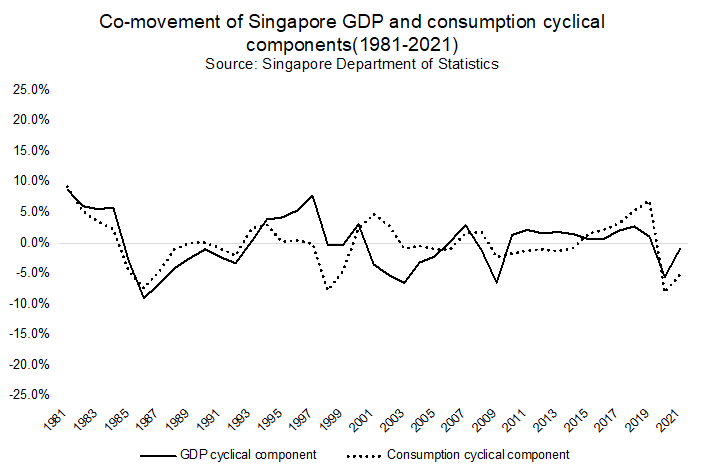
Figure 2: Co-movement between Singapore GDP and consumption cyclical components.
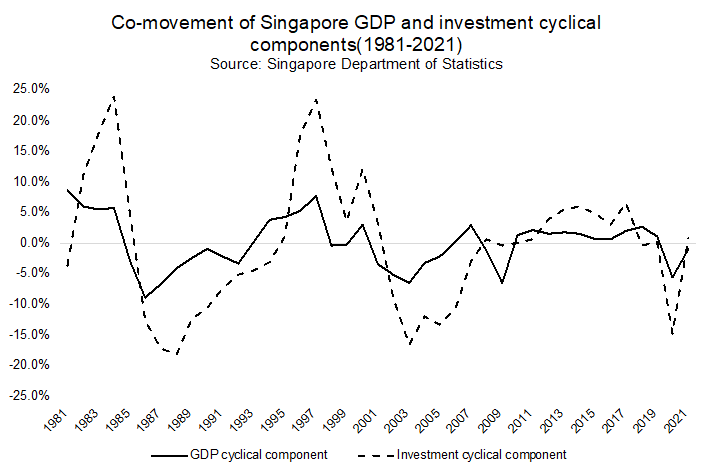
Figure 3: Co-movement between Singapore GDP and investment cyclical components.
Private consumption and investment expenditures are cyclical and, in most circumstances, move in the same direction as the reference cycle, meaning that an increase in consumption or investment results in a rise in GDP.
As shown in table 1, the correlation coefficients for consumption and investment with GDP are 0.5725 and 0.7105 respectively, suggesting correlations with GDP that are relatively significant. Then, it is reasonable to assert that investment is of stronger relevance to economic growth than consumption, at least in the short run.
Regarding volatility, the standard deviations of private consumption expenditures and investment expenditures are 0.0378 and 0.107 respectively. Therefore, private investment expenditures, with the most dramatic fluctuation, appear to be a potential source of business cycle shocks, in the filtered time series. Private consumption, conversely, might play a minor role in inducing business shocks owing to the slight fluctuation.
Next, with the purpose to quantify amplitudes compared with GDP, the following calculation can be accomplished:
Consumption standard deviation / GDP standard deviation = 0.91(3)
Investment standard deviation / GDP standard deviation = 2.58 (4)
These results demonstrate that the amplitude of the cyclical components of consumption is 0.91 times higher than that of GDP. In addition, the amplitude of the cyclical components of investment is 2.58 times higher than that of GDP. Accordingly, the cyclical components of investment fluctuate more severely than those of consumption. That is mainly due to the fact that consumer goods are necessities with inelastic demand, so the quantity demanded of these commodities is not sensitive to the changes in the economic environment. Contrarily, investment has a negligible effect on consumers’ daily lives and is of elastic demand, and thus quantity demanded for these products decreases rapidly during the economic recession.
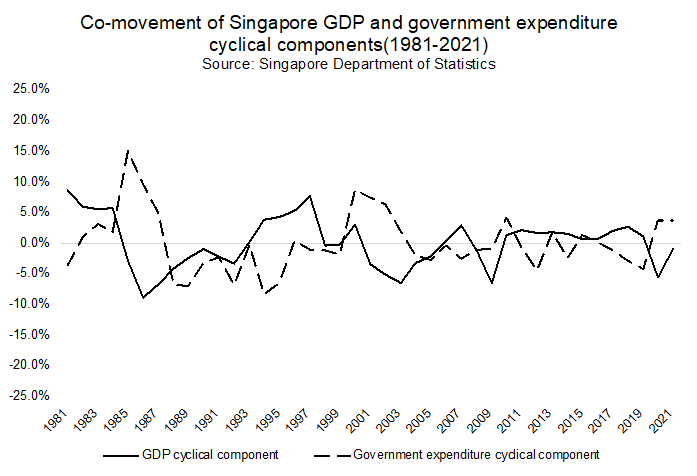
Figure 4: Co-movement between Singapore GDP and government expenditure cyclical components.
When it comes to government spending, cyclical components of government expenditure have a standard deviation of 0.0486 (as shown in table 1), implying a more dramatic variation than those of private investment and less drastic fluctuation than those of private consumption.
Notably, investment expenditures are cyclical and are moving with the reference cycle in the opposite direction. Besides, the correlation coefficient between government expenditure and GDP is -0.2759, indicating the presence of a negative correlation.
This is a common scenario, which occurs in a majority of countries, involves several reasons.
Firstly, it is the collection of taxes that allows the government to obtain a considerable income and then invest in public utilities and infrastructure. Therefore, it is conceivable that the heavier the tax burden the authorities impose, the higher the price of goods or services would be. In such a circumstance, consumers are less willing to purchase, and producers are less willing to produce, diminishing the well-being of society and retarding economic growth. Secondly, it is government subsidies that undermine the motivation of individuals to work diligently. To illustrate, unemployment insurance institutes provide citizens with an incentive to stay unemployed, and social welfare encourages individuals to choose leisure over heavy workloads. Most importantly, it is well-acknowledged that total government spending, a measure formed by combining public consumption and investment expenditures, works as a fiscal and monetary policy buffer against financial shocks and is hence countercyclical with GDP.
However, it is imperative for government to interfere and take immediate action when market failures and externalities occur. Hence, before introducing policies, the government is bound to have a clear picture of the current economic situation and take into account the impact of government expenditure on the business cycle.
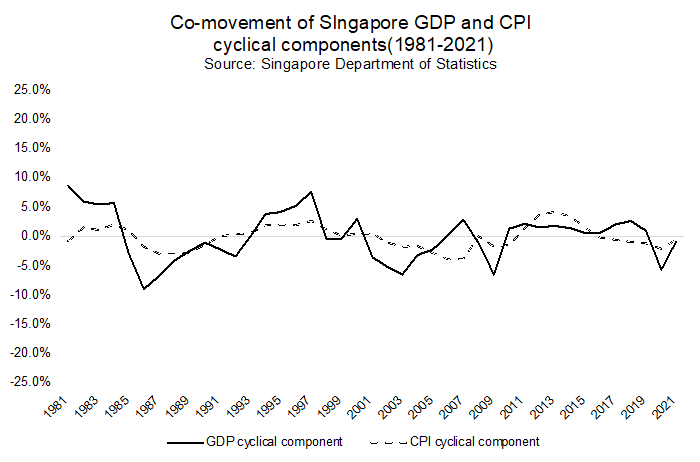
Figure 5: Co-movement between Singapore GDP and CPI cyclical components.
As far as the consumer price index goes, the standard deviations of 0.0204 indicate CPI fluctuates less than private consumption, private investment, and government spending.
Figure 5 displays that the CPI and GDP move in the same direction in most circumstances, implying an increase in CPI results in economic growth. Besides, the correlation coefficient of Singapore’s CPI (relative to GDP) is 0.5159, revealing a positive and relatively significant correlation with GDP. This phenomenon occurs when rapid economic growth is coincident with high inflation. To elaborate, as a result of the rapid economic expansion, both national income and social demand have surged tremendously. Under such circumstances, the price of goods or services is prone to rise, leading to high inflation. Even if inflationary tendencies are strong at this time, the pressure on society as a whole is not intense because of economic advancement.
Interestingly, Monir Ahmmed and Md. Nezum Uddin discovered that the correlation between inflation and economic growth in Malaysia, Thailand, Singapore, Japan, and Bangladesh is positive, while the United States, Pakistan, the United Kingdom, and India are showing a negative relationship [15].
The positive correlation between GDP and inflation in Singapore is partly attributable to the monetary policies in Singapore. As Wilson explained, Singapore’s monetary policy since 1981 has not adopted conventional interest rate control due to the extreme openness of the economy. Instead, the policy is designed to manage the exchange rate against an undisclosed basket of currencies, with the prime objective of containing inflation. Over time, this policy has contributed to a stable currency and low inflation without sacrificing economic growth [16].
5. Policy Suggestion
Clearly defining Singapore’s business cycle enables policymakers to come to informed decisions. Therefore, it is essential for the government to possess a clear picture of the national business cycle, analyzing the cyclical fluctuations of assorted variables and the correlation between them on a continuous basis.
Considering the aforementioned empirical results, the following policy recommendations to the Singaporean government can be presented.
Initially, in an effort to boost economic prosperity in the short term, governors could implement policies designed to stimulate private investment owing to the severe cyclical fluctuations of private investment and its strong relevance to economic growth.
Secondly, hardly should we ignore the significance of promoting private consumption to achieving Singapore’s national prosperity in the long term on account of the tiny cyclical fluctuation of private consumption. Consequently, officials ought to prioritize the implementation of a broad range of regulations and legislation so as to stimulate domestic demand.
Thirdly, with the negative correlation between government spending and economic growth, the Singaporean government should continuously enforce rules and maintain competitive markets in good order, in order to take advantage of the market economy. Nonetheless, in the presence of market failures and externalities, the government should immediately step in and improve market outcomes.
6. Conclusion
This study examines the business cycle of Singapore from 1981 to 2021. The analysis is carried out by applying the Hodrick-Prescott approach to detrend economic time series, such as real GDP, private consumption, private investment, government expenditure, and CPI. Next, the author used standard deviation and correlation coefficient to measure the variations and co-movements between the reference cycle and specific cycles. In the end, the writer put forward policy suggestions for enhancing economic growth in Singapore. The article draws several conclusions. Firstly, Singapore's real GDP is highly vulnerable to external factors. Secondly, private consumption, investment, and CPI have positive and significant correlations with GDP, and investment is of greater relevance to short-term economic growth. Thirdly, government expenditure and GDP are negatively correlated. Fourthly, private investment spending seems to be a potential cause of business cycle shocks due to its dramatic fluctuations. Lastly, the government of Singapore should stimulate private investment so as to boost short-term economic prosperity, and then promote private consumption to achieve national prosperity in the long run.
References
[1]. Burns, A. F., & Mitchell, W. C. (1946). Measuring business cycles (Issues burn46-1). National bureau of economic research.
[2]. Morley, J., & Piger, J. (2012). The Asymmetric Business Cycle. Review of Economics and Statistics, 94(1), 208–221.
[3]. Brault, J., & Khan, H. (2020). THE SHIFTS IN LEAD‐LAG PROPERTIES OF THE U.S. BUSINESS CYCLE. Economic Inquiry, 58(1), 319–334.
[4]. Luvsannyam, D., Batmunkh, K., & Buyankhishig, K. (2019). Dating the business cycle: Evidence from Mongolia. Central Bank Review, 19(2), 59–66.
[5]. Choy, K. M. (1999). Sources of macroeconomic fluctuations in Singapore: Evidence from a structural VAR model. Singapore Economic Review, 44(1), 74–98.
[6]. Meng, C. K. (2003). Singapore business cycles: A supply-side analysis. ASEAN Economic Bulletin, 1–10.
[7]. Choy, K. M. (2011). BUSINESS CYCLES IN SINGAPORE: STYLIZED FACTS FOR A SMALL OPEN ECONOMY: business cycles in singapore. Pacific Economic Review, 16(1), 18–35.
[8]. Hodrick, R. J., & Prescott, E. (n.d.). Post-War U.S. Business Cycles: An Empirical Investigation. 27.
[9]. Hamilton, J. D. (2018). Why you should never use the Hodrick-Prescott filter. Review of Economics and Statistics, 100(5), 831–843.
[10]. Phillips, P. C. B., & Shi, Z. (2020). Boosting: Why You Can Use the HP Filter (arXiv:1905.00175). arXiv. http://arxiv.org/abs/1905.00175
[11]. Zarnowitz, V. (2007). Business cycles: Theory, history, indicators, and forecasting (Vol. 27). University of Chicago Press.
[12]. Mankiw, N. G. (2020). Principles of economics. Cengage Learning.
[13]. Ozyildirim, A., Schaitkin, B., & Zarnowitz, V. (2010). Business cycles in the euro area defined with coincident economic indicators and predicted with leading economic indicators. Journal of Forecasting, 29(1–2), 6–28.
[14]. (DOS) | SingStat Table Builder – Expenditure On Gross Domestic Product In Chained (2015) Dollars. (n.d.). Retrieved July 5, 2022, from https://tablebuilder.singstat.gov.sg/table/TS/M014811
[15]. hmmed, M., Uddin, M., Rafiq, M., & Uddin, M. (2020). Inflation and Economic Growth Link – Multi-Country Scenario. International Journal of Economics and Financial Issues, 10, 47–53.
[16]. Wilson, P. (2009). Monetary policy in Singapore: A BBC approach. In Singapore And Asia In A Globalized World: Contemporary Economic Issues and Policies (pp. 63–86). World Scientific.
Cite this article
Wang,S. (2023). Business Cycle in Singapore during the Period from 1981 to 2021. Advances in Economics, Management and Political Sciences,7,305-314.
Data availability
The datasets used and/or analyzed during the current study will be available from the authors upon reasonable request.
Disclaimer/Publisher's Note
The statements, opinions and data contained in all publications are solely those of the individual author(s) and contributor(s) and not of EWA Publishing and/or the editor(s). EWA Publishing and/or the editor(s) disclaim responsibility for any injury to people or property resulting from any ideas, methods, instructions or products referred to in the content.
About volume
Volume title: Proceedings of the 2nd International Conference on Business and Policy Studies
© 2024 by the author(s). Licensee EWA Publishing, Oxford, UK. This article is an open access article distributed under the terms and
conditions of the Creative Commons Attribution (CC BY) license. Authors who
publish this series agree to the following terms:
1. Authors retain copyright and grant the series right of first publication with the work simultaneously licensed under a Creative Commons
Attribution License that allows others to share the work with an acknowledgment of the work's authorship and initial publication in this
series.
2. Authors are able to enter into separate, additional contractual arrangements for the non-exclusive distribution of the series's published
version of the work (e.g., post it to an institutional repository or publish it in a book), with an acknowledgment of its initial
publication in this series.
3. Authors are permitted and encouraged to post their work online (e.g., in institutional repositories or on their website) prior to and
during the submission process, as it can lead to productive exchanges, as well as earlier and greater citation of published work (See
Open access policy for details).
References
[1]. Burns, A. F., & Mitchell, W. C. (1946). Measuring business cycles (Issues burn46-1). National bureau of economic research.
[2]. Morley, J., & Piger, J. (2012). The Asymmetric Business Cycle. Review of Economics and Statistics, 94(1), 208–221.
[3]. Brault, J., & Khan, H. (2020). THE SHIFTS IN LEAD‐LAG PROPERTIES OF THE U.S. BUSINESS CYCLE. Economic Inquiry, 58(1), 319–334.
[4]. Luvsannyam, D., Batmunkh, K., & Buyankhishig, K. (2019). Dating the business cycle: Evidence from Mongolia. Central Bank Review, 19(2), 59–66.
[5]. Choy, K. M. (1999). Sources of macroeconomic fluctuations in Singapore: Evidence from a structural VAR model. Singapore Economic Review, 44(1), 74–98.
[6]. Meng, C. K. (2003). Singapore business cycles: A supply-side analysis. ASEAN Economic Bulletin, 1–10.
[7]. Choy, K. M. (2011). BUSINESS CYCLES IN SINGAPORE: STYLIZED FACTS FOR A SMALL OPEN ECONOMY: business cycles in singapore. Pacific Economic Review, 16(1), 18–35.
[8]. Hodrick, R. J., & Prescott, E. (n.d.). Post-War U.S. Business Cycles: An Empirical Investigation. 27.
[9]. Hamilton, J. D. (2018). Why you should never use the Hodrick-Prescott filter. Review of Economics and Statistics, 100(5), 831–843.
[10]. Phillips, P. C. B., & Shi, Z. (2020). Boosting: Why You Can Use the HP Filter (arXiv:1905.00175). arXiv. http://arxiv.org/abs/1905.00175
[11]. Zarnowitz, V. (2007). Business cycles: Theory, history, indicators, and forecasting (Vol. 27). University of Chicago Press.
[12]. Mankiw, N. G. (2020). Principles of economics. Cengage Learning.
[13]. Ozyildirim, A., Schaitkin, B., & Zarnowitz, V. (2010). Business cycles in the euro area defined with coincident economic indicators and predicted with leading economic indicators. Journal of Forecasting, 29(1–2), 6–28.
[14]. (DOS) | SingStat Table Builder – Expenditure On Gross Domestic Product In Chained (2015) Dollars. (n.d.). Retrieved July 5, 2022, from https://tablebuilder.singstat.gov.sg/table/TS/M014811
[15]. hmmed, M., Uddin, M., Rafiq, M., & Uddin, M. (2020). Inflation and Economic Growth Link – Multi-Country Scenario. International Journal of Economics and Financial Issues, 10, 47–53.
[16]. Wilson, P. (2009). Monetary policy in Singapore: A BBC approach. In Singapore And Asia In A Globalized World: Contemporary Economic Issues and Policies (pp. 63–86). World Scientific.