


1. Introduction
With the continuous deepening of globalization and profound changes in the international economic environment in recent years, regional trade agreements have become an important means of promoting economic cooperation and exchanges among countries. As one of the largest free trade agreements in the world, the Regional Comprehensive Economic Partnership (RCEP) officially came into force on January 1, 2022, covering fifteen major Asia-Pacific economies including China, Japan, South Korea, Australia, and the ten ASEAN countries. By lowering tariffs, simplifying trade procedures, and harmonizing rules and standards, RCEP promotes the liberalization and facilitation of trade and investment in the region, and fosters deep integration of industrial and supply chains among the member states [1,2].
The high-tech industry is the core driving force for optimizing and upgrading the national economic structure and enhancing international competitiveness [3]. For China, the high-tech industry is not only an important engine for innovation-driven development, but also a key sector for achieving export transformation and upgrading, and integrating into the global value chain [4]. However, due to factors such as international trade barriers, intellectual property protection, industrial support capacity, and market access, the expansion of China’s high-tech products in the international market has long faced numerous challenges [5]. The entry into force of RCEP, which covers a series of practical measures including tariff reduction, investment facilitation, intellectual property protection, and services trade liberalization, is likely to have far-reaching impacts on the export structure and cooperation model of China’s high-tech industry [6,7].
In recent years, scholars have empirically analyzed the impact of RCEP on the transformation of China’s trade structure and industrial development from various perspectives, such as the macroeconomy, manufacturing, agricultural products, and the digital economy. [8] used a dynamic GTAP model to demonstrate that the implementation of RCEP helps to mitigate the impact of China–US trade frictions and promotes China’s deeper participation in the division of labor in the Asia-Pacific industrial chain. [9] pointed out that RCEP reduces electromechanical trade barriers and enhances the export potential of China’s electromechanical products, especially to ASEAN, India, and Australia, although disadvantages persist in high-end equipment vis-à-vis Japan and South Korea. [10] found that RCEP improves China’s agricultural import security and food security, and diversification helps disperse risks; [11] emphasized that the complementarity of agricultural products within the region outweighs competition, thereby providing a foundation for agricultural cooperation. [12] empirically demonstrated that the development of the digital economy in RCEP member countries directly promotes China’s cross-border e-commerce exports, with transportation and institutional quality improvements serving as indirect drivers. Overall, RCEP significantly facilitates the upgrading of China’s trade and industrial structure, brings new trade opportunities, and strengthens regional cooperation. However, there remains a lack of systematic, micro-level quantitative evaluation in the academic literature focusing on the high-tech industry in the aftermath of RCEP’s implementation, particularly with respect to the performance of China’s high-tech products across different sub-industries, the heterogeneity of regional exports, and the associated policy effects.
Against this backdrop, this paper regards the entry into force of the RCEP agreement as a natural experiment, and employs a difference-in-differences model to analyze, from the empirical perspective of trade flows, the effects and mechanisms of RCEP implementation on China’s high-tech industry exports. Specifically, this paper focuses on changes in the trade of high-tech products between China and RCEP member countries, examines the role of the policy in boosting export volume and facilitating structural upgrading, and further dissects the underlying mechanisms and heterogeneity across specific high-tech sub-industries. Finally, based on the empirical regression results, targeted policy recommendations are proposed to advance China’s deepening of regional cooperation and the enhancement of global competitiveness in the high-tech industry. This study aims to provide theoretical support and practical reference for understanding the trends of internationalization of China’s high-tech industry under the RCEP framework, as well as to furnish a scientific basis for relevant departments to optimize policy making and promote high-quality opening-up.
2. Manuscript preparation model, variables, and data
2.1. Model specification
Any text or material outside the aforementioned margins will not be printed.
Make sure there is NO Grid. (Custom Margins – Document Grid – Grid – no Grid)
This paper adopts the difference-in-differences (DID) method to evaluate the impact of the entry into force of the RCEP agreement on China’s high-tech industry exports. Considering that export flows are influenced by multiple factors and that there exist unobservable individual and time effects, the following DID panel regression model is constructed:
Where,
The regression employs country-clustered robust standard errors and absorbs country and time fixed effects to ensure reliability and validity of estimates. This model effectively identifies the net change in China’s high-tech industry exports before and after RCEP’s implementation, thereby providing an evaluation of the policy effect.
2.2. Variable descriptions
2.2.1. Dependent variable
The dependent variable is China’s high-tech product export value (exportit) to major trading partners. The statistical data come from the UN Comtrade database. The scope and classification of high-tech products follow [13], specifically using HS2007 six-digit codes for identification and categorization. To ensure consistency with the official statistics of China, the classification standard is based on the Customs Statistical Express for Key Export Commodities (2025) [14]. High-tech products are divided into nine major categories. The classification of high-tech industry subsectors and their corresponding HS2007 six-digit codes, has been removed for brevity. Researchers who wish to access the detailed category definitions and full HS code listings may contact the author directly to obtain the complete information.
2.2.2. Core explanatory variable
The core explanatory variable is the policy shock of RCEP’s entry into force on China’s high-tech industry exports, measured by the DID interaction term:
Treat: Dummy indicating whether the export destination country is an RCEP member (excluding China itself — includes 13 members: Japan, South Korea, Australia, New Zealand, Singapore, Indonesia, Malaysia, the Philippines, Thailand, Vietnam, Brunei, Cambodia, Laos, Myanmar). Treat = 1 if yes, otherwise 0.
Post: Dummy indicating the post-policy period. As RCEP entered into force on January 1, 2022, Time = 1 for years 2022 and after, otherwise 0.
Thus, DID = 1 represents destination countries that are RCEP members and observations in the period after RCEP’s entry into force; DID = 0 applies to the control group (non-members or pre-RCEP years).
2.2.3. Control variables
Drawing on literature related to high-tech product exports and classic empirical studies of trade flows, the following five categories of control variables are selected:
lngdp: Logarithm of partner country GDP (constant 2015 USD) [15]; expected positive effect.
lnpopulation: Logarithm of partner country population [16]; reflects market size; expected positive effect.
lnconst_costs: Logarithm of variable trade costs, proxied by geographical distance × annual average international oil price [17]; expected negative effect.
lntrade_open: Logarithm of trade openness, measured by trade (goods & services) as a percentage of GDP [18]; expected positive effect.
lnictexport: Logarithm of China’s ICT product trade with the partner country; expected positive correlation with high-tech exports.
2.3. Data sources
High-tech product export data come from the UN Comtrade database. Macro and population data are taken from the World Bank’s World Development Indicators (WDI), including country GDP (constant 2015 prices) and population. Variable trade cost distances are taken from the CEPII geodist database; oil prices are from the IMF. Trade openness data are from the World Bank and OECD. ICT trade data come from UNCTAD.
The time span is 2011–2023. After excluding countries/regions with missing data for some years or product categories and eliminating abnormal or negative values, the final balanced panel consists of 156 countries/regions and 1,965 valid observations for empirical analysis.
3. Empirical results analysis
3.1. Data sources
Table 1 reports the stepwise regression results regarding the impact of RCEP’s entry into force on China’s high-tech industry exports.
Column (1) analyses the effect of RCEP’s implementation on high-tech product exports, controlling only for country and year fixed effects. The result shows that the coefficient of did is positive and significant at the 5% level, indicating that RCEP significantly increased China’s high-tech industry exports.
Columns (2)–(6) sequentially add various control variables — GDP, population, variable trade costs, trade openness, and ICT export value — to the baseline model. The size and significance of the did coefficient remain essentially stable (all significant at the 5% level), further confirming the robustness of the results. Among them, ICT-related product exports (lnictexport) have a significant effect on high-tech industry exports, with a high coefficient of 0.871, indicating a close relationship between the ICT industry and high-tech exports.
|
Variable |
(1) |
(2) |
(3) |
(4) |
(5) |
(6) |
|
did |
0.124** |
0.126** |
0.130** |
0.129** |
0.128** |
0.129** |
|
(0.061) |
(0.060) |
(0.063) |
(0.063) |
(0.063) |
(0.063) |
|
|
lngdp |
0.028 |
0.029 |
0.028 |
0.028 |
||
|
(0.101) |
(0.102) |
(0.101) |
(0.100) |
|||
|
lnpopulation |
-0.197 |
-0.195 |
-0.196 |
-0.196 |
-0.197 |
|
|
(0.183) |
(0.184) |
(0.184) |
(0.184) |
(0.184) |
||
|
lnconst_costs |
-0.042 |
-0.042 |
-0.042 |
|||
|
(0.061) |
(0.061) |
(0.061) |
||||
|
lntrade_open |
-0.019 |
-0.019 |
||||
|
(0.039) |
(0.039) |
|||||
|
lnictexport |
0.871*** |
|||||
|
(0.025) |
||||||
|
Time FE |
YES |
YES |
YES |
YES |
YES |
YES |
|
Country FE |
YES |
YES |
YES |
YES |
YES |
YES |
|
N |
2170 |
2145 |
2145 |
2091 |
1965 |
1965 |
|
R² |
0.957 |
0.959 |
0.959 |
0.959 |
0.958 |
0.992 |
Note: ∗∗∗, ∗∗, and denote statistical significance at the 1%, 5%, and 10% levels, respectively; standard errors are robust to heteroskedasticity and clustered at the country level.
3.2. Robustness tests
3.2.1. Parallel trends test
To verify whether the treatment group and the control group maintained the same development trend before the entry into force of RCEP, this paper adopts the parallel trends testing method proposed by [19]. The specific setting is as follows:
where
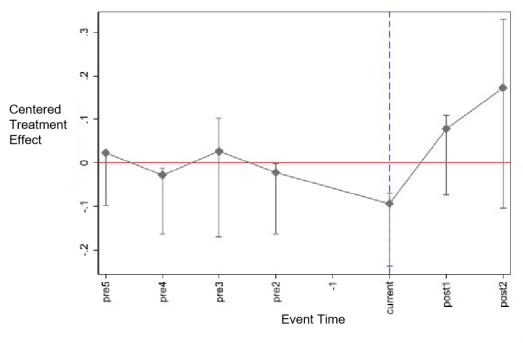
To improve robustness, the period immediately before policy implementation (pre1) is excluded as the baseline to avoid short-term fluctuations. The regression includes all time dummy variables, control variables, and fixed effects, with coefficients meancentered using the average of pre5 to pre2 as the baseline.
Figure 1 shows that, in the four years before RCEP’s entry into force, coefficients are statistically insignificant and close to zero, indicating similar export trends between treatment and control groups, thus meeting the parallel trends assumption. After RCEP’s implementation, coefficients become significantly positive, reflecting faster growth in China’s hightech exports. The confidence intervals for prepolicy periods all include zero, while those for the policy year and subsequent years do not, confirming that RCEP had a robust and significant positive effect. These results support the validity of the DID approach and the reliability of the findings.
3.2.2. Placebo test
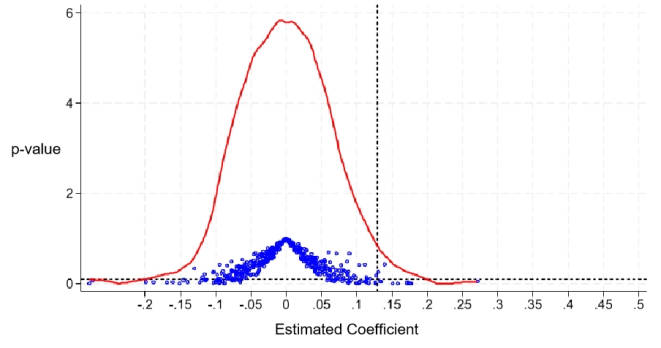
To further verify the robustness of the baseline regression results and avoid spurious correlations arising from model specification or data characteristics, this paper uses a placebo test as an auxiliary check. The specific procedure is as follows: a set of “pseudo” treatment countries and a “pseudo” policy implementation year are randomly designated; a new DID variable is then generated; the regression is re-estimated to observe the distribution of DID coefficients under a scenario with no genuine policy shock.
In each iteration, 13 countries are randomly chosen as a pseudo-treatment group, and a random year is set as the pseudo-policy start. A placebo_DID variable is generated, and the regression is run with the same controls and fixed effects as the baseline. This is repeated 500 times, recording coefficients and pvalues.
Figure 2 shows that placebo DID coefficients cluster around zero, with a symmetric bellshaped kernel density and very few significant results. The baseline DID coefficient (0.129) lies far outside this distribution, with a much lower pvalue, indicating that the observed positive effect of RCEP is unlikely to result from random variation or model artifacts, and is both statistically and economically meaningful.
3.2.3. PSM-DID test
To further validate the robustness of the baseline regression results and to reduce the influence of initial differences between the treatment and control groups, this paper applies the propensity score matching combined with the difference-in-differences (PSM–DID) method as a re-examination. Specifically, propensity scores are first estimated based on covariates, and samples are matched; the DID regression is then repeated on this matched sample, effectively mitigating possible sample selection bias.
|
PSM-DID |
DID |
|
|
did(RCEP Entry into force) |
0.156** |
0.129** |
|
(0.071) |
(0.063) |
|
|
Control |
YES |
YES |
|
Time FE |
YES |
YES |
|
Country FE |
YES |
YES |
|
N |
1711 |
1965 |
|
R² |
0.993 |
0.992 |
It can be seen that after propensity score matching, the promoting effect of RCEP’s entry into force on China’s high-tech industry exports remains significant (PSM–DID coefficient = 0.156, p = 0.030), and the coefficient value is highly consistent with the baseline regression (0.129, p = 0.043). This further confirms that the implementation of RCEP can effectively bolster China’s high-tech industry exports.
4. Mechanism analysis and heterogeneity analysis
4.1. Mechanism analysis
Building on the earlier empirical results, and to further explore the mechanisms through which the entry into force of RCEP affects China’s high-tech industry exports, this paper examines “property rights protection” as a potential mediating channel. Existing studies suggest that the signing and implementation of free trade agreements, in addition to reducing tariff barriers and facilitating investment and trade, can also promote the international competitiveness and export growth of high-tech industries by strengthening intellectual property protection and standardizing investment dispute resolution mechanisms [20].
Based on this, the International Property Rights Index (IPRI), sourced from the Property Rights Alliance, is introduced into the analysis to assess whether RCEP boosts China’s high-tech industry exports by enhancing property rights protection. A two-stage model strategy is adopted.
4.1.1. Stage one: impact of RCEP on property rights protection level
The following regression is estimated to assess the effect of RCEP (did) on the property rights protection score (IPRIscore) of member countries:
Here, IPRIscoreit denotes the level of property rights protection in country i in year t; didit is the difference-in-differences treatment effect (RCEP member country × post-entry-into-force period); Xit represents control variables consistent with those in the baseline regression; μi and λtμi are country and year fixed effects; εit is the random disturbance term. A positive and statistically significant β indicates that RCEP has, in the short run, significantly promoted the level of property rights protection in member countries.
The estimated coefficient of did is 0.155 and passes the 5% significance level test (p < 0.05). This implies that, within the scope of the sample, after RCEP entered into force, the average level of property rights protection in the member countries experienced a significant improvement — that is, RCEP has indeed played a positive role in strengthening the intellectual property protection environment within the region.
4.1.2. Stage two: interaction effect of “RCEP × property rights protection” on high-tech industry exports
Given that Stage One finds RCEP significantly enhances the property rights protection environment in member countries, we further test whether this improvement, when combined with RCEP, promotes China’s high-tech industry exports. The specific model is:
Here, (did × IPRIscore)it is an interaction term between the DID variable and the level of property rights protection, used to identify the effect on China’s high-tech industry exports under the joint influence of “RCEP implementation” and “improved property rights protection.” A positive and significant θ implies that strengthening intellectual property protection can enhance the promoting effect of RCEP on high-tech exports.
|
VARIABLES |
IPRIscore |
lnexport |
|
did |
0.155** |
|
|
(0.0770) |
||
|
didIPRIscore |
0.0219** |
|
|
(0.00944) |
||
|
Constant |
26.18*** |
13.66*** |
|
(5.672) |
(4.352) |
|
|
Control |
YES |
YES |
|
Time FE |
YES |
YES |
|
Country FE |
YES |
YES |
|
N |
1283 |
1283 |
|
R² |
0.996 |
0.993 |
Note: ***, **, and * indicate significance at the 1%, 5%, and 10% levels, respectively; robust standard errors clustered at the country level are in parentheses.
The coefficient of the interaction term is 0.0219 and is positive at the 5% significance level (p<0.05), indicating that the improvement in property rights protection brought about by RCEP has a significant positive transmission effect on China’s high-tech industry exports: as the property rights protection level in member countries increases, China’s high-tech exports gain more under the RCEP framework. This suggests that the enhanced intellectual property protection environment works in tandem with RCEP’s trade and investment facilitation measures, thereby promoting more effective entry of high-tech products into international markets. At the same time, lnictexport in this specification also exhibits a significant positive effect, further supporting the earlier conclusion of strong complementarity between the high-tech industry and the ICT industry.
4.2. Heterogeneity analysis
To examine sectoral heterogeneity, the study divides China’s hightech industry into nine subsectors and runs separate regressions. Results show that RCEP’s impact varies notably: its promotion effect is strongest in life sciences and computerintegrated manufacturing, while optoelectronics and communications experience weak or even negative effects.
ICT exports consistently display a significant positive influence in most sectors, highlighting their key driving role. Some macro variables, such as partner GDP and population, also matter, reflecting market and cost conditions. Overall, these results suggest that policy measures should consider industry differences, strengthening support for sectors with strong gains and designing tailored strategies for less responsive ones.
5. Main findings and policy implications
5.1. Main findings
Using the entry into force of RCEP in 2022 as a natural experiment and panel data from 2011–2023, the study applies a DID model with multiple robustness checks. Results show that RCEP significantly boosted China’s hightech exports to member countries, with ICTrelated trade exerting a strong complementary effect.
Mechanism analysis reveals that RCEP enhanced member countries’ property rights protection, which in turn strengthened China’s hightech export growth. Heterogeneity analysis indicates notable gains in life sciences and computerintegrated manufacturing, but limited or negative effects in optoelectronics, aerospace, and communications.
5.2. Policy implications
For sectors showing strong benefits — such as life sciences and computerintegrated manufacturing — policies should focus on increasing R&D, streamlining approvals, and encouraging use of RCEP’s rules of origin to expand market presence. For weaker sectors — including optoelectronics, aerospace, and communications — targeted strategies such as innovation subsidies, service platforms, and market diversification are needed.
Crosssector integration of ICT and hightech industries should be promoted, alongside stronger regional intellectual property cooperation to safeguard firms abroad. Trade facilitation measures like simplified customs, faster clearance, and participation in RCEP supply chain restructuring can further enhance competitiveness.
References
[1]. Zhou S.D., Zheng J. Trade efficiency and influencing factors between China and RCEP partner countries: An empirical analysis based on stochastic frontier gravity model [J]. Inquiry into Economic Issues, 2018(7): 89-97.
[2]. Chen S.M., Ni J.H. Economic effects of China’s accession to the Regional Comprehensive Economic Partnership: A simulation analysis based on the GTAP model [J/OL]. Asia-Pacific Economy, 2014(2): 125-133.
[3]. Ma S.H., Guo Y.P. Development of high-tech industry, innovation capability and export technology complexity [J]. Commercial Economy Research, 2024(11): 153-156.
[4]. Song W.H., Ren J.H. Discussion on the relationship between market potential and the export trade development of high-tech industries [J]. Commercial Economy Research, 2024(4): 139-142.
[5]. Zhao J.Z., Ding G.N. Trade dilemma and strategic choice of China’s high-tech products under the new “dual circulation” development pattern [J]. International Trade, 2021(11): 31-43.
[6]. Liu B., Chen S.M. The economic effect of reducing technical trade barriers under the RCEP framework: An empirical analysis based on the GTAP model [J/OL]. Journal of International Trade Issues, 2014(6): 91-98.
[7]. Yuan B., Wang R., Pan Y.C., et al. The impact of RCEP’s official implementation on China’s economy and countermeasure studies [J]. International Economic Cooperation, 2022(1): 3-13.
[8]. Liang Y.X. Analysis on the impact of China’s accession to RCEP under the background of China–US trade friction on China’s economy and related industries [J/OL]. International Trade, 2020(8): 38-47. DOI: 10.14114/j.cnki.itrade.2020.08.006.
[9]. Meng X., Huang C.L., Zhang X. The impact of RCEP on China’s electromechanical product exports: Based on GTAP simulation analysis [J/OL]. Asia-Pacific Economy, 2018(4): 26-35, 142, 149-150.
[10]. Huang X.Y., Li G.X. Impact of RCEP on China’s agricultural imports and national food security [J]. Journal of China Agricultural University, 2024(10): 1-15, 337.
[11]. Lin Q.Q., Zheng Y., Yu J.H. A study on the competitiveness and complementarity of agricultural products trade between China and other RCEP member countries [J/OL]. Asia-Pacific Economy, 2021(1): 75-81, 151. DOI: 10.16407/j.cnki.1000-6052.20210326.012.
[12]. Wang D., Xu P., An B., et al. How does the development of the digital economy in RCEP member countries affect China’s cross-border e-commerce exports? [J/OL]. PLOS One, 2024, 19(12): e0310975. DOI: 10.1371/journal.pone.0310975.
[13]. Zheng X.D., Zhuang R. A study on the factors driving the growth of Sino–US high-tech product trade: An analysis based on a modified CMS model [J/OL]. Studies in Science of Science, 2015(5): 683-693. DOI: 10.16192/j.cnki.1003-2053.2015.05.006.
[14]. General Administration of Customs of China. Customs Statistical Express on Key Export Commodities (2025) [R]. Beijing: General Administration of Customs, 2025.
[15]. Zhang S.Q. The impact of intellectual property protection in RCEP member countries on China’s high-tech product export trade [D/OL]. [2025-05-05]. Available from: https: //kns.cnki.net/KCMS/detail/detail.aspx?dbcode=CMFD& dbname=CMFDTEMP& filename=1024044497.nh.
[16]. Qin F.M., Yi L.X., Chen Y.S., et al. Comparative study on the export competitiveness of high-tech industries between Guangdong Province and South Korea under the background of RCEP [J/OL]. Hebei Enterprise, 2023(7): 5-12. DOI: 10.19885/j.cnki.hbqy.2023.07.003.
[17]. Wang S.Y., Chen S.Y. The impact of the development of the digital economy in “Belt and Road” co-construction countries on China’s high-tech product export trade [J/OL]. Exhibition Economy, 2025(6): 77-81. DOI: 10.19995/j.cnki.CN10-1617/F7.2025.06.077.
[18]. Qi J.Y., Ren Y.D. The host country’s digital economy development level and China’s outward direct investment: Evidence from 43 countries along the “Belt and Road” [J]. International Economics and Trade Research, 2020, 36(09): 55-71. DOI: 10.13687/j.cnki.gjjmts.2020.09.004.
[19]. Li G.Q., Chen X.J. Establishment of overseas cooperation zones and the optimization of China’s export product structure: A policy evaluation based on a difference-in-differences model [J/OL]. Scientia Geographica Sinica, 2025(1): 153-163. DOI: 10.13249/j.cnki.sgs.20230821.
[20]. Zuo Y., Zhou Y.P. How does the “Belt and Road” initiative affect green innovation in patent-intensive industries in Chinese provinces along the route? [J]. China Population, Resources and Environment, 2023(10): 85-99.
Cite this article
Xu,Y. (2025). The Impact of the Implementation of RCEP on China’s High-Tech Industry and Policy Implications. Advances in Economics, Management and Political Sciences,248,1-11.
Data availability
The datasets used and/or analyzed during the current study will be available from the authors upon reasonable request.
Disclaimer/Publisher's Note
The statements, opinions and data contained in all publications are solely those of the individual author(s) and contributor(s) and not of EWA Publishing and/or the editor(s). EWA Publishing and/or the editor(s) disclaim responsibility for any injury to people or property resulting from any ideas, methods, instructions or products referred to in the content.
About volume
Volume title: Proceedings of ICFTBA 2025 Symposium: Data-Driven Decision Making in Business and Economics
© 2024 by the author(s). Licensee EWA Publishing, Oxford, UK. This article is an open access article distributed under the terms and
conditions of the Creative Commons Attribution (CC BY) license. Authors who
publish this series agree to the following terms:
1. Authors retain copyright and grant the series right of first publication with the work simultaneously licensed under a Creative Commons
Attribution License that allows others to share the work with an acknowledgment of the work's authorship and initial publication in this
series.
2. Authors are able to enter into separate, additional contractual arrangements for the non-exclusive distribution of the series's published
version of the work (e.g., post it to an institutional repository or publish it in a book), with an acknowledgment of its initial
publication in this series.
3. Authors are permitted and encouraged to post their work online (e.g., in institutional repositories or on their website) prior to and
during the submission process, as it can lead to productive exchanges, as well as earlier and greater citation of published work (See
Open access policy for details).
References
[1]. Zhou S.D., Zheng J. Trade efficiency and influencing factors between China and RCEP partner countries: An empirical analysis based on stochastic frontier gravity model [J]. Inquiry into Economic Issues, 2018(7): 89-97.
[2]. Chen S.M., Ni J.H. Economic effects of China’s accession to the Regional Comprehensive Economic Partnership: A simulation analysis based on the GTAP model [J/OL]. Asia-Pacific Economy, 2014(2): 125-133.
[3]. Ma S.H., Guo Y.P. Development of high-tech industry, innovation capability and export technology complexity [J]. Commercial Economy Research, 2024(11): 153-156.
[4]. Song W.H., Ren J.H. Discussion on the relationship between market potential and the export trade development of high-tech industries [J]. Commercial Economy Research, 2024(4): 139-142.
[5]. Zhao J.Z., Ding G.N. Trade dilemma and strategic choice of China’s high-tech products under the new “dual circulation” development pattern [J]. International Trade, 2021(11): 31-43.
[6]. Liu B., Chen S.M. The economic effect of reducing technical trade barriers under the RCEP framework: An empirical analysis based on the GTAP model [J/OL]. Journal of International Trade Issues, 2014(6): 91-98.
[7]. Yuan B., Wang R., Pan Y.C., et al. The impact of RCEP’s official implementation on China’s economy and countermeasure studies [J]. International Economic Cooperation, 2022(1): 3-13.
[8]. Liang Y.X. Analysis on the impact of China’s accession to RCEP under the background of China–US trade friction on China’s economy and related industries [J/OL]. International Trade, 2020(8): 38-47. DOI: 10.14114/j.cnki.itrade.2020.08.006.
[9]. Meng X., Huang C.L., Zhang X. The impact of RCEP on China’s electromechanical product exports: Based on GTAP simulation analysis [J/OL]. Asia-Pacific Economy, 2018(4): 26-35, 142, 149-150.
[10]. Huang X.Y., Li G.X. Impact of RCEP on China’s agricultural imports and national food security [J]. Journal of China Agricultural University, 2024(10): 1-15, 337.
[11]. Lin Q.Q., Zheng Y., Yu J.H. A study on the competitiveness and complementarity of agricultural products trade between China and other RCEP member countries [J/OL]. Asia-Pacific Economy, 2021(1): 75-81, 151. DOI: 10.16407/j.cnki.1000-6052.20210326.012.
[12]. Wang D., Xu P., An B., et al. How does the development of the digital economy in RCEP member countries affect China’s cross-border e-commerce exports? [J/OL]. PLOS One, 2024, 19(12): e0310975. DOI: 10.1371/journal.pone.0310975.
[13]. Zheng X.D., Zhuang R. A study on the factors driving the growth of Sino–US high-tech product trade: An analysis based on a modified CMS model [J/OL]. Studies in Science of Science, 2015(5): 683-693. DOI: 10.16192/j.cnki.1003-2053.2015.05.006.
[14]. General Administration of Customs of China. Customs Statistical Express on Key Export Commodities (2025) [R]. Beijing: General Administration of Customs, 2025.
[15]. Zhang S.Q. The impact of intellectual property protection in RCEP member countries on China’s high-tech product export trade [D/OL]. [2025-05-05]. Available from: https: //kns.cnki.net/KCMS/detail/detail.aspx?dbcode=CMFD& dbname=CMFDTEMP& filename=1024044497.nh.
[16]. Qin F.M., Yi L.X., Chen Y.S., et al. Comparative study on the export competitiveness of high-tech industries between Guangdong Province and South Korea under the background of RCEP [J/OL]. Hebei Enterprise, 2023(7): 5-12. DOI: 10.19885/j.cnki.hbqy.2023.07.003.
[17]. Wang S.Y., Chen S.Y. The impact of the development of the digital economy in “Belt and Road” co-construction countries on China’s high-tech product export trade [J/OL]. Exhibition Economy, 2025(6): 77-81. DOI: 10.19995/j.cnki.CN10-1617/F7.2025.06.077.
[18]. Qi J.Y., Ren Y.D. The host country’s digital economy development level and China’s outward direct investment: Evidence from 43 countries along the “Belt and Road” [J]. International Economics and Trade Research, 2020, 36(09): 55-71. DOI: 10.13687/j.cnki.gjjmts.2020.09.004.
[19]. Li G.Q., Chen X.J. Establishment of overseas cooperation zones and the optimization of China’s export product structure: A policy evaluation based on a difference-in-differences model [J/OL]. Scientia Geographica Sinica, 2025(1): 153-163. DOI: 10.13249/j.cnki.sgs.20230821.
[20]. Zuo Y., Zhou Y.P. How does the “Belt and Road” initiative affect green innovation in patent-intensive industries in Chinese provinces along the route? [J]. China Population, Resources and Environment, 2023(10): 85-99.