


1. Introduction
China’s snowball product market has grown rapidly since 2018. The outstanding size of this product is about 150 billion yuan at the end of February 2022, according to the Securities Association of China [1]. The flood sales have sparked questions from some investors and regulators. The China Securities Regulatory Commission in August 2021 asked securities firms to ensure the products are only sold to qualified investors and fully disclose relevant risks [2]. The Asset Management Association of China, which has the authority to regulate the industry, capped fund investments in snowball products at 25% of assets.
Various regulatory signals related to the Snowball products contradict the low-risk characteristics exhibited by the Snowball, and market participants need to re-examine the products. From the perspective of investors, this paper observes whether the product can really provide such a high rate of return under a lower level of risk and analyses the real risk point. Through the analysis in this paper, investors and market participants will better understand the product.
2. Literature Review
The Snowball product has been favored by many investors in recent Chinese stock markets because of its outstanding performance. In terms of Snowball products, investors will suffer a loss only if the underlying assets fall below a preset amount and do not bounce back. Due to the pandemic, this product is especially appealing in the bull market. The stock market has been volatile and complex in recent years, especially in China, which has made the performances of stocks, bonds, quantitative, and CTA strategies relatively weak, unable to achieve the same high returns as the Snowball products [3]. The mechanism of the Snowball product provides downside protection for investors, which at least in the short term, hedges against the impact of the fall. Additionally, the ban on implicitly-guaranteed and high-yield investment products published by the Chinese government contributes to its popularity [4].
This report will briefly introduce the Snowball product, including some key terminologies and basic ideas, to provide the reader with a solid foundation before the discussion.
The full name of the so-called ‘Snowball’ product is Snowball-type automatic knock-in and knock-out brokerage income certificate, which is a type of OTC option model. Its operating mode is that investors buy income certificate products from securities companies, and the products stipulate a fluctuation range, which is professionally called exotic options with two barrier prices [5]. The Snowball product is essentially a high-risk barrier option contracts [6]. The value of the product is based on the underlying asset and an ideal payoff is conditional upon the asset’s price remaining within a certain range [6]. The underlying asset can be linked to the index, individual stock, commodity, etc.
The option involves the upper and lower trigger limits placed on the original price of the underlying asset, known as knock-in and knock-out limits. The designers usually choose 102% to 106% of the original price as the knock-out limit, and 75% to 85% of the original price as the knock-in limit. The underlying asset price fluctuates between the range of the knock-in and knock-out price. If the current closing price of the underlying asset divided by the opening price is higher than or equal to the knock-out limit on any knock-out observation day (generally once a month), the knock-out event is recognized. The investors will get 100% of their principal and an additional return based on the annualized return rate. If the quotient is lower than the knock-in price on any day during its existence, the knock-in event is recognized, which means that the investors may suffer a certain degree of loss. Buying Snowball products is similar to selling an exotic put option and obtaining option fees.
3. Main Analysis
There are four typical situations for the Snowball structure. In this paper, we make three assumptions about the Snowball product for the following analysis. Firstly, we assume that the knock-out and knock-in limits are 105% and 75% respectively. Secondly, the predetermined annualized rate of return is 8% and the duration of the product is 12 months. Thirdly, the frequency of knock-out observation is once a month, and the frequency of knock-in observation is once daily.
The first situation is that the product triggers the knock-out event during its lifetime and makes a profit. The product will end prematurely if the closing price of the underlying asset on the monthly observation day is higher than or equal to the knock-out price (105%). In this case, investors will be rewarded based on how long they have held the product, at an annualized return rate. Even if the knock-in event has been triggered, as long as the knock-out event is triggered, investors will receive the corresponding annualized agreed return.
The second situation is that the product will be profitable when it expires. The price of the underlying asset will be observed daily during its existence. If the closing price of the underlying asset never falls to 75%, the knock-in limit, and the knock-out event is not triggered, the product will expire and obtain an annualized return. In this case, investors will receive 8% extra returns and keep 100% of their principals.
The third case is that investors suffer losses at the end of the product if the index close reading fails to rebound to its initial reading. If the pegged underlying asset falls sharply below 75% unilaterally, a knock-in event will be triggered, and the product will not rise back to the purchase price on the expiration date of the product. Investors have to bear the losses based on the range of a price drop on the expiry date.
The fourth situation is that the investors have no returns. if the knock-out event is never triggered during the entire product life, but the expiration price of the underlying asset fluctuates between the purchasing price and the knock-out price. In other words, if the index close price returns to between the initial reading and the upper threshold, the investors can only recover the principal without any gain or loss.
The most ideal outcome for investors is that the index fluctuates within the set range, which allows them to hold the contract to expiration to gain the full-year return. However, only 4% of the 121 Snowball products linked to the CSI 500Index over the decade up to 2019 saw this outcome, according to a report published by investment bank China International Capital Corp. Ltd. (CICC).
About 71% of the products ended in advance and earned investors a return ranging from 1% to 27%, while 25% reported losses ranging from 6% up 45%, according to the CICC report.
The return of the Snowball products mainly depends on the underlying asset. Most snowball products in the market choose the CSI 500 Index as the underlying asset. CSI 500 Index tracks 500 Chinese mainland-listed small and midsize stocks. Many designers choose the CSI 500 Index mainly because its current valuation and enhanced quotation have relative advantages, the constituent stocks have good growth potential, and it is easier to benefit from the development of the new economy. In terms of valuation and enhanced quotations, the current PE and PB historical quantile level of the CSI 500 index are currently lower than other major broad-based indices. In addition, the CSI 500 index enhanced revenue quote is significantly higher than other major broad-based indices, further enhancing the security of its index enhanced products. In the perspective of growth, since 2013, the 5-year compounded growth rate of net profit of the CSI 500 index has been higher than that of the CSI 300 index. Although the ROE is lower than that of CSI 300, the main reason is that the leverage ratio of the CSI 300 is much higher. If the leverage factor is excluded, it can be seen that the average ROA of the CSI 500 index was 2.7%, which is higher than the 1.5% of the CSI 300 index [7]. From the perspective of profit growth expectations, as the epidemic is brought under control and the economy continues to recover, the net profit growth rate of CSI 500 index in the next three years is still expected to be above 9%.
However, it is the volatility of the underlying asset rather than its growth expectations that has a major impact on the Snowball products. In other words, the final return of the product is determined by the increase of the underlying asset, therefore, the historical performance of the CSI 500 Index is important as a reference. The CSI 500 Index historical data (Figure 1) indicates that in most years, the maximum decline or increase in the range is greater than 20%, which means that skyrocketing or plummeting is the norm for the index, and it is rare to see a market with small volatility. In addition, the increase or decrease of the index is always continuous. The CSI 500 index rose for four consecutive years from 2012 to 2015, fell for three consecutive years from 2016 to 2018, and rose for three consecutive years from 2019 to 2021.
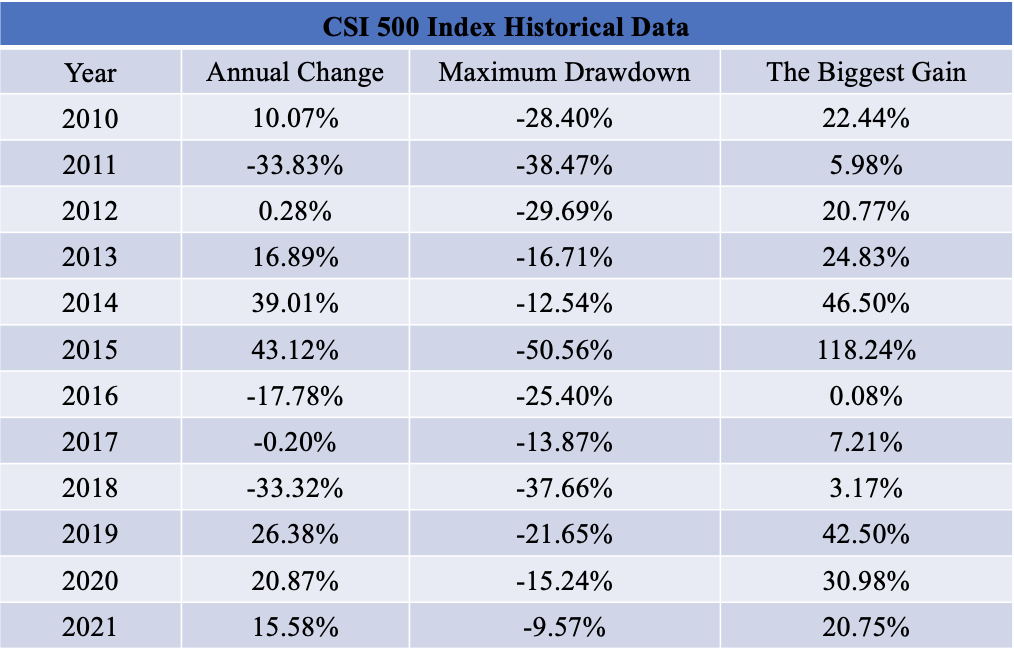
Figure 1: CSI 500 index historical data source: iFinD [8].
From the brief review of the historical data of the CSI 500 Index, the Snowball product may not be as perfect as the investors imagined. Based on these figures, the probability of the four situations can be inferred. The first and the third situations are high probability events because the CSI 500 index usually rises or falls sharply, and the trends are always continuous. At the same time, the second and the fourth situation are less likely to occur because the index rarely remains stable.
From the comparison of the return rate of investing in the Snowball products and investing in the CSI 500 Index (Figure 2), we can find that the essence of the Snowball products is a gamble between investors and securities companies. If the market performs well (situation 1), the return on investing in the index is higher than that of the Snowball products. Additionally, the securities company takes the majority of the return, the investors only receive a small portion. However, if the market falls sharply (situation 3), the loss of investing in snowball products is similar to those investing in the CSI 500 index, and investors bear all the risks and losses. If there is no significant fluctuation in one or two successive years (depending on the Snowball products' setting), investors get the highest returns through investing in the Snowball products (situation 2). Nevertheless, there has never been a situation in history that it has not risen or fallen for two years. In other words, securities companies bet on high-probability events, while investors bet on low-probability events.
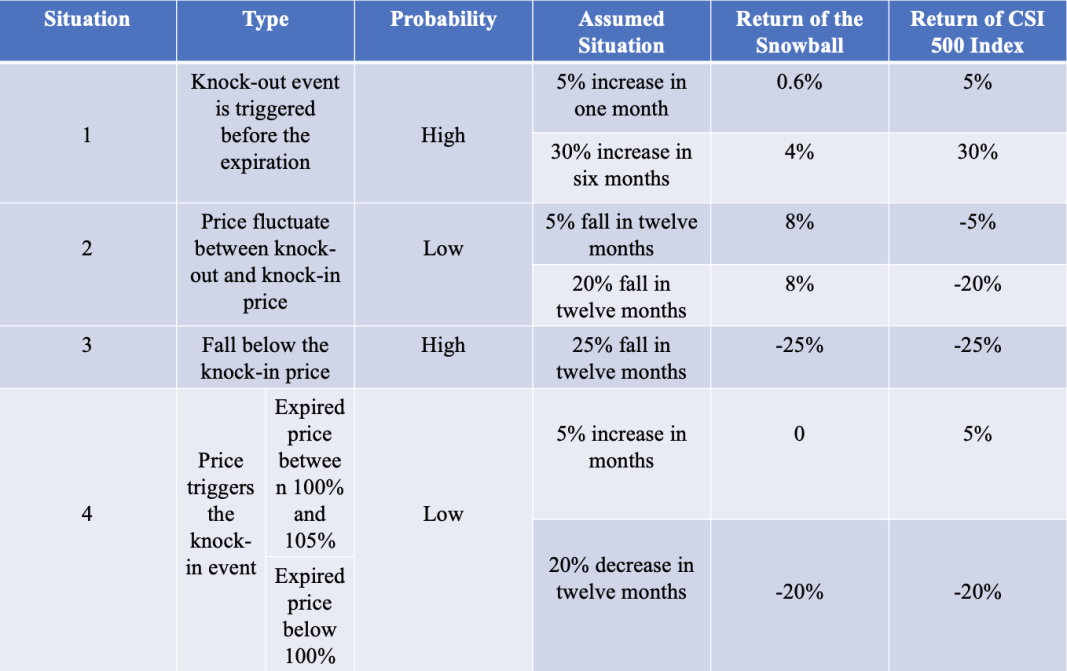
Figure 2: Comparison of four situations.
In addition to the market itself, we should also take more factors into consideration. From the primary mechanism of Snowball products, it is a product that relies on market swings. However, when more and more sellers in the market make money from market swings, the volatility of the market will gradually weaken and finally stabilize. When volatility becomes stable, the return of the products will decrease, and the brokerages' returns will decrease as well. brokerages will pass on the risk of declining returns to buyers by reducing the annualized rate of return or controlling the scale of issuance. A controlled scale means that Snowball products have a specific capacity and cannot be issued without restrictions.
In terms of volatility, the CSI 500 index is safer than other individual stocks. However, the term of the Snowball products is mainly one to two years, and the occurrence of the black swan or gray rhino events in the market may lead to significant losses. Under the current changing international situation, the tense relations between China and the United States, the friction between the United States, Russia and other countries, as well as the tightened monetary policy of the Federal Reserve can all be regarded as potential black swans, which in turn affect global risky assets.
The sellers are the neutral party of the stock price in Snowball products. The rise or fall of the stock price does not affect their profitability, and only the volatility matters. However, it seems that buyers can earn a good return, but they are actually exposed to the risk of loss caused by falling stock prices. Moreover, there is an upper limit on the investors' return, but losses are calculated based on the actual decrease of the underlying asset, which means there is no lower limit on the loss. The returns received by investors are insufficient to compensate for their risks. Therefore, Snowball may not be a win-win strategy.
4. Conclusion
Without specifically analyzing the degree of overlap between the return of a certain Snowball product and the return of the underlying asset, this paper analyses the general risk points and the general differences between the actual return and the return of the underlying asset. The reason is that the Snowball products on the market are not exactly the same. In the Chinese financial market, Snowball products provided by securities companies or private equity firms are different to a certain extent, but the underlying logic and principles are relatively similar. Therefore, by analyzing the profitability and risks of basic Snowball products, investors can have a deeper understanding of Snowball product as a whole and make future judgments based on different situations.
In the future, more types of Snowball products are likely to emerge, and the underlying asset will become more diverse, such as gold, crude oil, and commodities. Both buyers and sellers need to have a deeper understanding of Snowball products and their positions in order to better understand themselves and the market.
References
[1]. http://www.csrc.gov.cn (2022) (Accessed: 12 April 2022).
[2]. https://www.sac.net.cn (2022) (Accessed: 18 April 2022).
[3]. Sun, Y., Wu, M., Zeng, X. and Peng, Z. (2021) ‘The impact of COVID-19 on the Chinese stock market: Sentimental or substantial?’, Finance Research Letters, 38(2021), pp.101838. Available at: https://www.sciencedirect.com/science/article/pii/S1544612320316524 (Accessed: 02 February 2022).
[4]. Ward, R. (2021) China Banks Embrace Derivatives That Burned European Rivals. Available at: https://www.bloomberg.com/news/articles/2021-10-14/china-s-banks-trade-derivatives-that-have-burned-european-firms?leadSource=uverify%20wall (Accessed: 12 December 2021).
[5]. Liu, C. (2021) Where is the “Snowball” going. Available at: https://weekly.caixin.com/2021-05-08/101708019.html (Accessed: 01 July 2022).
[6]. Liu, C. and Luo, M. (2021) Snowball Derivatives Offer a Risky Bet on Stock Market Stability. Available at: https://www.caixinglobal.com/2021-05-19/snowball-derivatives-offer-a-risky-bet-on-stock-market-stability-101715201.html (Accessed: 19 September 2021).
[7]. https://www.csindex.com.cn/#/indices/family/detail?indexCode=000905 (2022) (Accessed: 13 April 2022).
[8]. https://www.51ifind.com/index.php?c=index&a=home (2022) (Accessed: 24 April 2022).
Cite this article
Qiu,S. (2023). The Relationship Between the Yield and the Degree of Overlap of Snowball and Its Underlying. Advances in Economics, Management and Political Sciences,13,40-45.
Data availability
The datasets used and/or analyzed during the current study will be available from the authors upon reasonable request.
Disclaimer/Publisher's Note
The statements, opinions and data contained in all publications are solely those of the individual author(s) and contributor(s) and not of EWA Publishing and/or the editor(s). EWA Publishing and/or the editor(s) disclaim responsibility for any injury to people or property resulting from any ideas, methods, instructions or products referred to in the content.
About volume
Volume title: Proceedings of the 2nd International Conference on Business and Policy Studies
© 2024 by the author(s). Licensee EWA Publishing, Oxford, UK. This article is an open access article distributed under the terms and
conditions of the Creative Commons Attribution (CC BY) license. Authors who
publish this series agree to the following terms:
1. Authors retain copyright and grant the series right of first publication with the work simultaneously licensed under a Creative Commons
Attribution License that allows others to share the work with an acknowledgment of the work's authorship and initial publication in this
series.
2. Authors are able to enter into separate, additional contractual arrangements for the non-exclusive distribution of the series's published
version of the work (e.g., post it to an institutional repository or publish it in a book), with an acknowledgment of its initial
publication in this series.
3. Authors are permitted and encouraged to post their work online (e.g., in institutional repositories or on their website) prior to and
during the submission process, as it can lead to productive exchanges, as well as earlier and greater citation of published work (See
Open access policy for details).
References
[1]. http://www.csrc.gov.cn (2022) (Accessed: 12 April 2022).
[2]. https://www.sac.net.cn (2022) (Accessed: 18 April 2022).
[3]. Sun, Y., Wu, M., Zeng, X. and Peng, Z. (2021) ‘The impact of COVID-19 on the Chinese stock market: Sentimental or substantial?’, Finance Research Letters, 38(2021), pp.101838. Available at: https://www.sciencedirect.com/science/article/pii/S1544612320316524 (Accessed: 02 February 2022).
[4]. Ward, R. (2021) China Banks Embrace Derivatives That Burned European Rivals. Available at: https://www.bloomberg.com/news/articles/2021-10-14/china-s-banks-trade-derivatives-that-have-burned-european-firms?leadSource=uverify%20wall (Accessed: 12 December 2021).
[5]. Liu, C. (2021) Where is the “Snowball” going. Available at: https://weekly.caixin.com/2021-05-08/101708019.html (Accessed: 01 July 2022).
[6]. Liu, C. and Luo, M. (2021) Snowball Derivatives Offer a Risky Bet on Stock Market Stability. Available at: https://www.caixinglobal.com/2021-05-19/snowball-derivatives-offer-a-risky-bet-on-stock-market-stability-101715201.html (Accessed: 19 September 2021).
[7]. https://www.csindex.com.cn/#/indices/family/detail?indexCode=000905 (2022) (Accessed: 13 April 2022).
[8]. https://www.51ifind.com/index.php?c=index&a=home (2022) (Accessed: 24 April 2022).