


1. Introduction
Volatility in the stock market represents risk and uncertainty, which are directly related to the return of the risk premium of the stock market [1]. Chicago Board Options Exchange (CBOE) calculates the 30-day expected volatility of the U.S. stock market based on real-time and mid-quote prices of S&P 500 Index (SPX℠) call and put options, the CBOE Volatility Index (VIX), since 1990. VIX is considered one of the best measures of volatility and is widely used in portfolio management and market analysis. News and stock markets are highly correlated [2]. In the study done by Baker et al. [3], the Equity Market Volatility (EMV) trackers were introduced and they linked newspapers on different categories and VIX together. With EMV trackers, a relation between policy news and stock market volatility was drawn out.
Though there are a lot of studies on VIX or EMV trackers [4,5], the analysis of news and volatility in different market situations has not been done. In this paper, a more detailed analysis of EMV trackers and VIX categorized by monthly log returns will be performed.
In the first step, the characteristics and number of regimes are determined, and every month recorded in VIX and EMV trackers is categorized. This is done by maximizing the likelihood of the underlying distribution of monthly log returns while supposing the underlying distribution is a mixture of normal distributions from each category. With the categorized months, a regression analysis between EMV trackers and VIX of the months in each regime is done to figure out the importance of each factor in EMV trackers in each market regime. The purpose of this analysis is to explicitly investigate the effectiveness of factors under different regimes, which fills the gap in related research.
2. Literature Review
In the study done by Bekaert et al. [1], volatility is suggested to have a strong relationship with the risk premium return. As found by Becker and his colleagues [5], VIX includes the historical jump activity and information about future jump activity which contributes to the price volatility. In the study done by Shu and Zhang, bidirectional causality is found between VIX and VIX futures prices [6]. The VIX is used as a measurement of volatility and its return in a variety of studies [7,8].
News and stock markets are highly correlated, as proved by the studies done by Andersen et al. [2] and other researchers. Baker et al. [3] introduced the (EMV) trackers and found a relationship between policy news and stock market volatility. In recent studies, such as the one done by Baker et al. [4], EMV trackers are used to measure the effect of a particular factor, infectious diseases, especially during the COVID-19 pandemic period. Their study also suggests that government restrictions and social distancing in service-oriented economics cause COVID-19, which has a larger impact on economics than other infectious diseases.
The literature suggests that the VIX index is useful in concluding volatility in the stock market and the EMV trackers can be employed to figure out relationships between factors and VIX, but the analysis of news and volatility in the different market situations has not been done. This study performs an analysis of EMV trackers and VIX and finds the effective factors in different market situations categorized by monthly log returns of VIX.
3. Method
3.1. Raw Data Processing
Before categorization, let t represent the number of months since March 1990, and the monthly log returns of VIX are calculated as
Xt = log ( VIXt / VIXt - 1 )(1)
Since the VIX is related to the risk premium [1], the term VIXt / VIXt - 1, the ratio of VIX’s in month t and month t-1, measures the returns of VIX. The log is used here on the monthly returns of VIX to reduce the range of the monthly returns of VIX while preserving their difference.
3.2. Categorization
Then, the Gaussian Mixture Models (GMM) [9] implemented in Scikit-learn [10] are used on the Xt. In the GMM, all the monthly log returns of VIX (Xt) are assumed to be sampled from a combination of a finite number of Gaussian distributions with unknown parameters, and unknown parameters are determined by maximizing the likelihood of having all Xt from the distributions of parameters.
To select the number of categories and covariance type of the GMM, an implementation of the Bayes Information criterion (BIC) [11] in Scikit-learn [10] is used to measure the performance of GMM with the number of categories from 1 to 9 and various covariance types.
3.3. Features Selection
The feature selection is performed with subsets of monthly EMV trackers and VIX: the whole data set and the data split according to the categorization result given by the best GMM.
In each subset, an elastic net [12] with cross-validation implemented in Scikit-learn [11] is performed to identify the weights of each tracker in EMV trackers. The elastic net is a modified linear regression algorithm composed of least absolute shrinkage and selection operator (LASSO) and ridge regression, which penalizes both L1 and L2 norms with different weights. Since the elastic net is a combination of LASSO and ridge regression, the problem of selecting correlated features in LASSO and ridge regression will appear [13,14]. Cross-validation is used here to find the best penalties for L1 and L2 norms in the elastic net.
To emphasize the independence of features, an elastic net with cross-validation is performed again on the EMV trackers removing each feature. Comparing the R2 scores of the models, the feature with the lowest scores means its removal causes the largest decrease in performance, as its independent effect.
4. Data
The monthly adjusted closing price of VIX is used for this study. Figure 1 shows the monthly adjusted closing price of VIX from February 1990 to August 2022, 391 months in total. VIX is sensitive and its changes reflex the financial market fluctuations. For example, the highest value of 59.89 appeared in October 2008, as the global financial crisis was triggered by Lehman Brothers and caused panic in September. A more recent peak is 53.54 in March 2020, reflecting the stock market crash triggered by COVID-19.
In the analysis in the second step, EMV trackers are employed to measure the importance of each factor, as represented by the EMV tracker value. Among the 45 factors in EMV trackers, the Overall EMV Tracker is ignored, since it is a conclusive value that cannot be split into detailed factors. The remaining trackers used in this analysis include factors such as the Policy-Related EMV Tracker, Infectious Disease EMV Tracker, Macroeconomic News, and Outlook EMV Tracker.
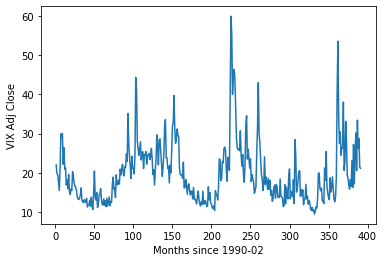
Figure 1: The monthly adjusted closing price of VIX.
5. Result
5.1. Selecting the Number of Regimes and Correlation Between Regimes
First, the performances among combinations of regime number from 1 to 9 and the covariance types of spherical, tied, diag, and full are measured and compared by their BIC scores. As marked ∗ in Figure 2, the model with 2 regimes and the covariance type of full has the lowest BIC score. Thus, the model representing 2 regimes with the correlation between regimes is most likely to be the actual distribution of monthly log returns of VIX.
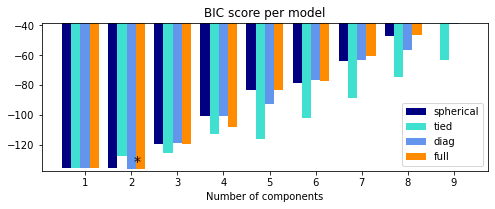
Figure 2: BIC score per model.
5.2. Categorization
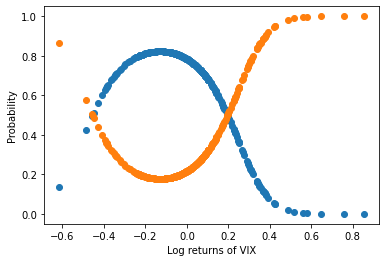
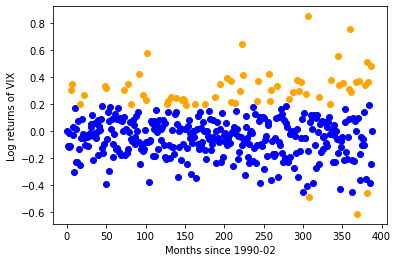
By the model found in the BIC score comparison, the log returns of VIX are categorized into 2 regimes. Regime 1 has a mean of -0.04762366 and regime 2 has a mean of 0.1012904. The probabilities of each log return of VIX being categorized into regimes are shown in Figure 3, and Figure 4 shows the categorization of each data point. As displaced by Figure 3 and 4, it can be seen that the regime in orange mostly captures the extreme values of monthly log returns of VIX, and the months with monthly log returns of VIX from -0.4 to 0.2 are more likely to be categorized into the other regime.
|
|
Figure 3: Regimes probabilities. | Figure 4: Categorization. |
5.3. Feature Selection
The R2 scores of the elastic net models with cross-validation that take EMV trackers of all months, months in regime 1, and months in regime 2 as input are shown in Table 1. The model performs relatively well with the data in regime 2, the more extreme regime.
In regime 1 with a lower mean, as presented in Table 2, only Macroeconomic News and Outlook EMV Tracker and Policy-Related EMV Tracker have nonzero weights assigned by the elastic net. Combined with R2 scores after removing a factor in Table 3, the Policy-Related EMV Tracker is able to affect VIX in regime 1 by itself, while Macroeconomic News and Outlook EMV Tracker have a larger effect as a combination of different factors in macroeconomics. The rest of the factors do not have a significant effect on VIX, as they are assigned with zero weights and have little or no impact on R2 scores upon their removal.
In regime 2, more features are selected by the elastic net as shown in Table 4. Policy-Related EMV Tracker plays an important role in regime 2 as it does in regime 1, and more policy and government-related factors like Government Spending, Deficits, and Debt EMV Tracker, Monetary Policy EMV Tracker, and Fiscal Policy EMV Tracker affect VIX in regime 2 independently as presented in Table 5. Infectious Disease EMV Tracker has the largest impact on its removal, while also being assigned with considerable weight, unlike the zero weight and the little impact on R2 scores of Infectious Disease EMV Tracker in regime 1.
Presented in Tables 6 and 7, the results of the elastic net using months in both regimes emphasize the importance of Policy-Related EMV Tracker and Macroeconomic News and Outlook EMV Tracker, as we have in separated regimes 1 and 2. The Interest Rates EMV Tracker, though it does not appear in regimes 1 and 2, is an effective factor in the overall analysis. Infectious Disease EMV Tracker is not present here, so it is probably only important in regime 2, the months with extreme monthly log returns of VIX.
Table 1: R2 score of regimes.
Regime | R2 Score |
All | 0.5993368050296248 |
Regime 1 | 0.4491292363267891 |
Regime 2 | 0.645237721700908 |
Table 2: 5 factors with highest absolute weights in the regime 1.
Factor | Weight |
Macroeconomic News and Outlook EMV Tracker | 0.5949249182052838 |
Policy-Related EMV Tracker | 0.23035639847511685 |
Infectious Disease EMV Tracker | 0.0 |
Macro – Broad Quantity Indicator | 0.0 |
Macro – Inflation EMV Indicator | 0.0 |
Table 3: 5 factors with lowest R2 scores in the regime 1.
Factor | R2 scores |
Policy-Related EMV Tracker | 0.4330431953699144 |
Macro – Inflation EMV Indicator | 0.4491292363267891 |
Macro – Interest Rates EMV Tracker | 0.4491292363267891 |
Macro – Other Financial Indicators EMV Tracker | 0.4491292363267891 |
Macro – Labor Markets EMV Tracker | 0.4491292363267891 |
Table 4: 5 factors with highest absolute weights in the regime 2.
Factor | Weight |
Commodity Markets EMV Tracker | 0.4031076976606048 |
Macroeconomic News and Outlook EMV Tracker | 0.3131709722613597 |
Policy-Related EMV Tracker | 0.2987898782287345 |
Infectious Disease EMV Tracker | 0.2044388691562725 |
Government Spending, Deficits, and Debt EMV Tracker | -0.1640516093539864 |
Table 5: 5 factors with lowest R2 scores in the regime 2.
Factor | R2 scores |
Infectious Disease EMV Tracker | 0.557852931486179 |
Policy-Related EMV Tracker | 0.605710600405019 |
Government Spending, Deficits, and Debt EMV Tracker | 0.615069293445465 |
Monetary Policy EMV Tracker | 0.642150898417583 |
Fiscal Policy EMV Tracker | 0.645236740273728 |
Table 6: 5 factors with highest absolute weights in all regimes.
Factor | Weight |
Macroeconomic News and Outlook EMV Tracker | 0.5284155301498374 |
Policy-Related EMV Tracker | 0.4044228859752246 |
Financial Regulation EMV Tracker | 0.3718484489920173 |
Macro – Interest Rates EMV Tracker | -0.327944627156187 |
Commodity Markets EMV Tracker | 0.22846604773455176 |
Table 7: 5 factors with lowest R2 scores in all regimes.
Factor | R2 scores |
Policy-Related EMV Tracker | 0.567570408134628 |
Macro – Interest Rates EMV Tracker | 0.5693375516386966 |
Macroeconomic News and Outlook EMV Tracker | 0.5740034078210737 |
Trade Policy EMV Tracker | 0.5848263314966715 |
Government Spending, Deficits, and Debt EMV Tracker | 0.5896612880412517 |
6. Conclusion
In this paper, the effective factors in regimes presented by VIX are investigated. First, there are two regimes in the log returns of VIX from February 1990 to August 2022. Regime 1 with a lower mean covers most of the months, and regime 2 captures the months of extreme log returns of VIX. Second, it is found that the policy-related factor significantly affects VIX independently. Besides, Macroeconomics affects the most in regime 1, while VIX is more likely to be affected by infectious disease and various policy factors in regime 2.
In the regression analysis part of this study, the models may not precisely represent the actual relationships between VIX and EMV trackers. And the results of regime 2 may not be very accurate due to the relatively small sample size. For further investigation, more monthly VIX data will improve the reliability of the analysis, especially in regime 2, and a better feature selection regression algorithm will probably make the feature selection models reflect the actual relationships better.
References
[1]. Bekaert, G. and Hoerova, M.: The vix, the variance premium and stock market volatility. Journal of econometrics 183(2), 181–192 (2014).
[2]. Andersen, T. G., Bollerslev, T., Diebold, F. X., and Vega, C.: Real-time price discovery in global stock, bond and foreign exchange markets. Journal of International Economics 73(2), 251–277 (2007).
[3]. Baker, S. R., Bloom, N., Davis, S. J., and Kost, K. J.: Policy news and stock market volatility (2019).
[4]. Baker, S. R., Bloom, N., Davis, S. J., Kost, K., Sammon, M., and Viratyosin, T.: The unprecedented stock market reaction to covid-19. The review of asset pricing studies 10, 4 (2020), 742–758.
[5]. Becker, R., Clements, A. E., and McClelland, A.: The jump component of s&p 500 volatility and the vix index. Journal of Banking & Finance 33(6), 1033–1038 (2009).
[6]. Shu, J., and Zhang, J. E.: Causality in the VIX futures market. Journal of Futures Markets 32(1), 24-46 (2012).
[7]. Basher, S. A., and Sadorsky, P.: Hedging emerging market stock prices with oil, gold, VIX, and bonds: A comparison between DCC, ADCC and GO-GARCH. Energy Economics, 54, 235-247(2016).
[8]. Dash, S., and Moran, M. T.: VIX as a companion for hedge fund portfolios. The Journal of Alternative Investments, 8(3), 75-80 (2005).
[9]. Reynolds, D. A.: Gaussian mixture models. Encyclopedia of biometrics 741, 659-663 (2009).
[10]. Pedregosa, F., Varoquaux, G., Gramfort, A., Michel, V., Thirion, B., Grisel, O., Blondel, M., Prettenhofer, P., Weiss, R., Dubourg, V., Vanderplas, J., Passos, A., Cournapeau, D., Brucher, M., Perrot, M., and Duchesnay, E. Scikit-learn: Machine learning in Python. Journal of Machine Learning Research 12, 2825–2830 (2011).
[11]. Schwarz, G.: Estimating the Dimension of a Model. The Annals of Statistics 6(2), 461–464 (1978).
[12]. Zou, H., and Hastie, T.: Regularization and variable selection via the elastic net. Journal of the royal statistical society: series B (statistical methodology) 67(2), 301–320 (2005).
[13]. Marquaridt, D. W.: Generalized inverses, ridge regression, biased linear estimation, and nonlinear estimation. Technometrics 12(3), 591–612 (1970).
[14]. Zhang, Z., Xiahou, J., Bai, Z.-J., Hancock, E. R., Zhou, D., Chen, S.-B., and Chen, L.: Discriminative lasso, Cognitive Computation 8(5), 847–855 (2016).
Cite this article
Zhang,J. (2023). Effective Factors under Stock Market Regimes. Advances in Economics, Management and Political Sciences,13,52-58.
Data availability
The datasets used and/or analyzed during the current study will be available from the authors upon reasonable request.
Disclaimer/Publisher's Note
The statements, opinions and data contained in all publications are solely those of the individual author(s) and contributor(s) and not of EWA Publishing and/or the editor(s). EWA Publishing and/or the editor(s) disclaim responsibility for any injury to people or property resulting from any ideas, methods, instructions or products referred to in the content.
About volume
Volume title: Proceedings of the 2nd International Conference on Business and Policy Studies
© 2024 by the author(s). Licensee EWA Publishing, Oxford, UK. This article is an open access article distributed under the terms and
conditions of the Creative Commons Attribution (CC BY) license. Authors who
publish this series agree to the following terms:
1. Authors retain copyright and grant the series right of first publication with the work simultaneously licensed under a Creative Commons
Attribution License that allows others to share the work with an acknowledgment of the work's authorship and initial publication in this
series.
2. Authors are able to enter into separate, additional contractual arrangements for the non-exclusive distribution of the series's published
version of the work (e.g., post it to an institutional repository or publish it in a book), with an acknowledgment of its initial
publication in this series.
3. Authors are permitted and encouraged to post their work online (e.g., in institutional repositories or on their website) prior to and
during the submission process, as it can lead to productive exchanges, as well as earlier and greater citation of published work (See
Open access policy for details).
References
[1]. Bekaert, G. and Hoerova, M.: The vix, the variance premium and stock market volatility. Journal of econometrics 183(2), 181–192 (2014).
[2]. Andersen, T. G., Bollerslev, T., Diebold, F. X., and Vega, C.: Real-time price discovery in global stock, bond and foreign exchange markets. Journal of International Economics 73(2), 251–277 (2007).
[3]. Baker, S. R., Bloom, N., Davis, S. J., and Kost, K. J.: Policy news and stock market volatility (2019).
[4]. Baker, S. R., Bloom, N., Davis, S. J., Kost, K., Sammon, M., and Viratyosin, T.: The unprecedented stock market reaction to covid-19. The review of asset pricing studies 10, 4 (2020), 742–758.
[5]. Becker, R., Clements, A. E., and McClelland, A.: The jump component of s&p 500 volatility and the vix index. Journal of Banking & Finance 33(6), 1033–1038 (2009).
[6]. Shu, J., and Zhang, J. E.: Causality in the VIX futures market. Journal of Futures Markets 32(1), 24-46 (2012).
[7]. Basher, S. A., and Sadorsky, P.: Hedging emerging market stock prices with oil, gold, VIX, and bonds: A comparison between DCC, ADCC and GO-GARCH. Energy Economics, 54, 235-247(2016).
[8]. Dash, S., and Moran, M. T.: VIX as a companion for hedge fund portfolios. The Journal of Alternative Investments, 8(3), 75-80 (2005).
[9]. Reynolds, D. A.: Gaussian mixture models. Encyclopedia of biometrics 741, 659-663 (2009).
[10]. Pedregosa, F., Varoquaux, G., Gramfort, A., Michel, V., Thirion, B., Grisel, O., Blondel, M., Prettenhofer, P., Weiss, R., Dubourg, V., Vanderplas, J., Passos, A., Cournapeau, D., Brucher, M., Perrot, M., and Duchesnay, E. Scikit-learn: Machine learning in Python. Journal of Machine Learning Research 12, 2825–2830 (2011).
[11]. Schwarz, G.: Estimating the Dimension of a Model. The Annals of Statistics 6(2), 461–464 (1978).
[12]. Zou, H., and Hastie, T.: Regularization and variable selection via the elastic net. Journal of the royal statistical society: series B (statistical methodology) 67(2), 301–320 (2005).
[13]. Marquaridt, D. W.: Generalized inverses, ridge regression, biased linear estimation, and nonlinear estimation. Technometrics 12(3), 591–612 (1970).
[14]. Zhang, Z., Xiahou, J., Bai, Z.-J., Hancock, E. R., Zhou, D., Chen, S.-B., and Chen, L.: Discriminative lasso, Cognitive Computation 8(5), 847–855 (2016).