


1. Introduction
North Carolina has had the highest sweet potato production since 1971 [1]. The annual yield of sweet potatoes is closely related to precipitation, as they cannot be submerged for a long time [2]. Low sweet potato yields bring low incomes to farmers, but currently, no strategy can reduce financial risk for them in North Carolina. Index insurance has been used in agriculture since 1920 in developing countries. It pays customers based on the occurrence of events beyond the threshold, such as an excess amount of rain [2]. However, it is not frequently used in the United States. Index insurance has been shown beneficial for crops in other developed countries. In 2018, Jarrod et al. forecast the yield of cane sugar in Australia by sum rainfall as indexes. They evaluate different index levels on the generalized additive model and quantile regression. Finally, Jarrod et al. set the premiums based on the indexes, and they conclude that the index insurance transferred risks and helps farmers financially [3]. Nevertheless, they do not cover the prediction of precipitations, which helps predict yield and adjust premiums each year [3]. The design of the index insurance requires frequent adjustment, as the average loss is changing and so do the premiums. In this paper, the losses of farmers are based on the annual yield of sweet potatoes in a county, and the yield is based on precipitation instead of the number of occurrences whenever precipitation is above a level. The time series linear model will be used to forecast precipitation. Yield is then predicted based on the precipitation during the seeding, growing, and harvesting month. The study result indicates that the precipitation model can catch the overall trend and seasonality of the precipitation data, and the yield model can predict the future yield despite the error in the predicted precipitation. These two models developed in this paper can be used to set the premium from the loss from less yields, and the threshold can be set based on the trade-off between the index level and reimbursement of each claim.
2. Methodology
2.1. Data
The first dataset is county-level sweet potato annual yield in North Carolina, from the United States Department of Agriculture: National Agricultural Statistics Service; the second dataset is city-level monthly precipitation in North Carolina in inches, from the US climate data.
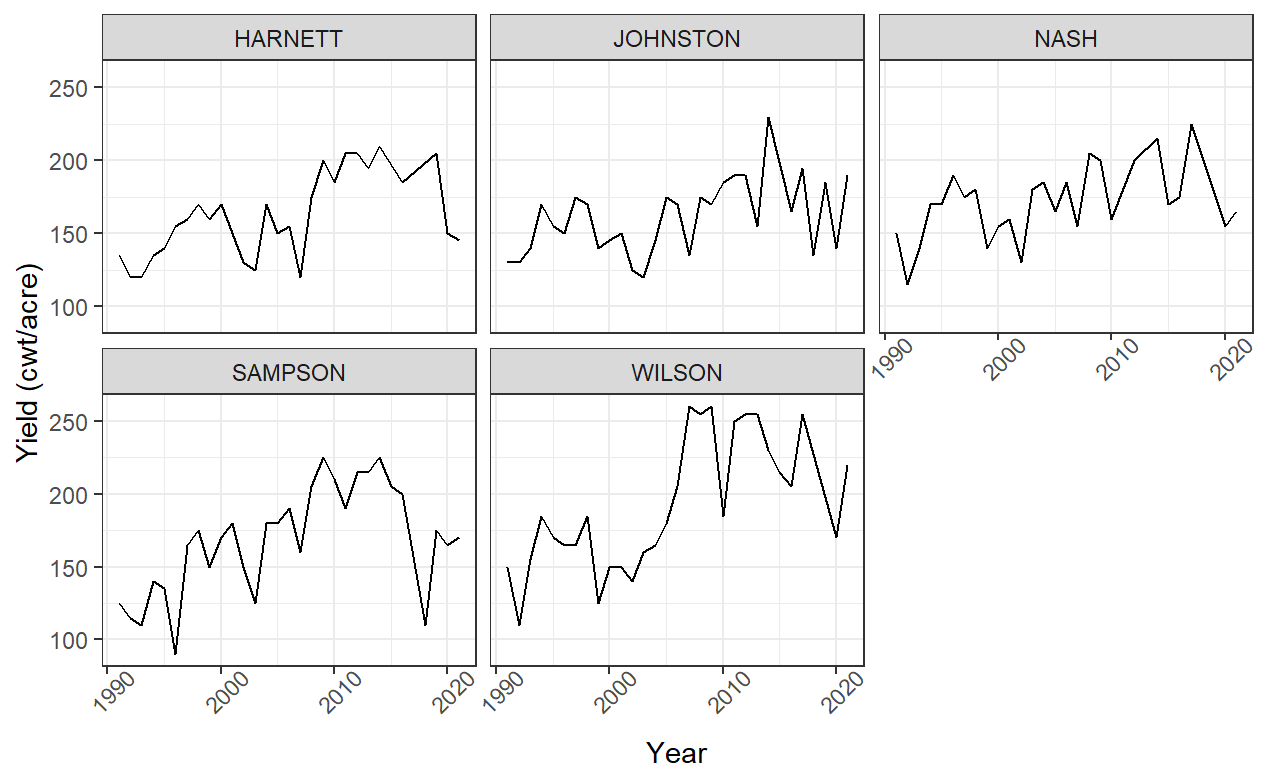
Figure 1: Time series plots of Yield over Year for five counties chosen in the study.
Most recent thirty-years (1991-2001) annual yields are selected to visualize the trend and seasonality in the time series plot. Five counties with the top five sweet potato yields in 2020 are chosen to simplify the modeling process. They are Harnett, Johnston, Nash, Sampson, and Wilson. These five states accumulate 48.76% of sweet potatoes in North Carolina in 2020 (Facts about North Carolina Sweet Potato Production; Table 1.) Simple time series plots for each of the five states show increasing trends. Sharp increases occur between 2005 and 2010 for Harnett, Sampson, and Wilson; on the other hand, the yields in Johnston and Nash County increase slowly in the long run. These five counties have similar mean, but Sampson and Wilson have a greater variance (Table 2), bringing high risk in predicting the future yield. The determination of premium for index insurance in these two counties needs more consideration.
Table 1: Description of yield data used in the study.
County | City | 2020 Yield in lb. | Percentage | Survey Times |
Harnett | Dunn | 47,000,000 | 2.76% | 7 |
Johnston | Smithfield | 155,000,000 | 9.12% | 9 |
Nash | None | 187,000,000 | 11.00% | 7 |
Sampson | Clinton | 259,000,000 | 15.24% | 9 |
Wilson | Wilson | 181,000,000 | 10.65% | 9 |
Total | 829,000,000 | 48.76% |
Table 2: Summary statistics of Yield in the five counties.
County | Mean | Variance |
Harnett | 161.607 | 824.173 |
Johnston | 161.000 | 652.413 |
Nash | 170.926 | 650.071 |
Sampson | 168.333 | 1347.713 |
Wilson | 192.241 | 2022.486 |
Most city-level monthly precipitation data are from 2009 to 2018, so the merged data set will restrict yield data to this time frame. The report counts for the five states are in Table 1. Johnston, Sampson, and Wilson have all annual reports available from 2009 to 2018, while Harnett and Nash have 7 of 9 years (Table 1.) The precipitation of one major city within each county is used to represent the data of that county. Because no city-level data is available within Nash County, it is excepted from this study. For the rest four counties, precipitation at Dunn matches that of Harnett County, at Smithfield matches that of Johnston County, at Clinton matches that of Sampson County, and at Wilson matches of Wilson County (Table 1.) Harnett has a missing monthly precipitation value for each month in 2015. To ensure the completeness of analysis, blank data is filed by the simple forecasting method, in which each monthly precipitation data in 2015 is predicted from the same monthly precipitation data from 2009 to 2014 in a simple linear model. The Johnston, Sampson, and Wilson Counties have precipitation data available in 2019 except December. These extra data can serve as a comparison to the predicted precipitation.
Time series plots for each of the four counties are in Fig. 2. Harnett county has variance changing over time and four peak precipitation values in the middle of 2009, 2013, 2016, and 2018. Almost all the precipitation data are less than 10 inches in Johnston County. It has no significant peak values and seems to be stationary. Sampson County has one noticeable peak in the middle to late 2018. This peak value represents a serve storm event, which is influential to the yield. It matches the sharp decreases in Fig.1. of Sampson County sweet potato yield in 2018. Many peaks are present in the precipitation data of Wilson, and there are two higher than others. One is in mid-2011 while the other is in mid-2013.
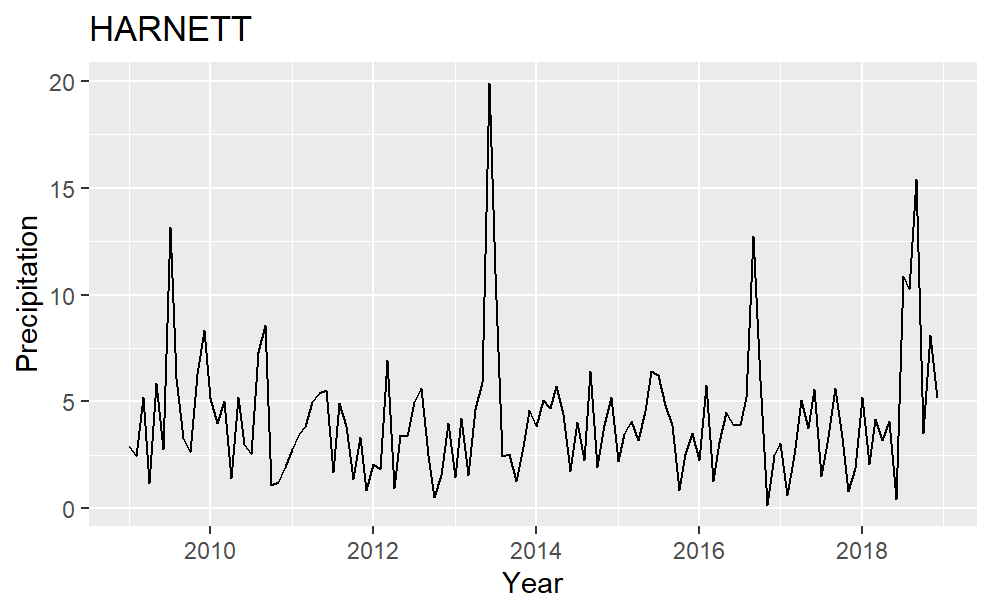
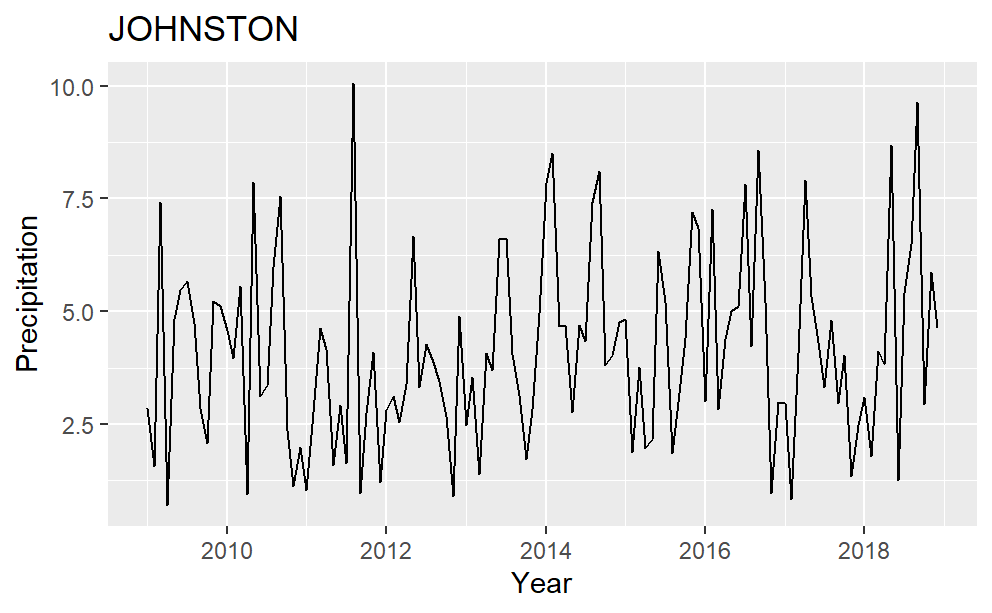
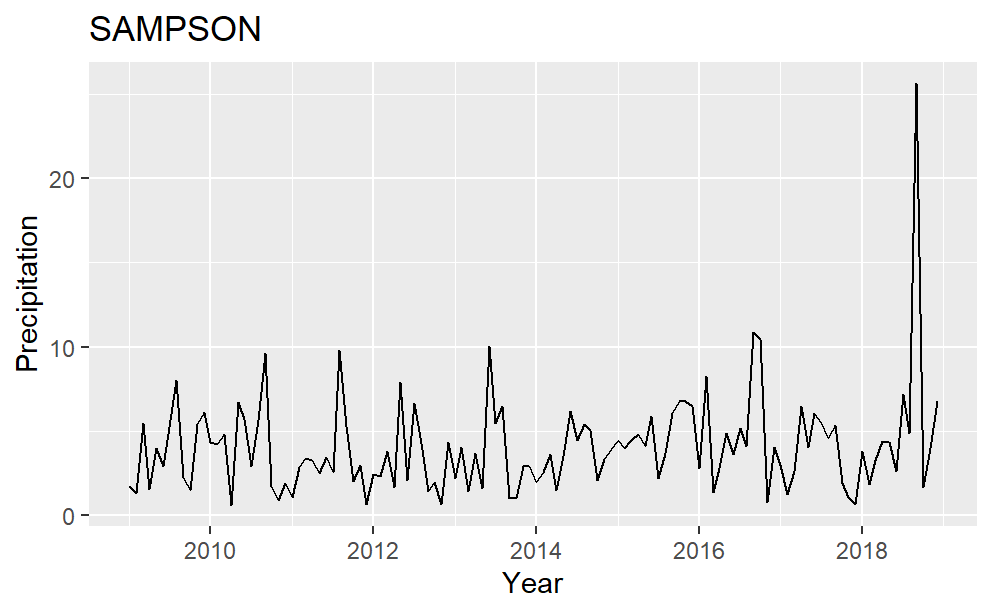
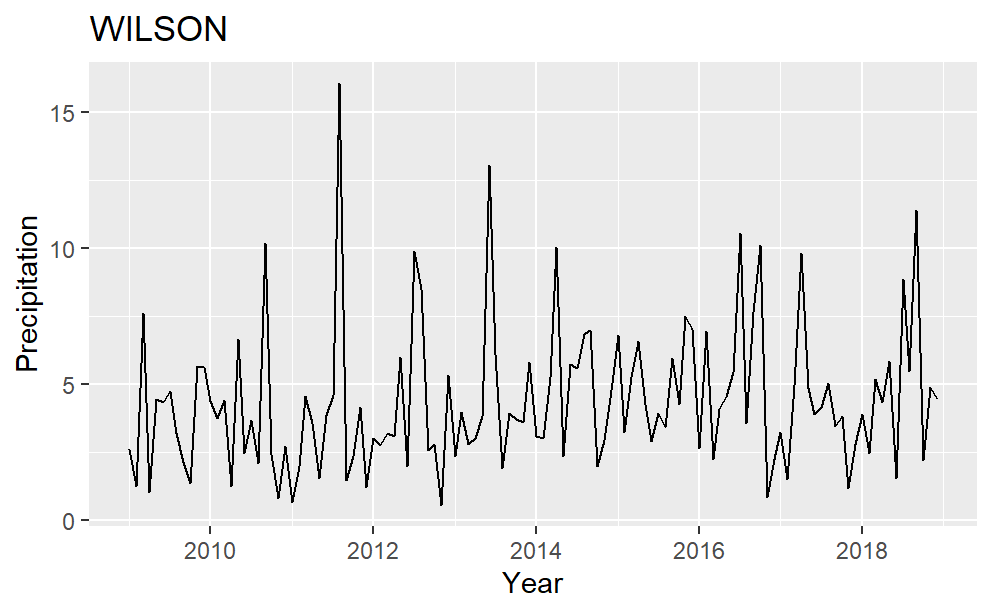
Figure 2: Precipitation plot over time for the four counties in the study.
First Lag in the ACF plot represents the correlation between two consecutive data, the second lag represents the correlation between every other data, and so on. Typically, annual data show a positive correlation between data from the same months. However, in the precipitation ACF plot, the 12th lag is not significantly positive. As a result, the seasonality is not every twelve months. Other strategies to account for seasonal variation are in need.
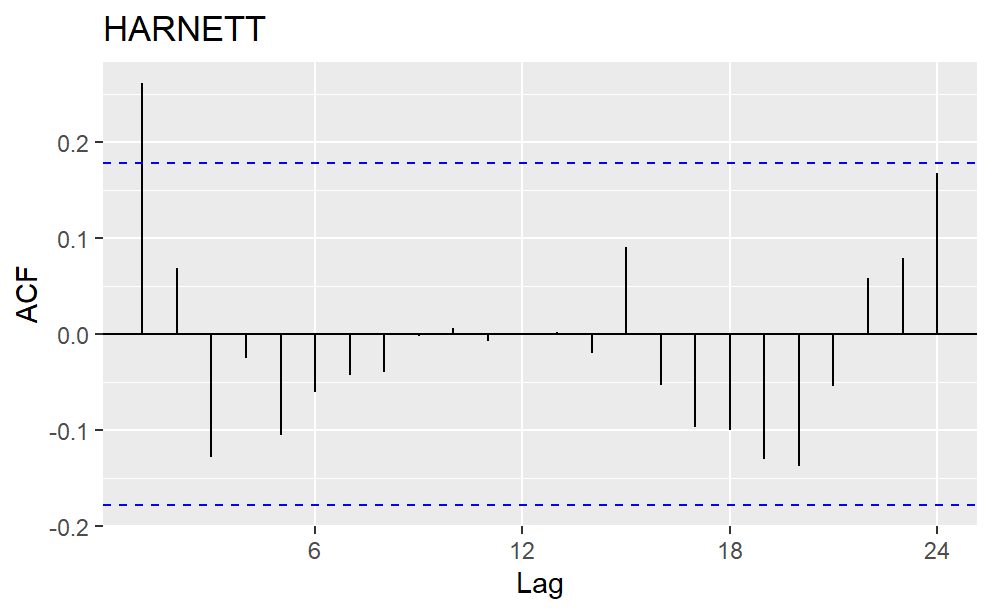
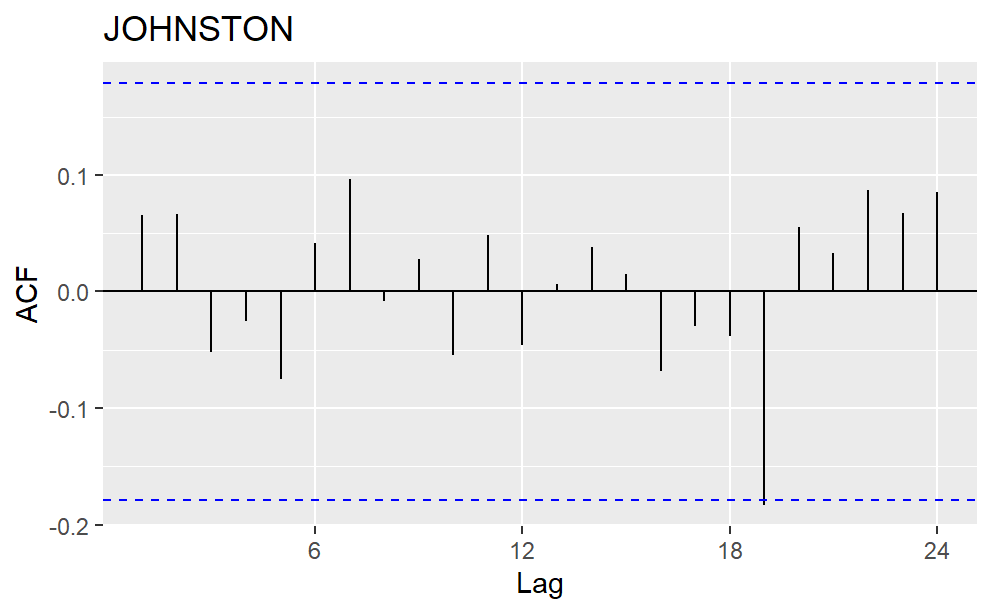
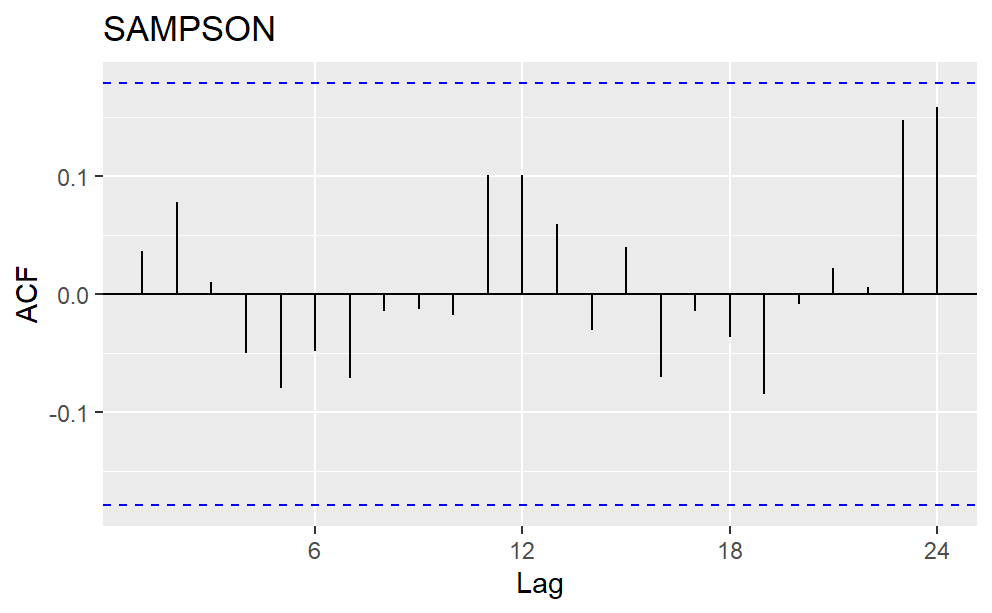
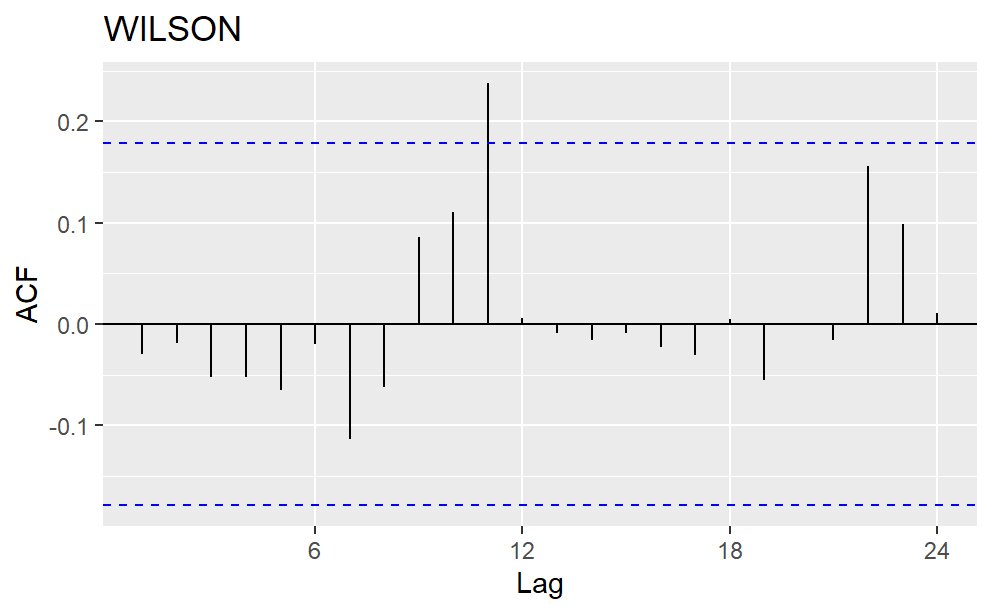
Figure 3: Autocorrelation Plot (ACF) for the precipitation data of four counties.
2.2. Method
The sweet potato index insurance in North Carolina has three steps. First, future precipitation data is forecasted based on lag values and seasons; second, the yield of sweet potato is approximated using precipitation achieved in the first step; third, insurance premiums are determined by the number of excess rainfalls in a given year. The focus of this study will be the first two steps. Two separate models are involved: the precipitation model and the yield model.
The precipitation model uses linear time series forecasting. The formula of this model is:
Yt = β1 * Yt-1 + β2 * Season2 + β3 * Season3 + β4 * Season4 + εt(1)
Response variable Yt is precipitation at time t, the Yt-1 is precipitation at time t-1, also known as the first lag. The four β are the coefficient of variables and εt is the error term. Season2 is a binary variable with a value of 1 for April, May, and June. Similarly, binary variable Season3 has value 1 for July, August, and September. Binary Season4 has value 1 for October, November, and December. If none of these three season variables are 1, that means it is in January, February, or March. The setting of using three seasonal factors representing four seasons avoids multicollinearity, which can lead to error in programming and poor predictability [4].
The yield model is a linear model between sweet potato yield and monthly precipitation. The formula of this model is:
Yt = θ1 * yMay + θ2 * yJun + θ3 * yJul + θ4 * yAug + θ5 * ySep + εt(2)
Yt is the yield of sweet potato in year t, ymonth is the precipitation of that month in year t, θ is the coefficient of the variables, and εt is the error term. Precipitations from May to September are potential explanatory variables in the yield model, because these months represent the planting, growing, and harvesting times of the sweet potato in North Carolina. Precipitation in these months can affect the final yield of the sweet potato.
The yield model is optimized by stepwise regression, a combination of forward selection and backward elimination. The forward selection chooses a new predictor, while the backward elimination drops an existing factor. The alternate performance lowers the risk of multicollinearity and redundancy. In this stepwise selection, explanatory variables are ordered according to Mallows' Cp [5]:
Cp = SS(Res)p/s2 + 2p + n (3)
The SS(Res)p is the sum of squares of the residuals for the model with p explanatory variables. S2 is the mean square residual, N is the number of observations, and p is the number of explanatory variables. The variable with the CP will be added or deleted from the model. Then, Akaike Information Criterion (AIC) is calculated using the formula:
AIC = 2k – 2ln(L)(4)
L is the maximum value of the likelihood function and k is the number of explanatory variables. AIC reflects the predictor error. The goal for the stepwise procedure is to find the smallest Mallows’ Cp to add a new variable and find the smallest AIC with different selections of existing factors. Combining both Mallows’ Cp and AIC, the stepwise selection ensures the accuracy of the linear model [6].
After stepwise selection, Variance Inflation Factor (VIF) is evaluated to check multicollinearity again and further adjust the model:
VIF = 1/(1-R2) (5)
R2 is the coefficient of determination. A model with at least one VIF greater than 5 should be adjusted. VIF greater than 5 means the square of the coefficient of determination is at least 80%. In other words, at least 80% of the variance in the response variable has been explained by other factors. One or more variables should be dropped stepwise selection in this case [4].
3. Result
3.1. Regression Results
The fitted value of the precipitation model is in Fig.4. For each county, the model catches the trend but tends to underestimate high values, which may lower the yield heavily. This limitation may influence the prediction in the yield model. The insurance set in the third step should reflect this risk by increasing the premium.
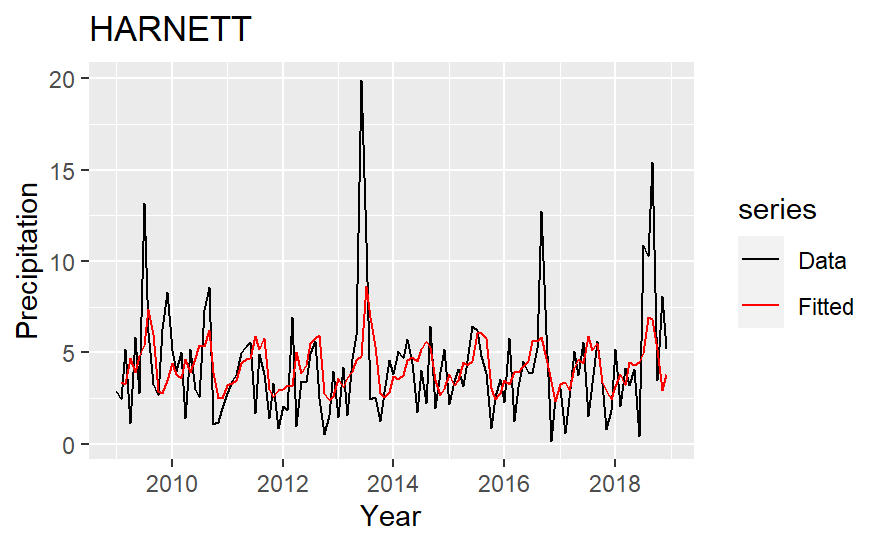
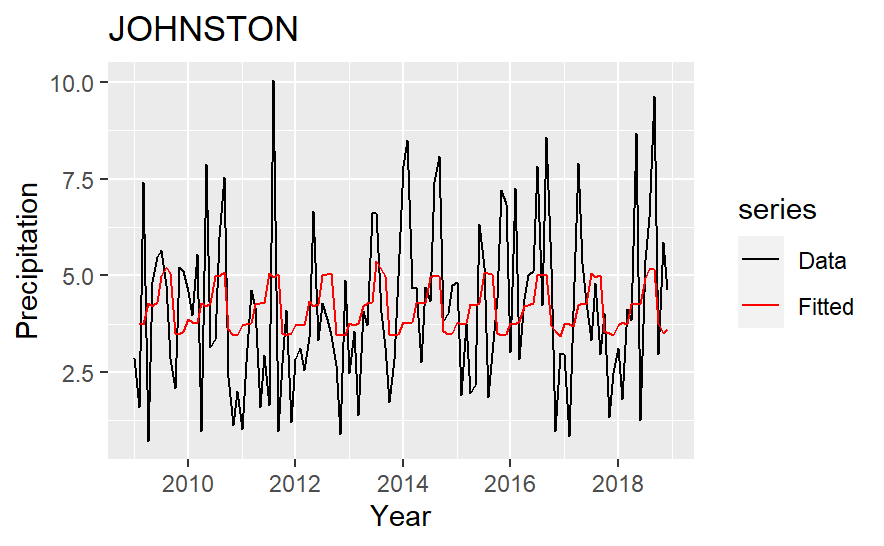
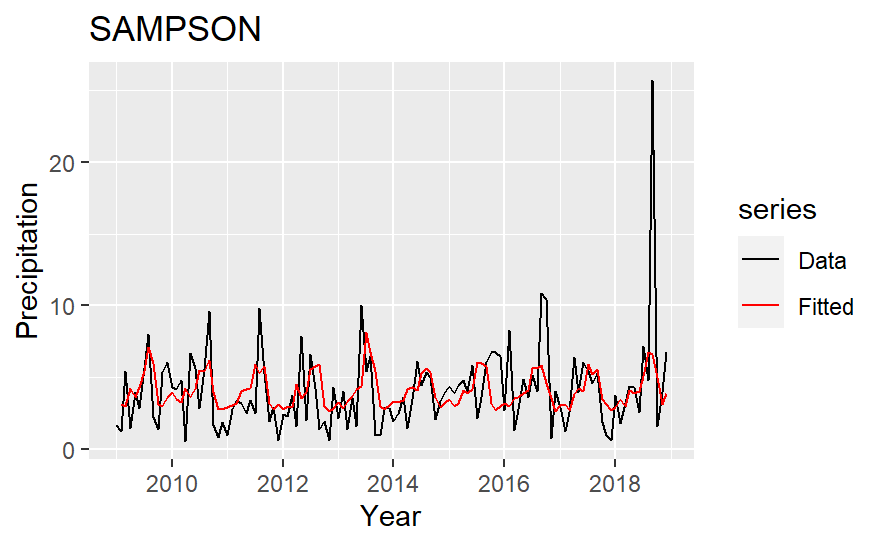
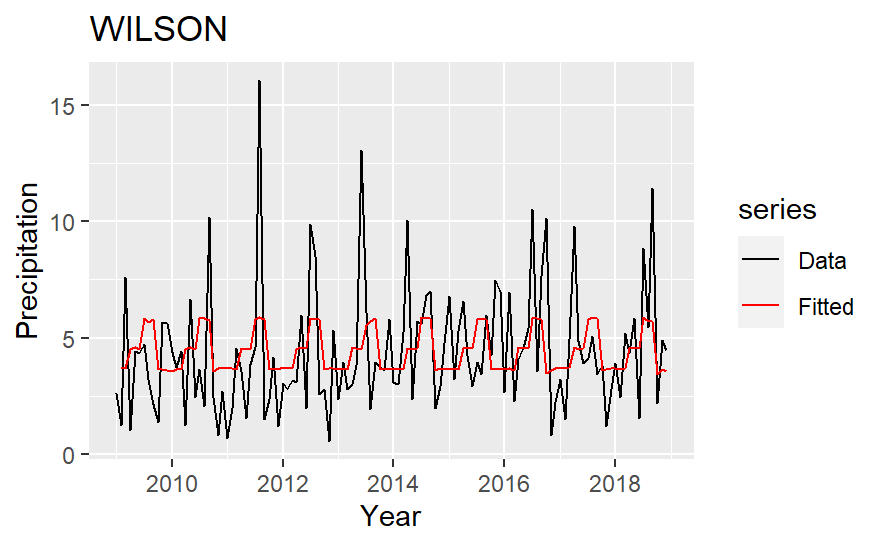
Figure 4: Actual and fitted precipitation.
Table 3: Summary statistics of Yield in the five counties.
Variable Names | Harnett | Johnston | Sampson | Wilson |
Yt-1 | 0.189* | 0.022 | 0.158 | -0.019 |
(0.089) | (0.066) | (0.090) | (0.082) | |
Season 2 | 0.863 | 0.491 | 0.782 | 0.888 |
(0.729) | (0.539) | (0.737 | (0.676) | |
Season 3 | 2.040** | 1.245* | 2.364** | 2.170** |
(0.752) | (0.556) | (0.760) | (0.697) | |
Season 4 | -0.528 | -0.254 | -0.044 | -0.020 |
| (0.729) | (0.539) | (0.737) | (0.676) |
R-squared | 0.140 | 0.047 | 0.126 | 0.078 |
No.Obs | 119 | 119 | 119 | 119 |
note: dependent variable: Precipitation at time t (Yt), standard errors reported in parenthesis | ||||
Significance Level: *** is significant at 0.001 significance level, ** is significant at 0.01 significance level, and * is significant at 0.05 significance level. | ||||
In Table 3, the coefficient of the first lag is significant for Harnett County, and that of Season3 is significant for all the counties. The significant first lag matches the high correlation in the ACF graph for Harnett County. The significant Season3 can be explained by the seasonal time series plot. Peak values tend to occur between July and September. The small R2 indicates that models are not good at predicting the exact value of the precipitation, but they can still be useful in reflecting trends and seasonality [7].
Table 4: Coefficient for the yield model.
Variable Names | Harnett | Johnston | Sampson | Wilson |
May | 0a | -23.56* | 2.931 | 0a |
(7.24) | (4.969) | |||
Jun | -1.156* | -12.667 | 1.4089 | 1.299 |
(0.171) | (8.568) | (3.646) | (1.121) | |
Jul | -0.342 | -17.825* | -2.292 | 0 a |
(0.231) | (5.638) | (3.557) | ||
Aug | -3.658* | -23.759 | -1.551 | -0.715 |
(0.529) | (9.099) | (3.765) | (0.9768) | |
Sep | -2.209* | 9.086 | -4.140* | -9.069** |
| (0.257) | (3.461) | (0.923) | (1.431) |
R-squared | 0.957 | 0.52 | 0.760 | 0.873 |
No.Obs | 7 | 10 | 10 | 8 |
note: dependent variable: Yield, standard errors reported in parenthesis a: This explanatory variable is not selected by the stepwise method for a county | ||||
Significance Level: *** is significant at 0.001 significance level, ** is significant at 0.01 significance level, and * is significant at 0.05 significance level. | ||||
In Table 4, yield models for Johnston and Sampson County include all the variables available, while models for Harnett and Wilson County exclude some variables. Three of the four counties have a significant coefficient for Sep, which represents the harvest season of the Sweet Potato. One explanation is that sweet potato is more vulnerable at this time, and farmers have no time to regrow them in the same year. The R-square is relatively large for Harnett, Sampson, and Wilson County, implying that the model is more accurate for these counties. The VIF table (Table 5) shows the potential of Multicollinearity. All variables selected by the stepwise method have VIF smaller than 5 for Harnett, Sampson, and Wilson County, which means less than 80% of the variability in that variable can be predicted by other explanatory variables. However, the yield model for Johnston County has four variables with a VIF greater than 5. It demonstrates a high risk of multicollinearity, and stepwise selection is not the optimal method to build a model for Johnston County [8].
Table 5: VIF values for the yield model.
Variable Names | Harnett | Johnston | Sampson | Wilson |
May |
| 8.092 | 3.037 |
|
Jun | 1.677 | 5.667 | 2.409 | 1.189 |
Jul | 1.461 | 8.787 | 1.179 |
|
Aug | 1.372 | 12.287 | 2.566 | 1.640 |
Sep | 1.350 | 3.072 | 1.424 | 1.514 |
3.2. Prediction
Johnston, Sampson, and Wilson County have precipitation data available for 2019 except December. Predictions are performed based on the precipitation model and are compared with actual data. The result in Table 6 shows that the precipitation model is more accurate when the precipitation change is smoothing since one predictor is the first leg. It does not respond well to high or low values, such as 12.84 on July 2019 in Johnston County and 10.34 on August 2019 in Sampson County. Nevertheless, the yield model shows a similar prediction for the annual yield of sweet potatoes.
Table 6: Actual and precited precipitation of three counties with data available in 2019.
County | Johnston | Sampson | Wilson | |||
2019 | Actual | Prediction | Actual | prediction | Actual | Prediction |
Jan | 2.35 | 3.78 | 2.60 | 3.73 | 3.42 | 3.65 |
Feb | 4.07 | 3.76 | 2.45 | 3.25 | 4.00 | 3.66 |
Mar | 3.05 | 3.76 | 3.34 | 3.18 | 3.60 | 3.66 |
Apr | 5.52 | 4.26 | 4.67 | 3.95 | 6.62 | 4.55 |
May | 2.52 | 4.27 | 2.22 | 4.07 | 2.77 | 4.54 |
Jun | 6.17 | 4.27 | 3.81 | 4.09 | 4.47 | 4.54 |
Jul | 12.84 | 6.14 | 4.96 | 5.67 | 3.71 | 5.82 |
Aug | 1.73 | 6.18 | 10.34 | 5.92 | 5.01 | 5.79 |
Sep | 6.11 | 6.18 | 9.44 | 5.96 | 5.10 | 5.79 |
Oct | 3.52 | 3.77 | 0.89 | 3.56 | 5.07 | 3.60 |
Nov | 2.99 | 3.72 | 1.59 | 3.18 | 2.69 | 3.65 |
Yield | 174.61 | 171.93 | 175.90 | 201.32 | 186.48 | 179.70 |
3.3. Discussion
Multicollinearity can damage the predictability of the linear model. As a result, explanatory variables need to be reduced for Johnston County, whose explanatory variables have VIF greater than 5. A single exclusion of Aug out of prediction decreases all the VIF values to be below 3. This indicates that Aug is correlated to other explanatory variables. After reduction, the adjusted R square must reduce, which corresponds to poor predictability. The stepwise selected yield model predicts the yield in 2019 to be 171.93. The prediction is close to 174.60 based on the actual precipitation data. Nevertheless, the reduced yield model predicts the yield in 2019 to be 183.76, which is further deviated from 174.60. The above results indicate that the simple linear model for yield based on monthly prediction is not the optimal method for the current data.
The precipitation has a significant predictor for season 3, indicating a strong seasonality. Season 3 represents July, August, and September. These months are the rainy months in North Carolina, As a significant positive coefficient means that Season 3 adds some values to the prediction, the model follows the precipitation pattern in reality. The yield model tends to have September as a significant predictor. September is the harvesting month of the Sweet Potato. An excess amount of rainfall can damage both the harvesting process and storage of the Sweet Potato. Farmers have no chance to grow the sweet potato again during the same year [9]. This explains the significance of September
Table 7: Coefficient and VIF table for stepwise selected and reduced yield model.
Johnston | Stepwise | Reduced | Stepwise VIF | Reduced VIF |
|
|
|
|
|
May | -23.562* | -6.891 | 8.092 | 1.790 |
(7.235) | (5.006) | |||
Jun | -12.667 | 3.716 | 5.667 | 2.628 |
(8.568) | (8.582) | |||
Jul | -17.825* | -5.155 | 8.787 | 2.279 |
(5.638) | (4.224) | |||
Aug | -23.759 | 0a | 12.287 | |
(9.099) | ||||
Sep | 9.086 | 3.234 | 3.072 | 1.785 |
(3.461) | (3.881) | |||
Yield Prediction | 171.93 | 183.76 | ||
No.Obs | 10 | 10 | ||
note: dependent variable: Yield, standard errors reported in parenthesis a: This explanatory variable is dropped to avoid multicollinearity | ||||
Significance Level: *** is significant at 0.001 significance level, ** is significant at 0.01 significance level, and * is significant at 0.05 significance level. | ||||
The method and model to set up threshold and premium is not covered in this paper, because it requires knowledge of agriculture and actuarial science [10]. Current studies have shown satellite data are more accurate and preferred for risk management, but the precipitation data in the United State climate data may not come from satellites [11, 12]. Other data such as the type of sweet potato grown by farmers can also be incorporated into the yield model, as the model would not depend only on precipitation [13]. The models cover in this study can be used to design different premium and index threshold.
4. Conclusion
The precipitation model reflects the trend and seasonality of the data. Season3, the rainy season in North Carolina, is significant. The yield model has Sep as the significant variable, which represents the harvest month of the sweet potato. Predicted precipitation is used to forecast the yield. Since the yield can reflect the financial loss of farmers, it can help insurance companies set based on coverage. The threshold can be adjusted based on precipitation and premium. As a result, a comprehensive index insurance plan for sweet potato farmers in North Carolina can be developed based on the precipitation and yield model. Nevertheless, this study only includes precipitation as the factor that influences sweet potato yield and depends on non-satellites precipitation data. Further studies can focus on analyzing other factors that influence sweet potato yield and choosing datasets from various sources.
References
[1]. North Carolina: Leading sweet potato production for 50 years, https://www.ncdemography.org/2021/11/17/north-carolina-leading-sweet-potato-production-for-50-years/#:~:text=North%20Carolina%20produced%201.7%20billion,of%20years%20(2%20billion), last accessed 2022/10/01.
[2]. Fate North Carolina Sweet Potato Crop after Hurricane Florence still uncertain, https://www.potatopro.com/news/2018/fate-north-carolina-sweet-potato-crop-after-hurricane-florence-still-uncertain, last accessed 2022/10/01.
[3]. Kath, J., Mushtaq, S., Henry, R., Adeyinka, A., Stone, R.: Index insurance benefits agricultural producers exposed to excessive rainfall risk. Weather and Climate Extremes 22, 1-9 (2018).
[4]. R. Mansfield, E., P. Helms, B.: Detecting Multicollinearity. The American Statistician, Journal 36, 158-160 (1982).
[5]. Alshqaq, S., Abuzaid, A.: On the robustness of Mallows’ Cp criterion. Communications in Statistics - Simulation and Computation, (2021).
[6]. Dennis, B., M. Ponciano, J., L. Taper, M., R. Lele, S.: Errors in Statistical Inference Under Model Misspecification: Evidence, Hypothesis Testing, and AIC, (2019).
[7]. Chicco, D., Warrens, M. J., Jurman, G.: The coefficient of determination R-squared is more informative than SMAPE, MAE, MAPE, MSE and RMSE in regression analysis evaluation. PeerJ Computer Science, (2021).
[8]. Marcoulides, K. M., Raykov, T.: Evaluation of Variance Inflation Factors in Regression Models Using Latent Variable Modeling Methods. Educational and Psychological Measurement, Journal 79, 874-882 (2019).
[9]. A. Eck, M., R. Murray, A., R. Ward, A., E. Konrad, C.: Influence of growing season temperature and precipitation anomalies on crop yield in the southeastern United States. Agricultural and Forest Meteorology, Journal 291, (2020).
[10]. A Jensen, N., Barrett C.: Agricultural Index Insurance for Development. Applied Economic Perspectives and Policy, Journal 39, 199–219 (2017).
[11]. AMA Innovation Lab Launches Project Using High-resolution Satellite Data to Improve Accuracy and Quality of an Innovative Risk Management Toolhttps://basis.ucdavis.edu/news/ama-innovation-lab-launches-project-using-high-resolution-satellite-improve-accuracy-and, last accessed 2022/10/01.
[12]. Stigler, M., Lobell, D.: On the benefits of index insurance in US agriculture: a large-scale analysis using satellite data, (2021).
[13]. Yu, J., Vandeveer, M., Volesky, J. D., Harmoney, K.: Estimating the Basis Risk of Rainfall Index Insurance for Pasture, Rangeland, and Forage. Journal of Agricultural and Resource Economics, Journal 1, 179-193 (2019).
Cite this article
Li,Z. (2023). Sweet Potato Yield Prediction for Index Insurance in North Carolina. Advances in Economics, Management and Political Sciences,15,13-22.
Data availability
The datasets used and/or analyzed during the current study will be available from the authors upon reasonable request.
Disclaimer/Publisher's Note
The statements, opinions and data contained in all publications are solely those of the individual author(s) and contributor(s) and not of EWA Publishing and/or the editor(s). EWA Publishing and/or the editor(s) disclaim responsibility for any injury to people or property resulting from any ideas, methods, instructions or products referred to in the content.
About volume
Volume title: Proceedings of the 2nd International Conference on Business and Policy Studies
© 2024 by the author(s). Licensee EWA Publishing, Oxford, UK. This article is an open access article distributed under the terms and
conditions of the Creative Commons Attribution (CC BY) license. Authors who
publish this series agree to the following terms:
1. Authors retain copyright and grant the series right of first publication with the work simultaneously licensed under a Creative Commons
Attribution License that allows others to share the work with an acknowledgment of the work's authorship and initial publication in this
series.
2. Authors are able to enter into separate, additional contractual arrangements for the non-exclusive distribution of the series's published
version of the work (e.g., post it to an institutional repository or publish it in a book), with an acknowledgment of its initial
publication in this series.
3. Authors are permitted and encouraged to post their work online (e.g., in institutional repositories or on their website) prior to and
during the submission process, as it can lead to productive exchanges, as well as earlier and greater citation of published work (See
Open access policy for details).
References
[1]. North Carolina: Leading sweet potato production for 50 years, https://www.ncdemography.org/2021/11/17/north-carolina-leading-sweet-potato-production-for-50-years/#:~:text=North%20Carolina%20produced%201.7%20billion,of%20years%20(2%20billion), last accessed 2022/10/01.
[2]. Fate North Carolina Sweet Potato Crop after Hurricane Florence still uncertain, https://www.potatopro.com/news/2018/fate-north-carolina-sweet-potato-crop-after-hurricane-florence-still-uncertain, last accessed 2022/10/01.
[3]. Kath, J., Mushtaq, S., Henry, R., Adeyinka, A., Stone, R.: Index insurance benefits agricultural producers exposed to excessive rainfall risk. Weather and Climate Extremes 22, 1-9 (2018).
[4]. R. Mansfield, E., P. Helms, B.: Detecting Multicollinearity. The American Statistician, Journal 36, 158-160 (1982).
[5]. Alshqaq, S., Abuzaid, A.: On the robustness of Mallows’ Cp criterion. Communications in Statistics - Simulation and Computation, (2021).
[6]. Dennis, B., M. Ponciano, J., L. Taper, M., R. Lele, S.: Errors in Statistical Inference Under Model Misspecification: Evidence, Hypothesis Testing, and AIC, (2019).
[7]. Chicco, D., Warrens, M. J., Jurman, G.: The coefficient of determination R-squared is more informative than SMAPE, MAE, MAPE, MSE and RMSE in regression analysis evaluation. PeerJ Computer Science, (2021).
[8]. Marcoulides, K. M., Raykov, T.: Evaluation of Variance Inflation Factors in Regression Models Using Latent Variable Modeling Methods. Educational and Psychological Measurement, Journal 79, 874-882 (2019).
[9]. A. Eck, M., R. Murray, A., R. Ward, A., E. Konrad, C.: Influence of growing season temperature and precipitation anomalies on crop yield in the southeastern United States. Agricultural and Forest Meteorology, Journal 291, (2020).
[10]. A Jensen, N., Barrett C.: Agricultural Index Insurance for Development. Applied Economic Perspectives and Policy, Journal 39, 199–219 (2017).
[11]. AMA Innovation Lab Launches Project Using High-resolution Satellite Data to Improve Accuracy and Quality of an Innovative Risk Management Toolhttps://basis.ucdavis.edu/news/ama-innovation-lab-launches-project-using-high-resolution-satellite-improve-accuracy-and, last accessed 2022/10/01.
[12]. Stigler, M., Lobell, D.: On the benefits of index insurance in US agriculture: a large-scale analysis using satellite data, (2021).
[13]. Yu, J., Vandeveer, M., Volesky, J. D., Harmoney, K.: Estimating the Basis Risk of Rainfall Index Insurance for Pasture, Rangeland, and Forage. Journal of Agricultural and Resource Economics, Journal 1, 179-193 (2019).