1. Introduction
The impact of the epidemic has had a huge impact on the global economy, making the fact that the world economy is interconnected and influenced by each other more and more obvious [1-3]. The stock market is a barometer of the economy and a response to people's confidence in the economy [4]. The strike of the epidemic on the stock market has begun to change the capital structure of the stock market, bringing those tough and high-quality companies to the surface [5]. Therefore, it is necessary for investors to identify companies that are worth investing at this time.
World stock markets are booming. Between 1982 and 1993, world stock market capitalization grew from $2 trillion to $10 trillion, which implies an average annual growth rate of 15% [6]. And stock market liberalizations lead private investment booms [7]. But in the face of a wide variety of stocks, many investors are at a loss. Investors have to take many factors into account when they discuss if one individual stock is going to make a profit and finally decide which one to purchase [8]. It is obvious that investors are usually willing to choose stocks with higher returns for investment. We should learn to see the trend of stocks correctly, and at the same time, we should know how to choose a stock with good potential and buy it at an appropriate time, so as to maximize profits. The stockholders did some analysis of the target company before buying its stock and also may run different types of algorithms on a computer to predict the future performance of a particular share [9]. For a high growth company, the growth of its main business income and net profit shows a trend of rapid expansion. In addition to giving more bonus shares and distributing less cash to ensure that there is sufficient capital to put into operation, the growth of the company’s performance will always keep pace with the speed of equity expansion. This kind of stock often distributes shares in a high proportion, but earnings per share are not diluted due to it, which is valuable. This study illustrates how to choose the best stock and identify potential stocks in the stock market by selecting and analyzing companies from three different industries.
Trend judgement and stock price estimating are playing an increasingly significant role in the stock market [10]. Money cannot generate an income by itself, so we need to establish a systematic approach to research and analyze which one is a perfect business or portfolio proposal to invest money in. In this regards fundamental and technical analysis plays a prominent role [11]. First, we select three companies, Qualcomm (QCOM), in the field of chip development, Pioneer natural resources co (PXD), in the field of resource development and Ubiquiti (UI), in the field of wireless communication product manufacturing. Besides, we analyze these three companies through some fundamental indicators and list the analysis results and reasons. Second, we move on to consider company’s growth from 2016-2020. The empirical results show that UI grows steadily, comparatively more resilient than other stocks. And QCOM and PXD both suffered negative growth in 2018 or 2019 while UI performed growth above 10% in every year. Third, we take into consideration of their sharp ratio, gross profit to asset ratio, net income to sales ratio and EBITDA/sales ratio. The results show that UI has the outstanding results in all ratios. Finally. we come to a conclusion based on these companies’ various indicators and these operations.
The research goal of this paper is to interpret and analyze the basic indicators and data of each stock in order to narrow down to one stock as the best choice, which is relatively low in price, exhibits considerable expectation of growth, has high operating efficiency and profitability and pays dividend. This will help investors find a company to invest in efficiently. The remainder of this paper is constructed as follows. Part 1 presents the data of the three companies. Part 2 presents the method applied in the analysis. Part 3 reports the empirical results. In the final part, we conclude the paper.
2. Data
In this paper, all the data we collected are open market data from all the companies listed in the SEC system from 2015 to 2021. We had analyzed all the companies in the U. S. stock market over the past five years, which has about 5,100 companies’ data, including PE, EPS, GP / A, EBITDA, Sharp Ratio, and other information related to business indicators. Our team targeted the energy and emerging high technology industries from the very beginning, because traditional consumer industries, such as manufacturing, food and services, are declining in the face of the global pandemic, and the signs of a turnaround are not clear in the short term. After extensive screening, the three companies that we targeted were QCOM, PXD, and UI. UI is a multinational network communication technology company founded in 2003, located in Silicon Valley, California, USA, mainly for inadequate wireless broadband access services and emerging markets manufacturing and selling wireless products. Its full function unlimited ultra-broadband products can be on the market, with its rigorous design technology, stable and reliable quality, super performance and relative low price, it will quickly form a sensational effect in the world. QCOM is an American company, whose main business is QCT and QTL. QCOM lies in a similar high technology industry compared with that of UI. PXD has a big difference from the previous two companies. Petroleum is its main product. Due to the particularity of petroleum like natural resource products, it will be affected by the constraints of statutory and international political influence. For example, the daily production decline in the Middle East and the political and military instability of some world's main energy sources area will cause unpredictable price fluctuations to such products, increasing systemic risk.
We used the basic quantitative method to measure the profitability, payout ratio and valuation of these enterprises mentioned above, and finally chose the UI standing in the high-tech information and communication field.
3. Method
The targeted three companies are QCOM, PXD, UI. These three companies come from different fields. QCOM is an American corporation selling semiconductor products, headquartered in San Diego, California. PXD is a large independent oil and gas exploration and production company. UI is a computer networking company founded in San Jose, California.
We use P/E ratio, sharp ratio, gross profit to asset ratio, net income to sales ratio, EBITDA margin and so on to compare these three companies.
(1) The P/E ratio is a commonly used indicators of the connection between a firm’s financial performance and profits. The P/E ratio shows how often a company's stock trades in relation to its earnings. It is calculated by dividing the market value per share by earnings per share. Traditionally, the P/E ratio has been assumed to be an indicator of the quality of an investment, a relatively low P/E ratio implies a good investment, whereas a relatively high P/E ratio indicates a poor investment prospect.[7]
(2) Sharp ratio is a classical indicator that can synthetically consider both income and risk. A large sharp ratio represents a good portfolio.
SharpeRatio=\frac{E({R_{P}})-{R_{f}}}{{σ_{P}}} (1)
E({R_{P}} ): expected annualized return of investment portfolio
{R_{f}} : annualized risk-free interest rate
{σ_{P}} : standard deviation of annualized return of investment portfolio
The fund's average net worth growth rate has outpaced the rate of risk-free interest over the measurement period, according to the positive sharp ratio. If the interest rate on a bank deposit for the same time period is used as the risk-free interest rate, then an investment fund is preferable to a bank deposit. A high sharp ratio means the risk return per unit risk of the fund is high. If the sharp ratio is less than zero, there is no point in comparing size.
(3) Net income to sales ratio (net income ratio) refers to a financial ratio that reflects the income level of an enterprise and it is a major financial ratio to measure an enterprise’s operating results. It is calculated by dividing net income by sales revenue.
(4) The EBITDA margin. It is a financial index used to calculate the company’s operating performance.
EBITDA margin =\frac{EBITDA}{Net sales} (2)
Since EBITDA is partly created from revenue, this indicator shows what proportion of a company's earnings are left over after operating costs. A higher value means the business can generate profits more effectively by keeping costs down. Our analysis method is simply based on the indicators mentioned above, and then intuitively compare the data from different views.
4. Results
This section of analysis supports why Ubiquiti is a better company than Qualcomm and Pioneer Natural Resources. To generate the result, comparison is made both between company from different industries and inside the specific industry of wireless broadband products. Ubiquiti networks, Inc. (UI) is a more promising company because of the following analysis.
4.1. Payout
Since Ubiquiti had an impressive growth rate in the industry, it is not acceptable to compare the dividend yield of the company with others. The dividend yield is the cash dividend per share divided by the price per share. The table below shows that Ubiquiti began to earn real cash profits rather than just accounting profits. Statistics reveal that it starts to pay its investors dividend in 2019. This phenomenon indicates that the business cycle is turning healthier and supports continuous growth in the following years. Although QCOM and PXD are also paying dividends, they are actually stable companies rather than UI which is still expanding its current size.
Table 1: Dividend yield of Ubiquiti, Qualcomm and Pioneer Natural Resources.
2017 | 2018 | 2019 | 2020 | 2021 | |
UI | 0.00% | 0.00% | 0.78% | 0.71% | 0.52% |
QCOM | 4.34% | 4.01% | 3.47% | 2.23% | 2.13% |
PXD | 0.05% | 0.25% | 0.80% | 1.94% | 3.75% |
4.2. Profitability
The focus of value investment is to measure whether the company currently has a sustainable competitive advantage in the market, and whether it has a high return on capital and intriguing profit. EBITDA to sales ratio measures the operating income of the company. From the information given in figure 1, Ubiquiti outperforms every comparative firm in the past five years. Market giants in the industry of chip designing like Qualcomm only had an average EBITDA margin below 30%, so Ubiquiti must have higher efficiency while running the business. Bar charts in figure 2 manifest that Ubiquiti’s gross profit to asset ratio is at 103%, but Pioneer Natural Resources and Qualcomm only have 50% and 25% gross profit to asset ratio respectively. So, the company's business model is also extremely streamlined and efficient. As is presented in table 2, Ubiquiti has outstanding gross profit to asset ratio, net income to sales ratio and preferable EBITDA/Sales ratio comparing to firms from other industries.
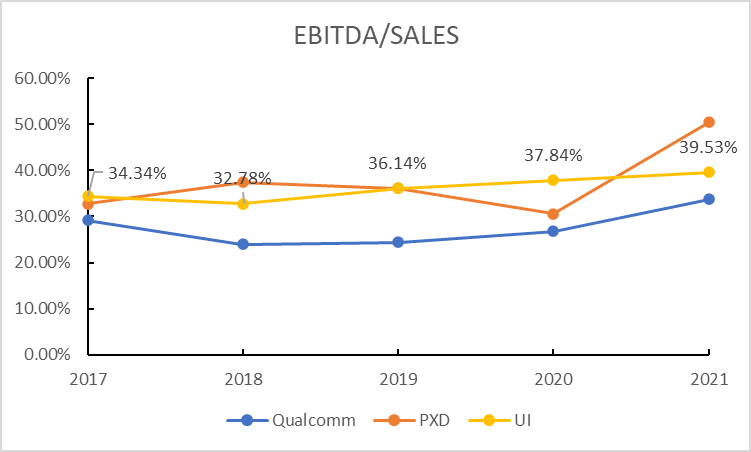
Figure 1: EBITDA to sales ratio of comparative firms.
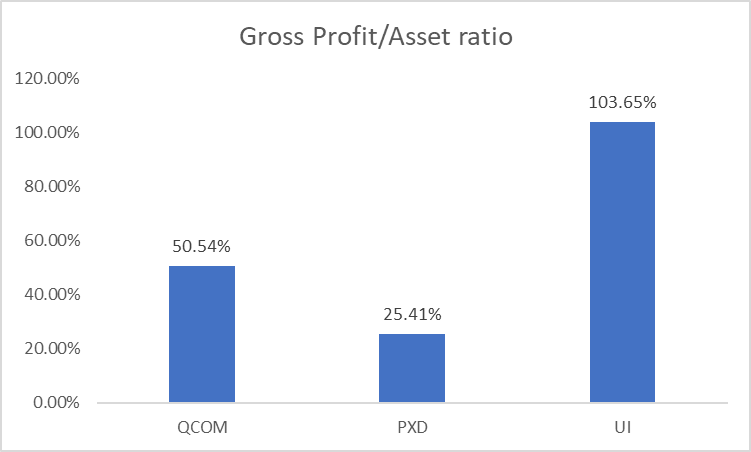
Figure 2: Gross profit to asset ratio of comparative firms.
Table 2: Profitability indicators and sharp ratio of comparative firms.
Qualcomm | PXD | UI | |
sharp ratio | 0.97 | -0.04 | 2.79 |
ebitda/sales | 27.60% | 37.44% | 36.12% |
gross profit/asset | 50.54% | 25.41% | 103.65% |
ni/sales | 26.94% | 11.85% | 32.48% |
4.3. Growth
At present, the company's core products have few competitors in the market, providing wireless broadband solutions for enterprise customers. Their products include webcam monitors, enterprise Wi-Fi, PoE switches, with certain amount of technological barriers. In figure 3, Ubiquiti has steady sales growth rate between 2016 and 2020, comparatively more resilient than other stocks. Qualcomm and Pioneer Natural Resources both suffered negative growth in 2018 or 2019, while Ubiquiti performed growth above 10% in every year. The orange and blue line in figure 4 below indicate that the EPS of UI is above Qualcomm in every year, and after year 2019 the EPS of PXD fell under the EPS of UI. Also, Ubiquiti made higher and increasing profit every year from the perspective of EPS. In this product line, therefore, the industry entry barrier still remains, the operating efficiency has been proven, and the growth of core products can still be expected.
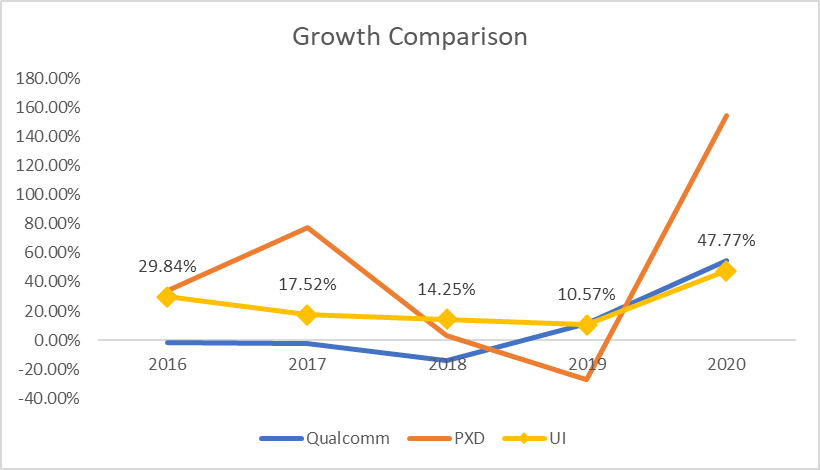
Figure 3: Sales growth per year of comparative firms.
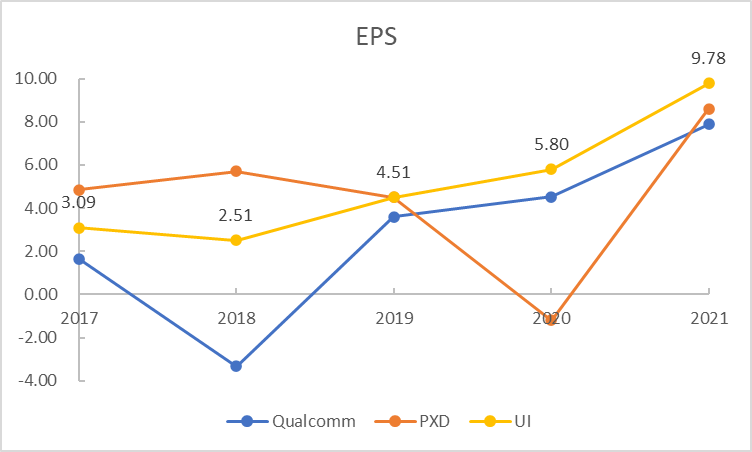
Figure 4: Earnings per share of comparative firms.
4.4. Valuation
Figure 5 is drawing the P/E ratio of Ubiquiti in 2021, which is around 31.92, and it is higher than Qualcomm and PXD. But the sales growth rate and the profitability make it a desirable choice because Ubiquiti is the only company which shows a promising future and potential to grow into a larger scale company. From table 2, Ubiquiti has a sharp ratio of 2.79 by computing the data of standard deviation and historical return, which means for every unit of risk it takes, Ubiquiti will earn 2.79 times of return of the market.
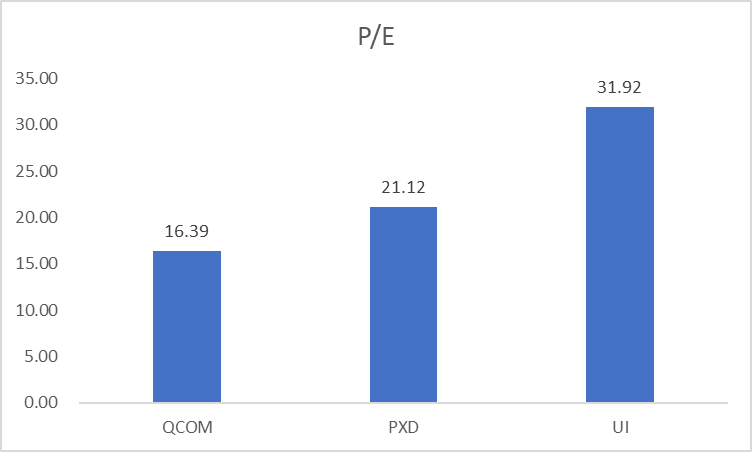
Figure 5: P/E ratio of comparative firms.
5. Conclusion
We look into the data derived from the available data in U.S. stock market from 2016 to 2021 and make comparison between different companies through quantitative indicators. We use sharp ratio, GP/A, EBITDA ratio to measure the three selected companies, UI, PXD and Qualcomm through simple calculations of the data that we got. By interpreting the underlying information implied in the figures, we analyze the best target for value investing to help with the decision-making process of investors. Gross profit/asset ratio of the three companies reflects that UI has the highest profitability. The EBITDA/sales ratio is compared between companies operating in the same sector of UI, which was 36.12%, higher than every comparative firms in the industry in the past five years. Taking the one-year return of UI subtracted by the one-year risk free return divided by standard deviation of UI, we compute the sharp ratio of UI and it is around 2.79. This result means that UI has higher return than the U.S stock market when undertaking same risk. The analyzing process and methods can corroborate that UI is a better asset for investors to purchase and deserves more attention from investors.
The article uses quantitative methods to pick out the best firm from three competitive firms all with desirable performances. The methodology we have developed can be widely applied to investment decision processes. However, there also exists some limitation in our data and methods. The data used in the study are historical data of the US stock market, which may influence the final result and decision of investors. Although it indicates that the company, to some extent, has operated well in the past, it is impossible to fully predict the real situation of the company in the future. Also, when comparing the growth of companies, the essay does not consider the size and stage of development of the enterprise.
References
[1]. International Monetary Fund, https://www.imf.org/en/Home, last accessed 2022/10/1.
[2]. Youssef, M., Mokni, K., Ajmi, AN.: Dynamic connectedness between stock markets in the presence of the COVID-19 pandemic: does economic policy uncertainty matter?. Financial Innovation 7(1), 1-27 (2021).
[3]. Fulin, C.: Globalization at A Crossroad. Beijing Review 14 (2020).
[4]. Sahin, S.: Consumer confidence, consumption, and macroeconomic fluctuations: A systemic stock‐flow consistent model. Metroeconomica 72(4), 868-904 (2021).
[5]. Chu, T. H., Stocker, M. L., Tan, B. J.: Economic fitness: how equity market returns reflect the realization of economic growth potential. International Journal of Finance & Economics 26(1), 1550-1562 (2021).
[6]. Demirgüç-Kunt, A., Levine, R.: Stock market development and financial intermediaries: stylized facts. The World Bank Economic Review 10(2), 291-321 (1996).
[7]. Henry, P. B.: Do stock market liberalizations cause investment booms?. Journal of Financial economics 58(1-2), 301-334 (2000).
[8]. Wong, MC., Cheung YL.: The practice of investment management in Hong Kong: market forecasting and stock selection. Omega 27(4), 451-465 (1999).
[9]. Hossain, M. S., Hamid, M. A., Saif, A. S.: An Algorithm to Find out Risk Free Share to Invest in Stock Market. This paper can be achieved at: https://www.researchgate.net/profile/Md-Abdul-Hamid/publication/321155246_An_Algorithm_to_Find_Out_Risk_Free_Share_to_Invest_in_Stock_Market/links/5a114e97458515cc5aa8138d/An-Algorithm-to-Find-Out-Risk-Free-Share-to-Invest-in-Stock-Market.pdf.
[10]. Lee, C. Y., Gunawan, D.: Stock investment decision making based on quantitative association rules. ICIC express letters. Part B, Applications: an international journal of research and surveys (2015).
[11]. Levi, S., Prathima, P., Merlyn, S.: FUNDAMENTAL AND TECHNICAL ANALYSIS LEADS TO A SYSTEMATIC INVESTMENT DECISION IN STOCK MARKET EQUITIES. This paper can be achieved at: https://www.researchgate.net/publication/357446645_FUNDAMENTAL_AND_TECHNICAL_ANALYSIS_LEADS_TO_A_SYSTEMATIC_INVESTMENT_DECISION_IN_STOCK_MARKET_EQUITIES.
Cite this article
Du,Y.;Hu,D.;Tao,S. (2023). The Application of Value Investing in UI, PXD and Qualcomm. Advances in Economics, Management and Political Sciences,15,296-302.
Data availability
The datasets used and/or analyzed during the current study will be available from the authors upon reasonable request.
Disclaimer/Publisher's Note
The statements, opinions and data contained in all publications are solely those of the individual author(s) and contributor(s) and not of EWA Publishing and/or the editor(s). EWA Publishing and/or the editor(s) disclaim responsibility for any injury to people or property resulting from any ideas, methods, instructions or products referred to in the content.
About volume
Volume title: Proceedings of the 2nd International Conference on Business and Policy Studies
© 2024 by the author(s). Licensee EWA Publishing, Oxford, UK. This article is an open access article distributed under the terms and
conditions of the Creative Commons Attribution (CC BY) license. Authors who
publish this series agree to the following terms:
1. Authors retain copyright and grant the series right of first publication with the work simultaneously licensed under a Creative Commons
Attribution License that allows others to share the work with an acknowledgment of the work's authorship and initial publication in this
series.
2. Authors are able to enter into separate, additional contractual arrangements for the non-exclusive distribution of the series's published
version of the work (e.g., post it to an institutional repository or publish it in a book), with an acknowledgment of its initial
publication in this series.
3. Authors are permitted and encouraged to post their work online (e.g., in institutional repositories or on their website) prior to and
during the submission process, as it can lead to productive exchanges, as well as earlier and greater citation of published work (See
Open access policy for details).
References
[1]. International Monetary Fund, https://www.imf.org/en/Home, last accessed 2022/10/1.
[2]. Youssef, M., Mokni, K., Ajmi, AN.: Dynamic connectedness between stock markets in the presence of the COVID-19 pandemic: does economic policy uncertainty matter?. Financial Innovation 7(1), 1-27 (2021).
[3]. Fulin, C.: Globalization at A Crossroad. Beijing Review 14 (2020).
[4]. Sahin, S.: Consumer confidence, consumption, and macroeconomic fluctuations: A systemic stock‐flow consistent model. Metroeconomica 72(4), 868-904 (2021).
[5]. Chu, T. H., Stocker, M. L., Tan, B. J.: Economic fitness: how equity market returns reflect the realization of economic growth potential. International Journal of Finance & Economics 26(1), 1550-1562 (2021).
[6]. Demirgüç-Kunt, A., Levine, R.: Stock market development and financial intermediaries: stylized facts. The World Bank Economic Review 10(2), 291-321 (1996).
[7]. Henry, P. B.: Do stock market liberalizations cause investment booms?. Journal of Financial economics 58(1-2), 301-334 (2000).
[8]. Wong, MC., Cheung YL.: The practice of investment management in Hong Kong: market forecasting and stock selection. Omega 27(4), 451-465 (1999).
[9]. Hossain, M. S., Hamid, M. A., Saif, A. S.: An Algorithm to Find out Risk Free Share to Invest in Stock Market. This paper can be achieved at: https://www.researchgate.net/profile/Md-Abdul-Hamid/publication/321155246_An_Algorithm_to_Find_Out_Risk_Free_Share_to_Invest_in_Stock_Market/links/5a114e97458515cc5aa8138d/An-Algorithm-to-Find-Out-Risk-Free-Share-to-Invest-in-Stock-Market.pdf.
[10]. Lee, C. Y., Gunawan, D.: Stock investment decision making based on quantitative association rules. ICIC express letters. Part B, Applications: an international journal of research and surveys (2015).
[11]. Levi, S., Prathima, P., Merlyn, S.: FUNDAMENTAL AND TECHNICAL ANALYSIS LEADS TO A SYSTEMATIC INVESTMENT DECISION IN STOCK MARKET EQUITIES. This paper can be achieved at: https://www.researchgate.net/publication/357446645_FUNDAMENTAL_AND_TECHNICAL_ANALYSIS_LEADS_TO_A_SYSTEMATIC_INVESTMENT_DECISION_IN_STOCK_MARKET_EQUITIES.


