


1. Introduction
The capital structure of an enterprise refers to the composition and proportion of various funds raised by an enterprise. When an enterprise is provided with an investment opportunity, appropriate capital infrastructure can optimize the market share and company value under the restriction of income cost constraints. The capital framework mainly includes equity financing and debt financing. Enterprise value means the market value of the whole assets of the company in financial management. The enterprise value is expressed as the value of current time figured out by the discount rate of the enterprise's reward according to the risk-reward corresponding to the reward obtained for a certain period. Therefore, it distinguishes from the concept of profit which is only a proportion of the value generated by the company, and the enterprise value contains not only the newly created value, but also the potential or expected profitability. Enterprise value has overall characteristics. The optimization of capital framework should balance the maximum of company’s debt and the economic crunch caused by the rising debt, which is called the balance theory. The increasing debt rate of the corporation means the possibility that a company collapses into economic difficulty also increases. The economic crisis would shrink the market share and corporation’ value. What is worse, it would decrease the expectation from corporate bond buyers, with higher issuance costs and more challenging tasks of issuing bonds. Such elements would confine the tax exemption, and promote them to design the appropriate capital fundamental facility, which would lead to the company's capital structure presenting some stable and regular distribution. The optimal capital structure is the result of the balance of the income and the cost of the debt derived from the agency cost [1].
Comprehensively considering the capital market defects caused by the fragility and vulnerability of the capital market, information imbalance, transaction costs, etc., a new point of view has emerged, that is, the choice of capital structure is a dynamic process, which leads to various financing methods for enterprises. At the same time, M&M Theoretical capital structure theory has certain assumptions that lead the public to understand the dynamic correlation between financial structure, cost of capital, and firm value. The capital structure of the enterprise has a significant relationship with the enterprise value, and the enterprise should take the maximization of the enterprise value as the financial management goal. Optimum capital structure is a necessary condition for enterprise value maximization.
The subject of this paper is the relationship between firm capital structure and firm value. The specific issue explored is the analysis and synthesis of the relationship between a firm's capital framework and firm value using the CAPM and APT models and the WACC. This paper will predict the dynamic correlation between the company's capital structure and company value, and put forward theoretical suggestions for the company to adjust the capital structure to maximize the company's value [2].
2. Optimal Capital Structure of the Company
A company under continuous operation should discount the cash flow from its future business at an appropriate percentage of the capital. Therefore, estimating an acceptable capital cost is a critically fundamental move in the procedure of company's daily operation. In the future, if the enterprise cash flow keeps unchanged, there will be such a phenomenon that capital cost is in inverse proportion to company value. For instance, when the capital cost is low, the company value is high. However, the capital cost is high while the other factor is low. Generally, a company uses the weighted average capital cost for calculating its capital cost (WACC) [3].
\( WACC=Ke*E/(E+D)+Kd*D/(E+D) \)
D is debt, E is equity, Ke is equity cost, and Kd is debt cost.
According to the formula above, the capacity of the WACC is influenced by Kd and Ke, as well as the company's capital structure. Consequently, the optimization of the proportion between debt and equity should be put on the top agenda when assessing a corporation's market value in the future.
3. Disadvantages of CAPM
The Capital Asset Pricing Model intends to illustrate the interaction between the expected financial assets and crises which are categorized as non-systemic and systemic one. Non-systematical crisis, unique risk, is the original risk owned by a stock or a portfolio, which can be minimized by diversification based on the modern portfolio theory introduced by Markowitz. In terms of systemic risk, even if investors hold increasingly larger portfolios, diversification cannot eliminate market risk.
The CAPM model is set, and the formula to calculate the expected return of a specific capital asset is as follows [4]:
\( E(r)i-rf=β(iE(rm)-r)f \)
among,
\( βi=Cov(ri,rm)/Var(rm)=σim/σm2 \)
\( E(r)i \) is the expected return on capital assets, \( rf \) is the risk-free interest rate, a portfolio of investments measuring systemic risk, and \( E(rm) \) is the expected return on the market.
From the calculation above, it can be seen that three factors, including risk-free interest rates, the expected return from the market, and the coefficient, can impact the anticipation of return from an asset. Under CAPM, the anticipation of a return on all kinds of assets is equivalent to the risk-free return and adjusted systematical crisis. The expected return is considered as compensation of the market for investors instead of a non-systemic crisis. Furthermore, The Capital Asset Pricing Model can display the interaction between risk premium E (R) i-Rf and market premium E (Rm) -Rf.
To conclude, The Capital Asset Pricing Model shows a clearly obvious finding that it is advisable for investors to build up a higher level to tolerate the unstable market and economic risks because it is the only path to achieve more handsome rewards. If the market portfolio owns more uncertainty and crisis, the investors would enjoy more opportunities for increasing compensation [5].
3.1. Not Reality-based Models
3.1.1. Inaccurate Figures
Due to unavailable statistics for the whole market including every segmentation, it is impossible to estimate the average financial reward, which leads to the phenomenon that investors habitually use an average market reward for a long period as the baseline. Unfortunately, such an issue would trigger a bad situation if a person would misuse historical data from experience which is the timeout for the current market, which results in the incorrect calculation when using CAPM [6].
3.1.2. The Derivation Process Is Not Strict
According to the proof procedure of Sharpe, the final equation, ri=rf + (i rm-r) f, i= σimσm2, is obtained. When individuals reason through the equation (ri-rm) m im-m2=rm-rf m, they will find that the square is missed, because the square is considered much less than, so it is ignored in operational reasoning. Mathematically speaking, such a derivation procedure is inaccurate so the CAPM is unlikely to produce precise pricing [7].
The CAPM depends on only one single element: coefficient, meaning "a measure of the sensitivity of securities to changes in the overall market returns". However, in reality, other systematical crises, including inflation and GNP differences, would need to be considered, so the CAPM model is incomplete.
3.2. Invalid Hypothesis
The capital asset pricing model is based on a series of assumptions, some of which are invalid assumptions. In 2010, Bodie and Merton have conducted research showing that people shared similar predictions for expected yields, standard deviation, and securitization of risk. Consequently, investors would have similar arrangements for financial investment of assets with crisis, which impacts counterproductive influence on obtaining optimization of a financial portfolio. In balanced and healthy markets, CAPM advises people to keep the most appropriate investment portfolio, which demands purchasing good capital assets with selling poor ones. In the course of time, all the individuals would own similar financial structures driven by the same target. As purchasers and sellers in the financial market, they would simultaneously conduct selling poor assets and purchase good ones, which would generate the symptom that no deals in the market. Finally, all these would produce a situation that no one can get the best financial portfolio [8].
3.3. Difficult to Test
Market portfolios are incomplete and can not cover all the aspects of a real one [8]. Statistics are collected by French and Fama from 1962 to 1989, displaying that the theory of CAPM did not exist, which means that the statistics used by CAPM in the actual market were not efficient, and the fitting effect of CAPM could not get the real best combination [9].
3.4. New Model
As discussed above, CAPM has three main drawbacks: inaccurate, unrealistic assumptions, and difficulty to test. Therefore, this paper would show a different model of Arbitrage Pricing Theory (APT) to study interaction with the Capital Asset Pricing Model.
The original formula is:
\( wacc=ke×\frac{E}{E+D}+kd×\frac{D}{E+D} \)
About d guide in WACC:
\( \frac{dwacc}{dD}=(ke×\frac{E}{E+D})+(kd×\frac{D}{E+D}) \)
\( =(\acute{ke})×\frac{E}{E+D}+(\frac{\acute{E}}{E+D})×ke+(\acute{kd})×\frac{D}{E+D}+(\frac{\acute{D}}{E+D})×kd \)
\( =0+[E×{(\acute{E}+D)^{-1}}]×ke+0+\frac{\acute{D}×(E+D)-(E+D)×D}{{(E+D)^{2}}}×kd \)
\( =\lbrace \acute{E}×{(E+D)^{-1}}+[{(E+\acute{D})^{-1}}]×E\rbrace ×ke+\frac{(E+D)-D}{{(E+D)^{2}}}×kd \)
\( =[0+(-1)×{(E+D)^{-2}}×(\acute{E}+\acute{D})×E]×ke+\frac{Ekd}{{(E+D)^{2}}} \)
\( =-\frac{1}{{(E+D)^{2}}}×Eke+\frac{Ekd}{{(E+D)^{2}}} \)
\( =\frac{-Eke}{{(E+D)^{2}}}+\frac{Ekd}{{(E+D)^{2}}} \)
\( \frac{dwacc}{dD}=\frac{E(kd-ke)}{{(E+D)^{2}}} \)
\( \frac{dwacc}{dD}=0 \)
At that time, the wacc achieved a minimum value. E=0, and hence wacc take min. \( \frac{dwacc}{dD}=0 \) .
It is concluded that when the equity is 0, the debt is 100%.
4. The APT Model
4.1. Arbitrage Pricing Theory
The definition of arbitrage behavior is that investors intend to take advantage of the price discrepancy of a financial product to earn a profit, being free of any risk. The principle of price demands under the same level of risk, two financial products have to share the same sale price. If the price of one financial product from a different market and in the same market are not the same, the capital market would be unbalanced, which would produce more room for arbitrage behaviors [10].
With a chance for arbitrage existing in the market, investors would buy financial products with expected high rewarding profits at low prices, selling them expecting low future profits at high prices. Consequently, the financial products owning price of high expected profits would boost, which would trigger more demand in the market. Unfortunately, with ascending demand, the returning profits would descend dramatically. Conversely, the products which own low expected returns would decrease, generating rising rewards. Such a procedure would not stop until the price in market return is balanced [11].
The APT model functions are as follows:
\( rj=aj+bj1F1+bj2F2+…+bjnFn+εj \)
Based on suBased on such a model, it can be concluded that a linear relation between the expected rewarding rate and other financial elements. The whole value of an asset can be calculated by multiplying every individual variable—namely the sensitivity coefficient of every variable plus the rewarding rate for risk-free. However, these factors are unstable so investors need to choose by themselves.
4.2. The Relation Between CAPM and APT
4.2.1. Similarities
First, the principles of CAPM and APT share similar methods. CAPM is introduced to estimate Capital Asset Pricing while APT is a model to replace CAPM. Both theories believe that if investors want to gain compensation rewarding, they have to tolerant risks, more risk, more profits.
Besides, CAPM could be seen as a conditional case of APT that also could be referred to as an extended model of CAPM. With a single variable of APT, the portfolio is influenced only by individual elements. Danthine and Donaldson stated that the single-factor fitness modulus function as Rj=Rf + b (j Rj-R) f. Functionally, it happens to become a similar portfolio as SML expected. Once“ j ”is estimated to have a similar yield and variance as the market portfolio, then j can be regarded as a market portfolio. Considering the conditions, the univariate APT is similar to CAPM.
Finally, both models are built on some assumptions, three of which are the same. Firstly, all investors share similar expectations. Secondly, they are intolerant of bearing risks. And thirdly, they seek the maximum profits [12].
4.2.2. Differences
First, the hypothesis of CAPM shows the hypothesis of APT is less restrictive. Some assumptions mentioned above do not contain some factors. Therefore, the advantage of using APT is that it can eliminate some unpractical hypotheses, making the estimate of financial rewarding is close to the real situation [13].
Furthermore, the number of variables influencing the expected profit is different. CAPM is a single-factorial model, while APT is a multifactorial style. CAPM argues that only one market portfolio can influence returning profits while APT connects it to various elements, such as GNP, inflation, the confidence of investors, and alternation in the earnings curve. In fact, the single-factorial model is easier to operate. For example, CAPM believes that the risk-free interest rate is equal to short-term government bonds, so in its model, it is only needed to figure out the coefficients and market expected rate of return based on empirical or historical statistics. However, if using APT, investors have to locate all the elements influencing the financial return, which is challenging when people put it into practice because the sensitivity coefficient would vary, demanding complicated calculations [14].
Finally, the theoretical basis for the development of CAPM and APT differ. The CAPM is a mean-variance model based on Harry Markowitz, developed based on the multifactor model, and does not require arbitrage in the balanced market. The concept brought by Markowitz's advises investors to understand "average variable efficiency" portfolios to diversify non-systemic risk, by which the financial rewarding can be regarded as compensation for system risk that would not be removed in this way. Bodie and Morten claim that CAPM is that in balance, which means the market rewards those who take risks [15].
Moreover, CAPM and APT share similarities in some theories and hypotheses but distinguish them in influential factors. Thus, CAPM and APT complement each other.
5. WACC and Capital Structure Theory
5.1. M&M
5.1.1. Modigliani Miller Theorem First Theory
The M & M capital structure theory is based on the perfect capital market. A perfect capital market needs to meet the following conditions, the company operates in a non-tax environment, investors 'information symmetry in market investment, investors are rational investors, investors have no transaction costs with the company market, ignore the bankruptcy risk of the company and assuming continuous operation, individuals and companies can issue risk-free bonds, no risk rates, and investors expect the company's future profits and risks. Under the premise, M & M first theory proposes that the corporation value has remote relationship with its capital structure. No matter how the financing method changes, WACC has been maintained at a stable size, and the value of the company will not change [16].
IIn Figure 1, according to the theory, the company will continue to operate forever, without the risk interest rate, and the cost of debt financing remains unchanged. When the company keeps increasing leverage or increasing debt financing, the creditor demands that the return to Kd remains unchanged. However, due to increased leverage and increased financial risk, equity costs will also increase linearly (linear). Based on the formula WACC=Ke * E / (E + D) + Kd * D / (E + D), the rise of Ke will improve WACC, and the rise of D will reduce the size of WACC. Based on the calculation by Modigliani and Miller (time of publication), the increased equity cost equals the effect of increased debt financing. So this would result in the WACC values being maintained at a fixed level. The company's WACC remains unchanged, and the company's value will remain unchanged (Figure 2).
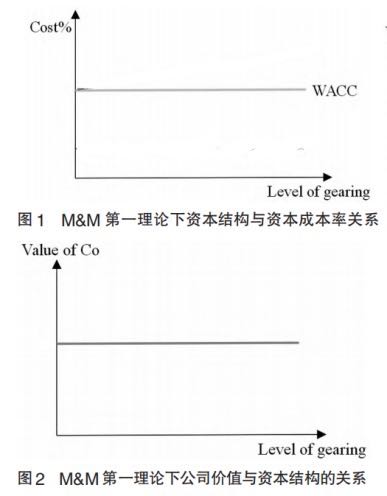
Figure 1: The relationship between capital structure and capital cost rate under the first theory of M&M.

Figure 2: The relationship between firm value and capital structure under the first theory of M&M.
5.1.2. M & M the Second Theory
M & M second theory modified the condition of no tax in the first theory, eliminating the assumption that the company has no income tax. Integrate tax into the model, and the model is modified to get a more realistic relationship between capital structure and company value [17].
After taking tax considerations into the WACC calculation model, the calculation formula changes as follows:
\( WACC=Ke*E/(E+D)+Kdat*D/(E+D) \)
Kdat says the cost of debt after tax.
Under the first theory, the effect of Ke is the same as the effect of debt used to reduce WACC. Under the second theory, because Kdat=Kd * (1-income tax rate%), Kdat <Kd, which ascends the debt ratio. The influence of WACC will be relatively greater than the effect of Ke increase. As Figure 3 shows, when the debt is increasing, rational investors demand a linear rising cost of interest. Although Kdat is unchanged, Kd a t <Kd is compared to K d in the first theory, so the WACC continuously decreases as the debt increases. As can be seen from Figure 4, because of the continuous decrease of WACC, the future corporation value would keep rising. If the company's debt ratio achieves near 99.99%, WACC=Kdat, the corporation value would achieve the maximum [18].

Figure 3: The relationship between capital structure and capital cost rate under the second theory of M&M.
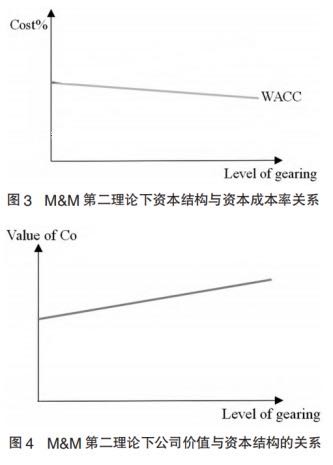
Figure 4: The relationship between firm value and capital structure under the second theory of M&M.
5.1.3. Reality Constraints of M & M
5.1.3.1. The Company Has a Risk of Bankruptcy
Because of the increasing financial leverage, the company faces increased financial risks, and the company will face bankruptcy when it fails to repay its debts. At the same time, as the rising shareholder risk will affect the change in the stock price, the stock price may fall, and the WACC may increase [19].
5.1.3.2. Debt Restrictions
In order to protect the interests of creditors, creditors often add many restrictions to the loan contracts to restrict management behavior, such as restricting further borrowing, and required disclosure of more financial information.
After the leverage rises to a certain extent, the company will face huge interest payments. Total profit is the amount after deducting financial expenses, which is pre-tax profit. Profit before tax minus income tax is net profit. Interest offset tax basically is to say that the interest that the enterprise issues bond to raise funds, when need to pay, this part of the interest is included in financial expenses, and can be deducted in full when calculating the total profit. If funds are raised to issue stocks, and the dividends are paid on the net profits of the enterprise, the purpose of reducing the total profits cannot be achieved, and the income tax payable can not be reduced. So when profit is less than interest, the effect of interest tax offset will be lost and the tax shield will be exhausted [20].
5.2. Traditional Theory
The traditional theory is actually the public cognition in society, without practical theoretical support. But it is indeed widely accepted. Because the premise of M & M theory is basically difficult to realize, and there are also many constraints. In reality, the perfect basic market is only an ideal state, and there is no one capital market that can be called a perfect capital market temporarily.
Under the traditional theory, Kd in the early stage, the company is sufficient, and the risk of finding creditors is consistent. Kd can be used to reduce WACC. Later, when the leverage gradually increased, Kd rose because creditors worried that the company could not pay the interest and principal. The risks increase, and so do the returns demanded by the creditors.
Shareholders believe that once the company increases its debt ratio, it will raise shareholder risk, so the return will gradually increase. In reality, capital market investors are not necessarily rational investors, and the increase of Ke is not a linear increase. Combined, the above two points can be seen in Figure 5 that WACC first decreases and then increases. There is the optimal capital structure, the capital structure when WACC is the lowest. In Figure 6, when WACC drops to a minimum, that is when the company can maximize its value [21].
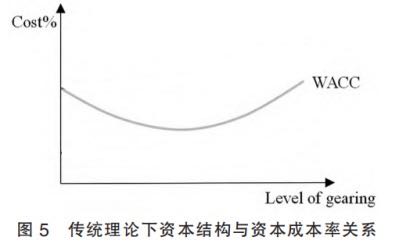
Figure 5: The relationship between capital structure and capital cost under traditional theory.
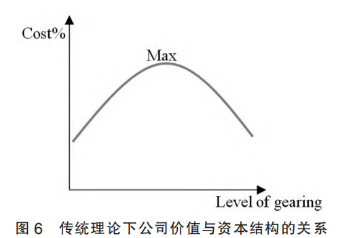
Figure 6. The relationship between company value and capital structure under traditional theory.
6. Conclusion
In order to maximize the value, the company must find the most suitable capital structure for the company itself, which requires the management of the company to constantly try to reduce the capital cost in the daily operational activities to achieve the optimal capital structure of the company [22].
Although the capital asset pricing model has many advantages in investment practice, its defects are also easy to appear, including the assumptions when the model is established. In addition, due to the limitations of China's capital market, the practicality of the capital asset pricing model is reduced. This article uses the APT model to replace the CAPM model to solve the gap between the theoretical assumption conditions of CAPM model and the practical operation. However, there are many variables in the APT model, and only some of them play a key role in the investment
In the APT model, how to avoid selecting too many variables, avoiding excessive model fitting, not missing important variables, and choosing variables well is the main research direction in the future. The accuracy of the variable selection of the APT model determines the cost of equity financing, but also determines the corporate structure and corporate value.
References
[1]. Zhang Xiaodong. China Closed-end Fund and CAPM: Empirical test based on single-index model [J]. Journal of Shanghai Economic and Management Cadre Institute, 2012,10 (05): 46.
[2]. Wang Shuailong. CAPM's empirical analysis of the Shanghai Stock Market since the 18th CPC National Congress [J]. Chinese and foreign entrepreneurs, 2016 (04): 82.
[3]. Haizi Yang. Applicability test of the CAPM model to Shanghai A-share bank shares [J]. Public Investment Guide, 2020 (21): 39-40.
[4]. Chen Mengyuan. Effectiveness test of CAPM Model: China Real Estate Stock Market [J]. Finance and Economy, 2019 (18): 69-71.
[5]. crown. Test of the effectiveness of the CAPM model in the real estate industry [J]. Industry and Technology Forum, 2019,18 (17): 139-140.
[6]. Chen Shaohua. An Empirical Research on Chinese Liquor Industry Based on CAPM Model [J]. Modern Marketing (Next ten days), 2020 (07): 148-149.
[7]. Yang Yixuan. An Empirical Test of the Applicability of the CAPM Model in the Shenzhen Securities Market [J]. Modern trade and industry, 2020,41 (23): 122-123.
[8]. Qiao Yu. Financial Management of SOR & D Project [J]. Tax payment, 2020 (06): 83-84.
[9]. Tian Chaimeng. Analysis and Countermeasures of Financial Risk Management of State-owned Enterprise Equity Investment Projects [J]. Business News, 2021 (02): 43-44.
[10]. Yang Tianjiao. Analysis of the problems and suggestions existing in the project investment management of State-owned enterprises [J]. Township Enterprise Accounting in China, 2020 (06): 83-84.
[11]. Song Ruibo. Strategies to deal with the financial risks of enterprise investment projects [J]. Business News, 2020 (32): 68-69.
[12]. Chen Qian. How to manage and manage the financial control of new product development projects?[J]. Marketing community, 2019 (26): 85-86.
[13]. Li Meng, Hu Wenxiu, Li Bingxiang. Research on the influence of equity concentration on the speed of enterprise capital structure adjustment ——— is based on the perspective of manager management defense [J]. Journal of Xi'an University of Finance and Economics, 2021,34 (02): 91-99.
[14]. Li Yong, Li Peng. Does the corporate capital structure have an impact on the enterprise value in the transformation economy? Empirical analysis of ——— based on panel data of Chinese listed companies [J]. Economic Jingwei, 2013 (02): 105-110.
[15]. Yang Song. Analysis of the correlation between growth and capital structure of listed companies in circulation Industry [J]. Business Economy Research, 2020 (24): 173-175.
[16]. Zhihao. Design and Application of WACC Capital Structure Decision Model of Listed Company [J]. Shopping mall modernization, 2020 (23): 164-166.
[17]. Danthine and Donaldson.Intermediate Financial Theory.Elsevier,2nd Edition,2005.
[18]. Liu Xinchao. Empirical Analysis of the Impact of Listed Company Equity Structure on Capital Structure [J]. Accounting and Communications, 2014 (24): 34-37.
[19]. Markowitz,H.M.Portfolio Selection.Journal of Finance,7/1(Mar).1952.
[20]. Gao Yanrong, Lei Lei, Zhu Xiaoyun. Tax shield effect in the selection of enterprise capital structure [J]. Business Research, 2020 (11): 18-24.
[21]. Bodie,Z.Merton,R.C.Finance:Prentice-Hall.2010.
[22]. Ross,S.A.Arbitrage Theory of Capital Asset Pricing.Journal of Economic Theory 13,December.1976.
Cite this article
Liao,J. (2023). Relationship Between Corporate Capital Structure and Company Value — Based on the CAPM and APT model and the WACC analysis. Advances in Economics, Management and Political Sciences,19,107-117.
Data availability
The datasets used and/or analyzed during the current study will be available from the authors upon reasonable request.
Disclaimer/Publisher's Note
The statements, opinions and data contained in all publications are solely those of the individual author(s) and contributor(s) and not of EWA Publishing and/or the editor(s). EWA Publishing and/or the editor(s) disclaim responsibility for any injury to people or property resulting from any ideas, methods, instructions or products referred to in the content.
About volume
Volume title: Proceedings of the 2023 International Conference on Management Research and Economic Development
© 2024 by the author(s). Licensee EWA Publishing, Oxford, UK. This article is an open access article distributed under the terms and
conditions of the Creative Commons Attribution (CC BY) license. Authors who
publish this series agree to the following terms:
1. Authors retain copyright and grant the series right of first publication with the work simultaneously licensed under a Creative Commons
Attribution License that allows others to share the work with an acknowledgment of the work's authorship and initial publication in this
series.
2. Authors are able to enter into separate, additional contractual arrangements for the non-exclusive distribution of the series's published
version of the work (e.g., post it to an institutional repository or publish it in a book), with an acknowledgment of its initial
publication in this series.
3. Authors are permitted and encouraged to post their work online (e.g., in institutional repositories or on their website) prior to and
during the submission process, as it can lead to productive exchanges, as well as earlier and greater citation of published work (See
Open access policy for details).
References
[1]. Zhang Xiaodong. China Closed-end Fund and CAPM: Empirical test based on single-index model [J]. Journal of Shanghai Economic and Management Cadre Institute, 2012,10 (05): 46.
[2]. Wang Shuailong. CAPM's empirical analysis of the Shanghai Stock Market since the 18th CPC National Congress [J]. Chinese and foreign entrepreneurs, 2016 (04): 82.
[3]. Haizi Yang. Applicability test of the CAPM model to Shanghai A-share bank shares [J]. Public Investment Guide, 2020 (21): 39-40.
[4]. Chen Mengyuan. Effectiveness test of CAPM Model: China Real Estate Stock Market [J]. Finance and Economy, 2019 (18): 69-71.
[5]. crown. Test of the effectiveness of the CAPM model in the real estate industry [J]. Industry and Technology Forum, 2019,18 (17): 139-140.
[6]. Chen Shaohua. An Empirical Research on Chinese Liquor Industry Based on CAPM Model [J]. Modern Marketing (Next ten days), 2020 (07): 148-149.
[7]. Yang Yixuan. An Empirical Test of the Applicability of the CAPM Model in the Shenzhen Securities Market [J]. Modern trade and industry, 2020,41 (23): 122-123.
[8]. Qiao Yu. Financial Management of SOR & D Project [J]. Tax payment, 2020 (06): 83-84.
[9]. Tian Chaimeng. Analysis and Countermeasures of Financial Risk Management of State-owned Enterprise Equity Investment Projects [J]. Business News, 2021 (02): 43-44.
[10]. Yang Tianjiao. Analysis of the problems and suggestions existing in the project investment management of State-owned enterprises [J]. Township Enterprise Accounting in China, 2020 (06): 83-84.
[11]. Song Ruibo. Strategies to deal with the financial risks of enterprise investment projects [J]. Business News, 2020 (32): 68-69.
[12]. Chen Qian. How to manage and manage the financial control of new product development projects?[J]. Marketing community, 2019 (26): 85-86.
[13]. Li Meng, Hu Wenxiu, Li Bingxiang. Research on the influence of equity concentration on the speed of enterprise capital structure adjustment ——— is based on the perspective of manager management defense [J]. Journal of Xi'an University of Finance and Economics, 2021,34 (02): 91-99.
[14]. Li Yong, Li Peng. Does the corporate capital structure have an impact on the enterprise value in the transformation economy? Empirical analysis of ——— based on panel data of Chinese listed companies [J]. Economic Jingwei, 2013 (02): 105-110.
[15]. Yang Song. Analysis of the correlation between growth and capital structure of listed companies in circulation Industry [J]. Business Economy Research, 2020 (24): 173-175.
[16]. Zhihao. Design and Application of WACC Capital Structure Decision Model of Listed Company [J]. Shopping mall modernization, 2020 (23): 164-166.
[17]. Danthine and Donaldson.Intermediate Financial Theory.Elsevier,2nd Edition,2005.
[18]. Liu Xinchao. Empirical Analysis of the Impact of Listed Company Equity Structure on Capital Structure [J]. Accounting and Communications, 2014 (24): 34-37.
[19]. Markowitz,H.M.Portfolio Selection.Journal of Finance,7/1(Mar).1952.
[20]. Gao Yanrong, Lei Lei, Zhu Xiaoyun. Tax shield effect in the selection of enterprise capital structure [J]. Business Research, 2020 (11): 18-24.
[21]. Bodie,Z.Merton,R.C.Finance:Prentice-Hall.2010.
[22]. Ross,S.A.Arbitrage Theory of Capital Asset Pricing.Journal of Economic Theory 13,December.1976.