


1. Introduction
The salary cap is the maximum amount of money a professional sports team can spend on player salaries. It helps maintain fairness and balance within a professional sports league by preventing affluent clubs from increasing their payrolls to a level that allows them to acquire talent vastly superior to that of small market clubs [1]. With a salary cap in place, all teams, regardless of their financial standing, will spend a similar amount on player salaries. This encourages a balanced distribution of talent throughout the league. In contrast, if the league fails to implement a salary cap or other mechanisms to maintain competitive balance, fans may soon lose interest in watching games due to the elimination of outcome uncertainty [2]. The similar finding is revealed by Lakhani and Ferguson, one standard deviation decrease in the outcome uncertainty of a game would result in an 11.2% decrease in attendance [3].
Another benefit associated with the salary cap is that it safeguards the long-term financial health of franchises. Typically, salaries constitute the largest portion of a club's operating expenses [4]. In 1983, when professional sports were not as influential as they are today, player salaries already accounted for 53 percent of a National Basketball Association (NBA) club's gross revenues [5]. The specific player salary expenses vary season by season, but one thing is certain: the current figure will not be less dramatic. By imposing a salary cap, however, it is possible to ensure that team owners are spending money in a rational manner. The instance of spending extravagant amounts of money on player recruitment that may threaten the club's sustainable development can be avoided to the greatest extent possible [6].
Most sports leagues have rules governing how much each club can spend on its roster. Across four major sports leagues in North America, Major League Baseball (MLB) is the only exception without a cap system [7]. The structures of the salary cap systems can vary in terms of how the limit is determined. For instance, the NBA implemented a one-size-fits-all cap rule, meaning that every club has the same annual budget for player salaries. The cap value is derived from the past season’s Basketball Related Income [8]. However, exceeding the projected cap to sign players is also permitted in the NBA, if the club owner is willing to pay the luxury tax or salary cap exceptions have been met. Other leagues, such as the National Football League (NFL), instead of establishing a general cap maximum for everyone, giving individual club different limits [9]. At this point, it is clear that the salary cap can be a crucial predictor of team performance. The higher the salary cap, the more room a team is theoretically able to acquire its desired players, thereby enhancing the team's overall competitiveness. Thus, this study hypothesizes that a higher salary cap brings about a better team ranking in both the La Liga and NFL.
2. Methods
For the purpose of testing this hypothesis, each team’s salary limit (IV: Independent Variable) from both the LaLiga and NFL across four seasons between 2018/2019 and 2021/2022 was collected. The team performance is proxied by the team ranking, the dependent variable, in par with the fact that teams with higher ranking positions are those with better performance. There is a total number of 208 observations gathered, 80 from La Liga and 128 from the NFL. The data was collected from multiple sources including fbref.com, sportrac.com and Statista.com, all of which are with a reputation in professional sports or data provision. The analysis of the nexus between team performance and salary cap is conducted via the correlation and regression analysis.
3. Experimental Results
3.1. Correlation
The correlation between salary cap and the team ranking of four consecutive LaLiga seasons is depicted in Figure 1 to Figure 4. The correlations of the four seasons were -0.68 (2018-2019), -0.67 (2019-2020), -0.65 (2020-2021), and -0.57 (2021-2022). The average correlation across 4 seasons is -0.63. This shows that there is a strong linear relationship between salary cap and team ranking. The correlation is negative because the trendline is downward sloping, meaning that a higher salary cap will lead to a higher team ranking.
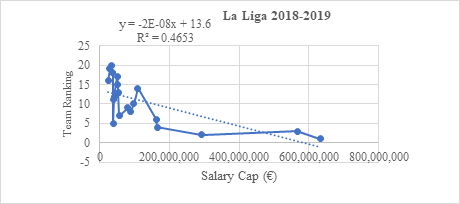
Figure 1: 2018-2019 La Liga League salary cap vs Team Ranking season [Owner-draw].
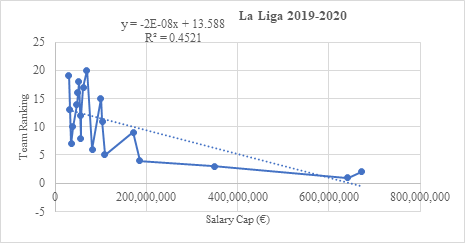
Figure 2: 2019-2020 La Liga League salary cap vs Team Ranking season [Owner-draw].
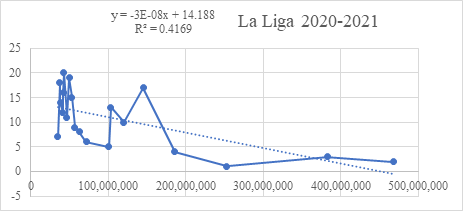
Figure 3: 2020-2021 La Liga League salary cap vs Team Ranking season [Owner-draw].
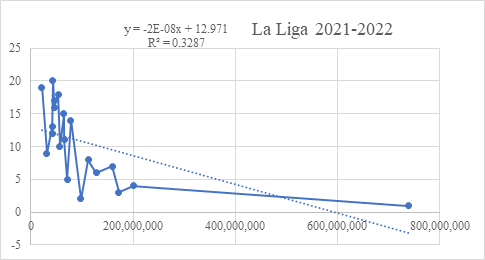
Figure 4: 2021-2022 La Liga League salary cap vs Team Ranking season [Owner-draw].
The scatterplots between salary cap and positions in NFL over four seasons are depicted in Figures 5 to Figure 8. The correlations between team ranking and salary cap across the four seasons are -0.123 (2018/2019), -0.375 (2019/2020), 0.012 (2020/2021) and 0.169 (2021/2022), respectively. These results are time varying, with some being positive and others being negative. Moreover, the absolute value of the correlation coefficients except 2019/2020 season is below 0.2, indicating a weak linear relationship between the salary cap and team ranking.
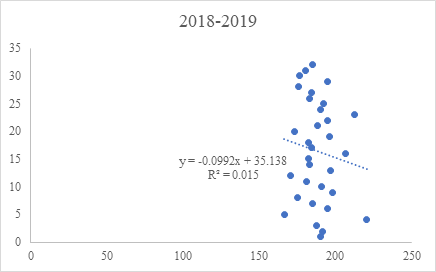
Figure 5: 2018-2019 NFL season correlation between salary vs team ranking [Owner-draw].
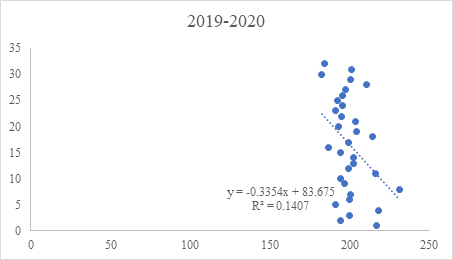
Figure 6: :2019-2020 NFL season correlation between salary vs team ranking [Owner-draw].
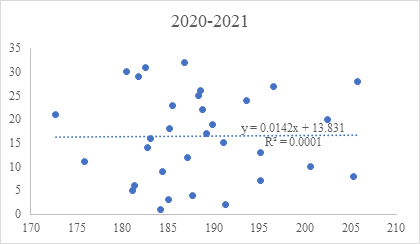
Figure 7: 2020-2021 NFL season correlation between salary vs team ranking [Owner-draw].
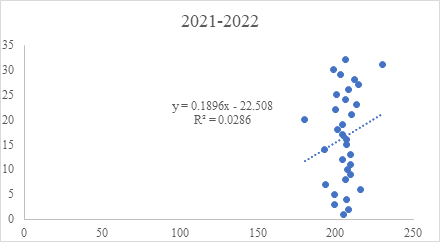
Figure 8: 2021-2022 NFL season correlation between salary vs team ranking [Owner-draw].
3.2. Regression
3.2.1 La Liga
Table 1: 2018-2019 La Liga data regression analysis [Owner-draw].
La Liga | 2018-2019 | |||
Regression Statistics | ||||
Multiple R | 0.68211975 | |||
R Square | 0.46528735 | |||
Adjusted R Square | 0.43558109 | |||
Standard Error | 4.44462167 | |||
Observations | 20 | |||
| Coefficients | Standard Error | t Stat | P-value |
Intercept | 13.6003384 | 1.265471153 | 10.7472528 | 2.9135E-09 |
X Variable 1 | -2.339E-08 | 5.91097E-09 | -3.9576433 | 0.00092293 |
Table 2: 2019-2020 La Liga data regression analysis [Owner-draw].
La Liga | 2019-2020 | |||
Regression Statistics | ||||
Multiple R | 0.67240152 | |||
R Square | 0.4521238 | |||
Adjusted R Square | 0.42168623 | |||
Standard Error | 4.49899787 | |||
Observations | 20 | |||
| Coefficients | Standard Error | t Stat | P-value |
Intercept | 13.5878811 | 1.28606315 | 10.5654851 | 3.8055E-09 |
X Variable 1 | -2.101E-08 | 5.4523E-09 | -3.8541066 | 0.00116243 |
Table 3: 2020-2021 La Liga data regression analysis [Owner-draw].
La Liga | 2020-2021 | |||
Regression Statistics | ||||
Multiple R | 0.64567815 | |||
R Square | 0.41690028 | |||
Adjusted R Square | 0.38450585 | |||
Standard Error | 4.64136784 | |||
Observations | 20 | |||
| Coefficients | Standard Error | t Stat | P-value |
Intercept | 14.1879694 | 1.46080914 | 9.71240457 | 1.3967E-08 |
X Variable 1 | -3.162E-08 | 8.8129E-09 | -3.5874093 | 0.00210534 |
Table 4: 2021-2022 La Liga data regression analysis [Owner-draw].
La Liga | 2021-2022 | |||
Regression Statistics | ||||
Multiple R | 0.573310939 | |||
R Square | 0.328685433 | |||
Adjusted R Square | 0.291390179 | |||
Standard Error | 4.98009475 | |||
Observations | 20 | |||
| Coefficients | Standard Error | t Stat | P-value |
Intercept | 12.97136909 | 1.390356528 | 9.32952723 | 2.5702E-08 |
X Variable 1 | -2.18107E-08 | 7.34693E-09 | -2.9686804 | 0.00822652 |
Through regression analysis, the R2 value, coefficients, and P value of the chosen LaLiga season are known. As shown in Table 1 to Table 4, R2 value of 4 seasons was 0.47 (2018-2019), 0.45 (2019-2020), 0.42 (2020-2021), and 0.33 (2021-2022), with an average of 0.42. This means that on average, 42% of the changes in team ranking can be explained by the changes in the salary cap.
The X-variable 1 in coefficients represents the ‘a’ in the equation y = ax + b. The average ‘a’ of the four seasons is negative 2.45E-8. This means that by spending 1 more dollar (or Euro) on the salary cap, the number that represent team’s ranking will decline 2.45E-8. Therefore, by spending more money on the team’s salary cap gets the number closer to zero, resulting to a higher ranking on the table.
The P value determines whether if we rejected the null hypothesis or not. As shown in Table 1 to Table 4, P-value is 0.00092 (2018-2019), 0.0011 (2019-2020), 0.0021 (2020-2021), 0.0082 (2021-2022). The average P value over the course of four seasons was 0.003. As it is believed that higher salary caps make teams rank higher, this is an alternative hypothesis, so the one-tailed P-value, which equals half of the P-value, should be applied. 0.0015 is significantly below the alpha level, no matter it is 0.05 or 0.01, thereby rejecting the null hypothesis that the salary cap has no effect on team ranking.
3.2.2 NFL.
The results of the correlation analysis imply a quite weak nexus between team ranking and salary cap, but correlation analysis usually has nothing to say about causality [10]. This study then carries out the regression analysis to see whether a potential causality exists between the interested variables. However, the results displayed in Table 5, 6, 7 and 8 are disappointing. On the one hand, with the exception of the 2019 season, the remaining seasons' one-tailed p-values exceed the alpha level of 0.05. This implies that no causality between a team's salary cap and its ranking has been observed for most seasons. On the other hand, the R-square, which signals the explanatory power of a regression model [11], is extremely small in these four seasons, averaging 0.0461. In other words, the salary cap accounted for only 4.61 percent of the variance in NFL team rankings. Therefore, there must be better predictors of a team's ranking than the salary cap.
Table 5: 2018-2019 NFL data regression analysis [Owner-draw].
Regression Statistics | ||||
Multiple R | 0.1226 | |||
R Square | 0.0150 | |||
Adjusted R Square | -0.0178 | |||
Standard Error | 9.4640 | |||
Observations | 32 | |||
| Coefficients | Standard Error | t Stat | P-value |
Intercept | 35.1378 | 27.5975 | 1.2732 | 0.2127 |
Salary Cap | -0.0992 | 0.1465 | -0.6766 | 0.5039 |
Table 6: 2019-2020 NFL data regression analysis [Owner-draw].
Regression Statistics | ||||
Multiple R | 0.3750 | |||
R Square | 0.1407 | |||
Adjusted R Square | 0.1120 | |||
Standard Error | 8.8398 | |||
Observations | 32 | |||
| Coefficients | Standard Error | t Stat | P-value |
Intercept | 83.6751 | 30.3543 | 2.7566 | 0.0098 |
Salary Cap | -0.3354 | 0.1514 | -2.2160 | 0.0344 |
Table 7: 2020-2021 NFL data regression analysis [Owner-draw].
Regression Statistics | ||||
Multiple R | 0.0119 | |||
R Square | 0.0001 | |||
Adjusted R Square | -0.0332 | |||
Standard Error | 9.5352 | |||
Observations | 32 | |||
| Coefficients | Standard Error | t Stat | P-value |
Intercept | 13.8312 | 41.1436 | 0.3362 | 0.7391 |
Salary Cap | 0.0142 | 0.2182 | 0.0649 | 0.9487 |
Table 8: 2021-2022 NFL data regression analysis [Owner-draw].
Regression Statistics | ||||
Multiple R | 0.1690 | |||
R Square | 0.0286 | |||
Adjusted R Square | -0.0038 | |||
Standard Error | 9.3987 | |||
Observations | 32 | |||
| Coefficients | Standard Error | t Stat | P-value |
Intercept | -22.5079 | 41.5684 | -0.5415 | 0.5922 |
Salary Cap | 0.1896 | 0.2019 | 0.9392 | 0.3552 |
4. Experimental Discussion
The results support the hypothesis that a higher salary cap leads to a higher team ranking in the La Liga. The correlation analysis shows that these two variables are highly correlated. However, keep in mind that the salary cap is only one of many factors that influence team rankings. High salary caps increase the probability of achieving a high team ranking, but this is not guaranteed. For example, in the 2018–19 season, Celta’s salary cap was 50 million euros. Yet, Celta placed 17th. In the 2019-2020 season, Espanyol’s salary cap was 68.7 million euros, and the team relegated at that season. All of these examples demonstrate that a higher salary cap does not necessarily result in a higher ranking and that this is a fairly common occurrence. Even though the salary cap is a crucial factor in determining a team's ranking, other factors such as players' physical conditions, coaching staff competence, roster reasonableness, and team chemistry are also essential in determining a team's overall record. In contrast, this study finds that there is lack of a nexus between salary cap and team ranking in NFL, not supporting the hypothesis. The correlation analysis reveals that these two variables are weakly correlated. The regression analysis reveals the similar finding that salary cap plays a very limited role in team ranking, as the one-tailed P-value is smaller than the alpha level only in 2019/2020 season. An American football team's ranking does not improve with an increase in player expenses, possibly due to the NFL’s hard salary cap. The average differences between the salary cap of the team that spends the most and the team that spends the least for four selected seasons is 46.44 millions [12]. This amount is insufficient to distinguish the NFL teams by their financial attractiveness to talent players. Elite NFL players nowadays can earn over $50 million per season. For example, Aaron Rodger's three-year contract with the Packers guarantees him a staggering $150.6 million [13]. Therefore, the roster construction expenditures for each NFL franchises are comparable. The variances in salary cap are too little to have a tremendous impact on the final standings.
5. Conclusion
In conclusion, the research shows that a higher salary cap can lead to a higher ranking in the Spanish soccer league, whereas the amount of wage costs has no bearing on where an NFL team ends up. The inconsistency in the results is possibly because American football has a relatively more complex system. Each American football team consists of forty to fifty players, while that of a soccer team is only eleven. The larger the team, the greater the number of tactics that can be employed and, consequently, the greater the number of possible game-changing scenarios. Additionally, American football is more physical than soccer, which increases the likelihood of injury. If key players, who contribute significantly to a team's salary cap, are injured and miss the entire season, the team's overall performance must be discounted. As a result, the team may not complete the position as expected. Last but not least, the size of an American football stadium is larger than that of a normal football stadium, resulting in greater home-field advantages. The exact effect of these variables on the team’s ranking is unexplored in this research, necessitating additional researches to test the possibility of correlations.
References
[1]. Totty, E. S., & Owens, M. F. (2011). Salary caps and competitive balance in professional sports leagues. Journal for Economic Educators, 11(2), 45-56.
[2]. Zimbalist, A. S. (2002). Competitive Balance in Sports Leagues: An Introduction. Journal of Sports Economics, 3(2), 111–121. https://doi.org/10.1177/152700250200300201
[3]. Lakhani, K. R., & Ferguson, P. J. (2021). Consuming Contests: Outcome Uncertainty and Spectator Demand for Contest-based Entertainment. Harvard Business School.
[4]. Dietl, H. M., Franck, E., Lang, M., & Rathke, A. (2012). Salary cap regulation in professional team sports. Contemporary Economic Policy, 30(3), 307-319. https://doi.org/10.1111/j.1465-7287.2011.00265.x
[5]. Staudohar, P. D. (1999). Labor relations in basketball: the lockout of 1998-99. Monthly Lab. Rev., 122, 3.
[6]. Zimbalist, A. (2010). Reflections on salary shares and salary caps. Journal of Sports Economics, 11(1), 17-28. https://doi.org/10.1177/1527002509354890
[7]. Aubut, M. (2003). When negotiations fail: An analysis of salary arbitration and salary cap systems. Sports Law Journal, 189, 190-236.
[8]. Miller, K. (2018) How NBA free agency, salary Cap work, Bleacher Report. Bleacher Report. Available at: https://bleacherreport.com/articles/2787871-how-nba-free-agency-salary-cap-work (Accessed: January 30, 2023).
[9]. Sanderson, A. R., and Siegfried, J. J. (2003). Thinking about competitive balance. Journal of Sports Economics, 4(4), 255-279.
[10]. Hall, S., Szymanski, S., & Zimbalist, A. S. (2002). Testing causality between team performance and payroll: The cases of Major League Baseball and English soccer. Journal of sports economics, 3(2), 149-168.
[11]. Buzzacchi, L., Caviggioli, F., Milone, F.L. and Scotti, D., (2021). Impact and Efficiency Ranking of Football Managers in the Italian Serie A: Sport and Financial Performance. Journal of Sports Economics, 22(7), 744-776. https://doi.org/10.1177/15270025211012053
[12]. Spotrac.com, (n.d.). NFL Team Salary Cap Tracker. Retrieved February 4, 2023, from https://www.spotrac.com/nfl/cap/
[13]. Camenker, J. (2022, September 01). The NFL's 25 highest-paid players in 2022: Aaron Rodgers, Russell Wilson, Kyler Murray set the standard. Retrieved January 30, 2023, from https://www.sportingnews.com/us/nfl/news/nfl-highest-paid-players-2022/ot9egmldb6sly6mtqc3jb1dx
Cite this article
Zeng,J.;Wu,C.;Ge,R.;Tang,Z. (2023). Can Higher Salary Cap Bring the Team a Trophy? -The Correlation Between Player Salary Expense and Team’s Ranking. Advances in Economics, Management and Political Sciences,20,110-118.
Data availability
The datasets used and/or analyzed during the current study will be available from the authors upon reasonable request.
Disclaimer/Publisher's Note
The statements, opinions and data contained in all publications are solely those of the individual author(s) and contributor(s) and not of EWA Publishing and/or the editor(s). EWA Publishing and/or the editor(s) disclaim responsibility for any injury to people or property resulting from any ideas, methods, instructions or products referred to in the content.
About volume
Volume title: Proceedings of the 2023 International Conference on Management Research and Economic Development
© 2024 by the author(s). Licensee EWA Publishing, Oxford, UK. This article is an open access article distributed under the terms and
conditions of the Creative Commons Attribution (CC BY) license. Authors who
publish this series agree to the following terms:
1. Authors retain copyright and grant the series right of first publication with the work simultaneously licensed under a Creative Commons
Attribution License that allows others to share the work with an acknowledgment of the work's authorship and initial publication in this
series.
2. Authors are able to enter into separate, additional contractual arrangements for the non-exclusive distribution of the series's published
version of the work (e.g., post it to an institutional repository or publish it in a book), with an acknowledgment of its initial
publication in this series.
3. Authors are permitted and encouraged to post their work online (e.g., in institutional repositories or on their website) prior to and
during the submission process, as it can lead to productive exchanges, as well as earlier and greater citation of published work (See
Open access policy for details).
References
[1]. Totty, E. S., & Owens, M. F. (2011). Salary caps and competitive balance in professional sports leagues. Journal for Economic Educators, 11(2), 45-56.
[2]. Zimbalist, A. S. (2002). Competitive Balance in Sports Leagues: An Introduction. Journal of Sports Economics, 3(2), 111–121. https://doi.org/10.1177/152700250200300201
[3]. Lakhani, K. R., & Ferguson, P. J. (2021). Consuming Contests: Outcome Uncertainty and Spectator Demand for Contest-based Entertainment. Harvard Business School.
[4]. Dietl, H. M., Franck, E., Lang, M., & Rathke, A. (2012). Salary cap regulation in professional team sports. Contemporary Economic Policy, 30(3), 307-319. https://doi.org/10.1111/j.1465-7287.2011.00265.x
[5]. Staudohar, P. D. (1999). Labor relations in basketball: the lockout of 1998-99. Monthly Lab. Rev., 122, 3.
[6]. Zimbalist, A. (2010). Reflections on salary shares and salary caps. Journal of Sports Economics, 11(1), 17-28. https://doi.org/10.1177/1527002509354890
[7]. Aubut, M. (2003). When negotiations fail: An analysis of salary arbitration and salary cap systems. Sports Law Journal, 189, 190-236.
[8]. Miller, K. (2018) How NBA free agency, salary Cap work, Bleacher Report. Bleacher Report. Available at: https://bleacherreport.com/articles/2787871-how-nba-free-agency-salary-cap-work (Accessed: January 30, 2023).
[9]. Sanderson, A. R., and Siegfried, J. J. (2003). Thinking about competitive balance. Journal of Sports Economics, 4(4), 255-279.
[10]. Hall, S., Szymanski, S., & Zimbalist, A. S. (2002). Testing causality between team performance and payroll: The cases of Major League Baseball and English soccer. Journal of sports economics, 3(2), 149-168.
[11]. Buzzacchi, L., Caviggioli, F., Milone, F.L. and Scotti, D., (2021). Impact and Efficiency Ranking of Football Managers in the Italian Serie A: Sport and Financial Performance. Journal of Sports Economics, 22(7), 744-776. https://doi.org/10.1177/15270025211012053
[12]. Spotrac.com, (n.d.). NFL Team Salary Cap Tracker. Retrieved February 4, 2023, from https://www.spotrac.com/nfl/cap/
[13]. Camenker, J. (2022, September 01). The NFL's 25 highest-paid players in 2022: Aaron Rodgers, Russell Wilson, Kyler Murray set the standard. Retrieved January 30, 2023, from https://www.sportingnews.com/us/nfl/news/nfl-highest-paid-players-2022/ot9egmldb6sly6mtqc3jb1dx