


1. Introduction
Starbucks Corporation is an American multinational chain of coffeehouses and roastery reserves headquartered in Seattle, Washington. As the world's largest coffeehouse chain, Starbucks is known for its signature roasted coffee, handcrafted beverages, and lively atmosphere [1]. But in recent years, some problems have appeared. The financial statements of a company can directly reflect its operating performance and other related information. Therefore, by examining the financial reports, we can gain insights into the current status, strengths, weaknesses of Starbucks, and make predictions about its future development. We will mainly use data from the income statement and balance sheet [2]. In this paper, we can streamline Starbucks' financial statements and use some ratios to more intuitively reflect why Starbucks has become risky based on the research in the ratio of financial report data like the ROA and ROE. At the same time, it can analyze existing problems and provide suggestions for further development.
2. Theoretical Basis
ROA and ROE are valuable indicators of a company's profitability and efficiency, as they provide insight into how effectively a company is using its assets and equity to generate profits [3]. The paper uses ratio analysis to more intuitively analyze the financial reports of Starbucks over the past five years instead of just focusing on the data in the report. This can effectively prevent interference from data surface phenomena, and enable analysis based on the relationships between data. The main theories used include.
2.1. The Measurement of Profitability
In this progress, the paper mainly uses the figures of ROA and ROE. ROA (Return on Assets): ROA is used to measure a company's ability to generate net profit using its assets. The formula for calculating ROA is net profit divided by total assets. This indicator tells how much net profit the company generates per dollar of assets and is an important measure of the company's profitability. Generally, the higher the ROA, the better the company's operational efficiency. ROE (Return on Equity): ROE is used to measure a company's ability to generate net profit using its capital. The formula for calculating ROE is net profit divided by equity. Generally, the higher the ROE, the more efficient the company's use of capital and the greater value it creates.
2.2. The Measurement of the Efficiency
In this section, the paper mainly calculates three of the main figures: Assets turnover, Accounts receivable turnover and the inventory turnover.
Assets turnover is used to measure the efficiency of a company's assets, which is the ratio of a company's sales revenue to its total assets. The formula for assets turnover is: Sales revenue/Total assets. This metric tells the readers how much sales revenue a company generates per dollar of assets, and is an important indicator of a company's operational efficiency.
Accounts Receivable turnover is used to measure a company's ability to collect its accounts receivable within a certain period of time. The formula for accounts receivable turnover is: Sales revenue/Accounts receivable. This metric tells us how well a company manages its accounts receivable and its liquidity.
Inventory turnover the ratio of a company's sales revenue to its inventory. The formula for inventory turnover is: Sales revenue/Inventory. This metric tells us how much sales revenue a company generates per dollar of inventory, and is an important indicator of a company's inventory management and sales ability. Typically, the higher the inventory turnover, the better a company's inventory management ability and the faster its inventory turnover rate. When we calculate these three pieces of data, we can obtain some information about internal management of the company, such as whether the company can collect debts quickly, whether it does not incur a lot of costs in storage, etc. Therefore, it is necessary to perform this calculation.
3. Profitability Calculation of Starbucks
The paper has extracted useful data from Starbucks' financial statements for the past five years, as we can see in tables 1 and 2, and compiled them as follows [2]:
Table 2: Useful data in the statement of financial position.
2022 | 2021 | 2020 | 2019 | 2018 | |
Inventories | 2176.6 | 1603.9 | 1551.4 | 1529.4 | 1400.5 |
Accounts receivables | 1175.5 | 940 | 883.4 | 879.2 | 693.1 |
Total Assets | 27978.4 | 31392.6 | 29374.5 | 19219.6 | 24156.4 |
Accounts payable | 1441.4 | 1211.6 | 997.9 | 1189.7 | 1179.3 |
Total current liabilities | 9151.8 | 8151.4 | 7346.8 | 6168.7 | 5684.2 |
Total liabilities | 36677.1 | 36707.1 | 37173.9 | 25450.6 | 22980.6 |
Total equity | -8698.7 | -5314.5 | -7799.4 | -6231 | 1175.8 |
The paper just focuses on the performance of Starbucks, so it will ignore the events that happen in the consolidation and treat them as a whole and analysis the data ratio.
The paper ignored all the income tax savings and will use the average figure of the current total assets and the prior period's assets.
3.1. Calculation and the Analysis of ROA
According to the formula of ROA: ROA= \( \frac{Net Income+interest expense }{average total assets} \) , then it can be used to calculate the figure of ROA:
Table 3: ROA of the Starbucks.
2022 | 2021 | 2020 | 2019 | 2018 | |
Net income | 3283.4 | 4200.3 | 924.7 | 3594.6 | 4518 |
interest expense | 482.9 | 469.8 | 437 | 331 | 170.3 |
average total assets | 29685.5 | 30383.55 | 24297.05 | 21688 | 19261 |
ROA | 0.13 | 0.15 | 0.06 | 0.18 | 0.24 |
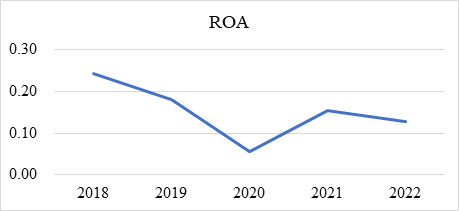 Figure 1: Changes of ROA from 2018 to 2022.
According to table 3 and figure 1, it can be seen that Starbucks had an ROA of 0.24 in 2018, and over the next five years, it experienced some fluctuations, ultimately declining to 0.13 [2]. In particular, there was a nearly one-third decrease from 2019 to 2020, which can be attributed to the impact of the COVID-19 pandemic. Overall, Starbucks' ability to generate profits from its assets declined over these five years, although there was some recovery after 2020, further improvements are still needed.
3.2. Calculation and Analysis of ROE
In this progress, we use the formular: ROE = \( \frac{Net Income}{Average Equity} \)
Table 4: ROE of the Starbucks.
2022 | 2021 | 2020 | 2019 | 2018 | |
Net income | 3283.4 | 4200.3 | 924.7 | 3594.6 | 4518 |
Average equity | -7006.6 | -6556.95 | -7015.2 | -2527.6 | 3316.4 |
ROE | -0.47 | -0.64 | -0.13 | -1.42 | 1.36 |
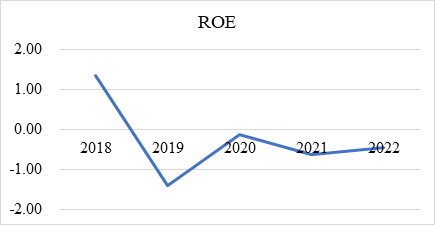
Figure 2: Changes of ROE from 2018 to 2022.
According to the table 4 and figure 2, in analyzing Starbucks' ROE over the past five years, it can observe an interesting phenomenon: while the company's ROE has been on an upward trend over the past four years, it has significantly decreased compared to 2018, even reaching negative values [2]. Through data analysis related to ROE, we can see that the main factor causing this phenomenon is the negative net assets or capital, which is assets minus liabilities. Starbucks has been experiencing a "negative net assets" problem in recent years. However, when we consider some of Starbucks' recent business policies, a negative ROE does not necessarily mean that Starbucks is a bad or unprofitable company. During the joint venture period, Starbucks embarked on a frenzy of expansion in East China. Combined with the analysis of some other people at the time, we can conclude that Starbucks' huge debt was mainly caused by its expansion policy and dividend payments, which indicates that Starbucks is continuing to grow, which is also one of the reasons for its success [4]. However, the consecutive negative ROEs are not a good sign. Coupled with the declining trend of ROAs, this may cause Starbucks investors to lose confidence. Therefore, Starbucks should take measures to control its debt and increase its revenue in the future, otherwise this high-risk business model could easily lead to problems.
In general, Starbucks' profitability in recent years has declined due to factors such as the pandemic and expansion policies. In the following sections, the paper will analyze each factor and identify the reasons for the fluctuations.
4. Calculation of the Efficiency
Efficiency Calculation of Starbucks.
As we previously introduced, in this section, we will mainly calculate Starbucks' efficiency using three data points.
4.1. Assets Turnover
Assets turnover is used to measure the efficiency of a company's assets, which is the ratio of a company's sales revenue to its total assets.
Table 5: Assets turnover in the 5 years.
2022 | 2021 | 2020 | 2019 | 2018 | |
Sales | 32250.3 | 29060.6 | 23518 | 26508.6 | 24719.5 |
Average total assets | 29685.5 | 30383.55 | 24297.05 | 21688 | 19261 |
Assets turnover | 1.09 | 0.96 | 0.97 | 1.22 | 1.28 |
According to table 5, Starbucks' asset turnover ratio has performed well overall in the past five years [2]. Although there was a decline in asset turnover in 2018 and 2021, the peak in 2019 indicates that the company was able to use its assets more effectively at the appropriate time. In addition, Starbucks' sales have shown a trend of increasing year by year, indicating that the company is constantly expanding its business and increasing sales.
4.2. Accounts Receivable Turnover
This data can measure a company's ability to collect accounts receivable. Cash is very important in business operations, so being able to collect accounts receivable in a timely manner can ensure the safe development of the company.
Table 6: Accounts receivable turnover of Starbucks in 5 years.
2022 | 2021 | 2020 | 2019 | 2018 | |
Sales | 32250.3 | 29060.6 | 23518 | 26508.6 | 24719.5 |
Average receivable | 1057.75 | 911.7 | 881.3 | 786.15 | 781.75 |
Accounts receivable turnover | 30.49 | 31.88 | 26.69 | 33.72 | 31.62 |
According to table 6, Starbucks' average accounts receivable turnover has fluctuated between 26.69 and 33.72 over the past five years, showing a relatively stable performance [2].
Starbucks' turnover ratio is as high as 30, which is a good sign. Overall, Starbucks' stable accounts receivable turnover over the past five years is a positive signal, demonstrating the company's strong financial management capabilities.
4.3. Inventory Turnover
Inventory turnover reflects the speed at which a company sells its inventory. A faster turnover indicates stronger management abilities and lower inventory costs, but it also requires a more complete, reliable, and efficient supply chain.
Table 7: Inventory turnover of Starbucks in the 5 years.
2022 | 2021 | 2020 | 2019 | 2018 | |
COGS | 10317.4 | 8738.7 | 7694.9 | 8526.9 | 7930.7 |
Average Inventory | 1890.25 | 1577.65 | 1540.4 | 1464.95 | 1382.25 |
Inventory Turnover | 5.46 | 5.54 | 5.00 | 5.82 | 5.74 |
From the data in the table 7, we can see that Starbucks' inventory turnover rate is also stable and as high as around 5 [2]. Therefore, it can be inferred that Starbucks has good performance in managing inventory.
Overall, Starbucks has a good performance in terms of operating efficiency. They can make full use of their assets and have excellent management techniques. However, it is worth noting that in 2019, almost all the data showed a downward trend, which may have been due to the impact of the outbreak of the COVID-19 pandemic on global companies.
5. Dupont Analysis
In the following section, we will use DuPont analysis to discuss the decomposition of ROA and ROE, and discuss specific factors that impact Starbucks.
5.1. Breakdown of ROA
When we further analyze ROA, we typically break it down into two components: profit margin and assets turnover, which represent the profitability of products and the efficiency of using assets, respectively, in their impact on ROA.
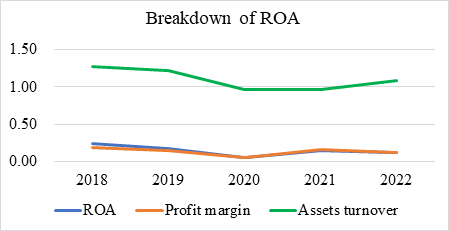
Figure 3: Changes of ROA and various relative elements.
As seen from the table 8 and figure 3, the decline in Starbucks' ROA is jointly caused by the decrease in assets turnover and profit margin [2]. The decrease in assets turnover has been analyzed earlier, but it is noteworthy that Starbucks' profit margin has also declined. Given the current market situation, this is reasonable. China is a big market for Starbucks, but in recent years, more and more competitors have emerged in the Chinese market, such as Luckin Coffee. In the more than 20 years since Starbucks entered China, coffee consumption in China has slowly risen, and now the coffee market has become a high-growth market, with many competitors vying for a share of the market. Among them, Luckin Coffee has emerged as the most aggressive player. Its continuous development of new products and the sale of coconut latte by the billions have dealt a heavy blow to Starbucks [5]. Starbucks positions itself as a high-end coffee brand, while its competitors sell at lower prices. Therefore, if Starbucks does not lower its profit margin, it will lose customers.
5.2. Breakdown of ROE
In the Dupont analysis, we usually breakdown the ROE into four parts, leverage ratio, assets turnover, profit margin, debt burden.
Table 9: Breakdown of ROE of Starbucks.
2018 | 2019 | 2020 | 2021 | 2022 | |
ROE | 1.36 | -1.42 | -0.13 | -0.64 | -0.47 |
Profit margin | 0.19 | 0.15 | 0.06 | 0.16 | 0.12 |
Assets turnover | 1.28 | 1.22 | 0.97 | 0.96 | 1.09 |
leverage ratio | 5.81 | -8.58 | -3.46 | -4.63 | -4.24 |
debt burden | 0.96 | 0.92 | 0.68 | 0.9 | 0.87 |
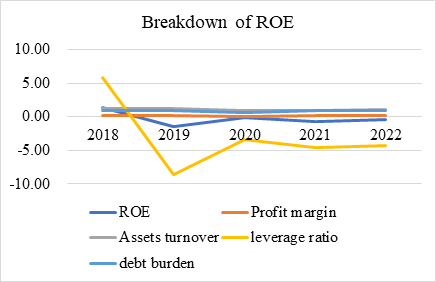
Figure 4: Changes of ROE and various relative elements.
According to table 9 and figure 4, it can be seen that leverage ratio has been the biggest factor affecting ROE, and Starbucks has had an excessively high leverage ratio since 2018, even reaching negative values [2]. From previous analysis, we can infer that Starbucks' expansion policy has left it over-leveraged, and while expansion is a sign of business growth, an excessive leverage ratio increases Starbucks' liquidity risk. Therefore, Starbucks should reduce its debt in the future, which means slowing down its expansion speed.
6. Risk Analysis and Future Development
According to the analysis in the paper, there are four main risks for Starbucks now:
6.1. Negative Net Assets
The explanation for this question has already been provided in the above analysis, but there is no doubt that it is the most important factor to consider, as investors may hesitate and have doubts when they see negative capital on financial reports when deciding whether to invest. Although Starbucks is constantly expanding, the market environment should be considered to determine whether it is worth continuing to expand. Therefore, in order for the company to develop sustainably and safely, Starbucks should first focus on improving its ROA and ROE.
6.2. Effect of the COVID-19 on the Market
Starbucks' financial report for the second quarter of its fiscal year 2022, announced on May 4, showed that same-store sales in Starbucks China fell 23% and same-store transactions fell 20%, resulting in a single-quarter revenue of US$740 million in China, down 14% year-on-year. China is an important market for Starbucks, but the impact of the COVID-19 has forced many locations to close or switch to online sales, which has had a huge impact on Starbucks' turnover in the country, which has declined significantly. In this environment, the advantages that Starbucks had in its brick-and-mortar shops will no longer be apparent. The pandemic has forced Starbucks to change its store layouts, introduce contactless payments, limit in-store seating, and introduce new takeaway options for its customers. Starbucks’ revenue has been impacted by the pandemic, with sales declining due to the closure of stores and lower footfall in its stores that remain open [6]. So, how to change the sales model or management style to adapt to this situation is the main challenge in the Chinese market today, and we should take this into consideration and treat it as a key risk.
6.3. The Supply Chain
Starbucks owes a great deal of its success to its supply chain. Starbucks' supply chain is a key component of its competitive advantage, which allows the company to offer high-quality coffee products and maintain customer loyalty [7]. However, with the emergence of competitors, Starbucks must constantly seek better and more sophisticated supply chain systems in order to maintain its unique advantage in the fiercely competitive market. In this era of data sharing, this undoubtedly requires Starbucks to update its management system more quickly.
6.4. Price of the Product
Starbucks has successfully created a premium brand image for its products, which allows it to charge higher prices and enjoy higher profit margins than its competitors [8]. One of the reasons for Starbucks' success is its higher profit margin, but the high-end positioning means higher prices. With the emergence of competitors offering coffee with the same taste at lower prices, Starbucks' profit margin has to decrease. Starbucks' main competitors, such as Luckin, mainly offer lower-priced coffee, so the main challenge is to keep prices stable and acceptable in such circumstances, otherwise they may lose out on the market. So, the price is also a key risk for Starbucks. The decline in profit margin for Starbucks has resulted in a decrease in ROA and ROE. Therefore, in the future, Starbucks should find ways to increase its profit margin, such as reducing costs or other expenses. According to recent financial reports, Starbucks has experienced a downward trend in its profit margin, which has directly led to a decrease in its ROA and ROE. Therefore, in order to improve the company's performance, Starbucks needs to find ways to increase its profit margin, such as reducing costs or other expenses.
7. Conclusion
As a globally popular coffee supplier, Starbucks has encountered some operational issues in its financial reports in recent years, despite having a strong management system. Factors such as the business environment and competition have contributed to this decline. In order to improve its performance, Starbucks should reduce its liabilities, increase asset utilization, and improve product profit margins. This can be achieved through the introduction of new products and the development of new business models.
This paper has limitations in its analysis of Starbucks' financial reports, as it overlooks the impact of its subsidiaries and tax shields. Further precision can be achieved by examining specific data.
In the future, additional research can conduct a horizontal comparison between Starbucks and its competitors, in order to identify the problems that Starbucks is currently facing with greater clarity.
References
[1]. Wikipedia. (2023). Starbucks. https://en.wikipedia.org/wiki/Starbucks
[2]. Starbucks Corporation. (2022). Form 10-K [SEC filing, Commission File Number 000-20322]. Washington, DC: United States Securities and Exchange Commission. P42-51
[3]. Helfert, E. A. (2001). Financial Analysis: A Business Decision Guide. McGraw-Hill Professional, New York, P89
[4]. Sohu.com. (2018), “Starbucks is about to change: new strategies for the Chinese market in 2018 are emerging!” ,www.sohu.com/a/224117344_100050280.
[5]. Lishi Commercial Comments, (2023), “From Conservative to Radical, Starbucks Forced to Seek Change.”, https://baijiahao.baidu.com/s?id=1761030797790558509&wfr=spider&for=pc
[6]. Kotler, P., Kartajaya, H., & Setiawan, I. (2021). Marketing 5.0: Technology for Humanity. John Wiley & Sons. Hoboken, New Jersey, P303
[7]. Christensen, C. M., Raynor, M. E., & Mark, R. (2012). The innovator's dilemma. Harvard Business School Press, Boston, P70
[8]. Kotler, P., & Keller, K. L. (2016). Marketing Management. Pearson. New York, P230
Cite this article
Li,J. (2023). Research on the Starbucks in Operational Activities. Advances in Economics, Management and Political Sciences,26,159-167.
Data availability
The datasets used and/or analyzed during the current study will be available from the authors upon reasonable request.
Disclaimer/Publisher's Note
The statements, opinions and data contained in all publications are solely those of the individual author(s) and contributor(s) and not of EWA Publishing and/or the editor(s). EWA Publishing and/or the editor(s) disclaim responsibility for any injury to people or property resulting from any ideas, methods, instructions or products referred to in the content.
About volume
Volume title: Proceedings of the 2023 International Conference on Management Research and Economic Development
© 2024 by the author(s). Licensee EWA Publishing, Oxford, UK. This article is an open access article distributed under the terms and
conditions of the Creative Commons Attribution (CC BY) license. Authors who
publish this series agree to the following terms:
1. Authors retain copyright and grant the series right of first publication with the work simultaneously licensed under a Creative Commons
Attribution License that allows others to share the work with an acknowledgment of the work's authorship and initial publication in this
series.
2. Authors are able to enter into separate, additional contractual arrangements for the non-exclusive distribution of the series's published
version of the work (e.g., post it to an institutional repository or publish it in a book), with an acknowledgment of its initial
publication in this series.
3. Authors are permitted and encouraged to post their work online (e.g., in institutional repositories or on their website) prior to and
during the submission process, as it can lead to productive exchanges, as well as earlier and greater citation of published work (See
Open access policy for details).
References
[1]. Wikipedia. (2023). Starbucks. https://en.wikipedia.org/wiki/Starbucks
[2]. Starbucks Corporation. (2022). Form 10-K [SEC filing, Commission File Number 000-20322]. Washington, DC: United States Securities and Exchange Commission. P42-51
[3]. Helfert, E. A. (2001). Financial Analysis: A Business Decision Guide. McGraw-Hill Professional, New York, P89
[4]. Sohu.com. (2018), “Starbucks is about to change: new strategies for the Chinese market in 2018 are emerging!” ,www.sohu.com/a/224117344_100050280.
[5]. Lishi Commercial Comments, (2023), “From Conservative to Radical, Starbucks Forced to Seek Change.”, https://baijiahao.baidu.com/s?id=1761030797790558509&wfr=spider&for=pc
[6]. Kotler, P., Kartajaya, H., & Setiawan, I. (2021). Marketing 5.0: Technology for Humanity. John Wiley & Sons. Hoboken, New Jersey, P303
[7]. Christensen, C. M., Raynor, M. E., & Mark, R. (2012). The innovator's dilemma. Harvard Business School Press, Boston, P70
[8]. Kotler, P., & Keller, K. L. (2016). Marketing Management. Pearson. New York, P230