


1 Introduction
Apple is a company that focus on technology industry and expecting expanding business to entertainment and automobile industry.[1] According to Forbes, Apple is the most valuable brand in 2020.[2] By studying strategies of Apple, the strength and weakness can be found to helping further development of the company. In this research, Five-Force Analysis, SWOT Analysis and Value chain Analysis methods will be implemented. Research target is analyzing the threats and opportunities in five business that Apple competing in.
2 Industry Analysis
Apple specialized in five industries, there are smartphones, personal computers, tablets, wearables, and accessories. Apple also provides online services to consumers. [3]
Smartphones Industry
The smartphone industry has been developing and growing steadily. 7.26 billion people have mobile phones, and 83.72% of them having smartphones in the world. [4] There are two types of costumers, first type of costumers are people do not have a smartphone and about to purchase a new phone, another one is smartphone owners looking for new replacement. The global average selling price of a smartphone was $363 in 2021,[5] Apple smartphones are considering high-end smartphones which cost about $ 799 and more (iPhone 13 series sold in the USA). [6] iPhones are powered by iOS operating system computed by Apple, the processing chips (also known as SoC) of Apple smartphones are design by Apple. The total units of global smartphone shipments were estimated to be around 1.43 billion units in 2022. Apple has a total 18% share in 2022 Q1, which placed Apple second in the smartphone industry. Samsung, Xiaomi, OPPO, and Vivo are the main competitors in this industry. [7]
Personal Computers
Global PC unit shipments rise between 2020 and 2021, due to the global pandemic. There are three operating systems in the PC industry – Windows, MacOS, and Linux. MacOS runs on Apple personal computers only. Other companies like Lenovo, HP, Dell, and Asus sell windows PC. Apple have two personal computers product lines. MacBook series in laptop form factor, Mac series in desktop form factor. the processing chips (also known as SoC) of Apple computers are design by Apple. Apple has a total of 9 percent share in PC industry in 2021. [8]
Wearables
In wearable industry, it can be divided into two categories, smartwatch, and traditional watch. Apple Watch has a total 36.1% market share in 2022 Q1 which sells the best in the industry. [9] Other companies like Samsung, Garmin, and Fitbit also make smartwatches. Apple Watch using apple chip and operating system.
Accessories
Apple produces number of accessories, AirPods are apple headphone series, in the leading true wireless stereo (TWS) market Apple has 26.5% share, which placed Apple number one in the market. [10] Apple also sells first party accessories like chargers, cables, phone case and other accessories. Other accessories makers need to pay certain amount of money to Apple for MFi certification.
Online Services
The two main online services which Apple provided are Apple TV and Apple Music. Apple TV is a media platform that provides entertainment for customers. HBO, Netflix, and Amazon are competitors in this industry. Apple Music is a music platform; Spotify is the main competitor for Apple Music.
3 Business Analysis
3.1 Apple Porter’s Five-Force Analysis
• The Threat of New Entrants:
The threat of a new entrant is relatively low for Apple, due to the high technical barriers and large capital required to enter this industry. Also, most companies in the industry already have a group of loyal customers and a positive reputation. Therefore, the new entrants have to bear the huge initial capital expenditure to support their brand development and lack of reputation in the market. Overall, the threat of new entrants is unlikely to influence the profitability of Apple.
• Bargaining Power of Suppliers:
The bargaining power of suppliers is relatively weak in the market for Apple. The suppliers for Apple are throughout the world which leads to Apple having more right to choose better suppliers and having a strong position to negotiate the price with suppliers. Also, the switching cost for Apple to change alternative suppliers is low. For example, there are several screen panels manufactures, Apple is able to choose BOE or Samsung to make screen for iPhone, and Apple have strong bargaining power with them. Apple is normally the major customer for those suppliers, they do not want to lose the business with Apple which also makes them have a lower position during negotiation. Apple prefer to remain strong bargaining power with their suppliers. However, Qualcomm - the supplier of 5G baseband for iPhone have strong bargaining power with Apple, and Apple failed to design 5G baseband for iPhone series. And there are limited number of companies have abilities to produce processors under 10nm architecture. All Apple A series and M series chips are manufactured by TSMC. Another strategy Apple used to control supply chain is directly funding project with one of their suppliers, so apple have right to determine price and have copyright for certain product.
• Bargaining Power of Customers:
The bargaining power of customers can cause a strong influence on Apple. For Apple, the customers could separate into two categories: individual customers and group business customers. The loss of individual customers is acceptable for Apple, they have low bargaining power. However, group business customers have more bargaining power. Apple could not accept losing this massive number of customers. Because the switching cost for Apple customers is low, Apple has to give more funds and capital to develop new and innovative products to keep their customers. Apple usually does not have promotion for they products, which leads to a consist price and has low possibilities for customers bargaining price.
• The Threat of Substitutes:
Apple is a technology company, the products are considered advanced. There is barely a threat for Apple’s products in the substitutes area. For the apple watch, the substitute is a mechanical watch. People still will choose to buy a mechanical watch for fame or interests. There is no product can replace the function of smartphones or personal computers at the moment.
• Industry Rivalry:
The competition in the technology market is strong for Apple. In the phone market, Apple is competing with Samsung, Mi, Vivo, and Oppo. Specially, the competitors all running Android operating system at different price point. Android smartphones also have strong supply chain offering great components. For example, iPhone series need compete with Android smartphones in many areas. iPhone A series arm chips are competing against Qualcomm and MTK. The competition is relatively intense in technology industry. In the Computer Manufacturers market, HP, Dell, Lenovo, and Asus are the competitors for Apple. Apple have decided only using Apple Silicon in their product line. And other companies are using chips powered by intel, AMD and Nvidia. This means that Apple are now directly competing with three technology giants. According to Statista, in the global market share in Q1 2022, Apple was in fourth place, at 9%. Lenovo has the highest share at 23.6 %. [11] In wearable industry, three companies (Samsung, Google and Fitbit) have joined together to encounter Apple Watch.
3.2 SWOT Analysis
• Strengths
According to Forbes, Apple is the world's most valuable brand in 2020. [12] Undoubtedly, Apple has significant brand awareness and market influence, and these competitive advantages are based on Apple's widely praised product quality. Apple also has excellent marketing strategies to stimulate consumers' purchase desires which is one of the important components of its success. Apple has top tier R&D department designing processers, which ensured Apple products have great experience.
• Weaknesses
The high R&D expenditures every year may cause some profit risks, and some projects do not have any output. [13] Hence, if the product cannot be accepted by the market, Apple will have huge sunk costs and a financial crisis.
• Opportunity
The excellent brand effect, marketing strategy, and product quality could provide Apple with more opportunities in the future market. The target customer will increase consistently by providing customers with excellent products. Also, due to the high cost of modems from Qualcomm, Apple is trying to develop modems that will decrease the costs. [14] Apple car project is under development, and Apple AR project might revolutionize smartphone industry. [15]
• Threats
Apple specialized in smartphones, personal computers, tablets, wearables, and accessories. This increases competitors in different industries for Apple. With the progression of technology, the competition become more intense. Apple needs to introduce new and innovative technology to stay ahead of other competitors. Other technology companies are rapidly developing processing chips. And operating system companies are also upgrading features and functions. Two huge advantages of Apple are under threats by different companies.
3.3 Value chain
• Inbound Logistics:
Apple sources their high-quality materials from different countries, such as America, China and European countries. There raw materials are assembled by Foxconn in China. [16] Suppliers directly send parts to Foxconn and finish manufacture process. Apple has one intermediate warehouse via UPS or FedEx, and there is a warehouse facility in California. [17] Intermediate warehouse responsible for order place on the online store. Apple is well known for its high efficiency supply chain practices. Apple uses methods like shrinking packaging size and advanced warehouse software to further improve efficiency.
Apple’s strong bargaining power with its suppliers ensured cost advantage when sourcing materials.
• Operations:
Apple prefers to outsource manufacturing of its hardware to other companies in China or other Asian countries. Because Apple does not have any manufacturing facilities. Also, the labour cost in Asian countries is much lower which could reduce the manufacturing cost. This gives Apple advantage to only focus on design better products. And Apple has long history work with Foxconn, the operation ran smoothly in pass decades.
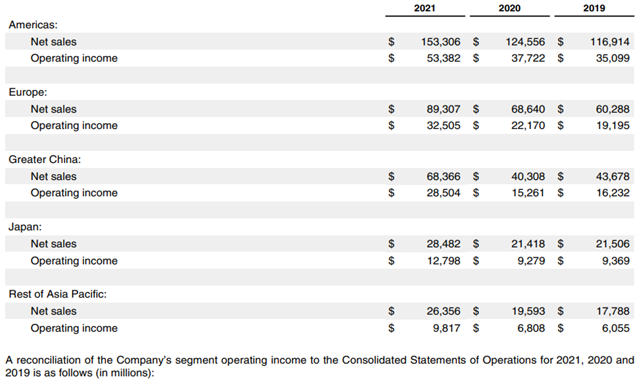
Fig. 1. From Apple’s Annual Report
Comparing operating income between 2021 and 2022, all five segments show increase profits.
• Outbound logistics:
Apple opened their Apple store at high traffic areas and good quality shopping malls, the company normally distribute their products to their Apple store and deliver their products to their cooperative wholesalers and retailers. Because technology products usually have short product life cycles. Apple tries to keep low inventory in their warehouses after initial launch of the product Retailers and wholesalers also keep amount of Apple products. E-commerce is considerably more effective than sales via stores, in terms of size of e-commerce business. China has additional source of value for Apple, due to manufacture facility located in China. This results to reduced expenditure from outbound logistics point of view.
• Marketing and Sales:
There are seven major sales channels:
1. Apple retail stores
2. Apple online store
3. Direct sales force
4. Third-party cellular network carriers
5. Wholesalers
6. Retailers
7. Value-added resellers
Apple is also focusing on enterprise sales recent years, also giving business with their employees some promotion to purchase Apple’s products.
• Service:
Apple has exceptional customer services. Before purchasing, the company has Apple experience centres in most cities where people could have a comfortable environment to experience Apple’s products and the quality of their products. During purchasing, Apple sales assistants are well trained and most of them are young males and females in the Apple store. They are also patient, happy to introduce the products and teach you some easy understand technology knowledge. After purchasing, Apple offers Apple care to their products and products can be returned within 14 days after the purchase. In some countries, Apple offers iPhone trade-in programs that allow iPhone users to upgrade their phone to newer models with additional payment. When something wrong with Apple’s products, customers always could go to Apple store looking for help.
• Procurement:
Apple has some good relationships with their suppliers who have less bargaining power to Apple. However, for some suppliers who has more bargaining power to Apple such as Qualcomm Technologies who provides base band chips for Apple, they do not have much good relationships with each other.
• Technology Development:
Apple is well known as innovative design and products. Apple invests lots of money in the Research and Development departments to give their customers better services and experiences. Apple focus on design product and developing software. And manufacture development is pushed by suppliers’ Research and Development departments.
• Human Resources:
Apple focus on hiring people have passion with the company and what they do, Apple pays them well and offers good training program. Employees have special deal when purchasing Apple products.
• Firm Infrastructure:
Apple has perfect infrastructure which driving to company’s success. Apple spent huge amount of money building Apple Park to further improve its infrastructure. [18] Apple Stores around the globe are also well build. This ensured its employees have good facilities design or sell Apple products.
4 Conclusion
Apple’s success is driven by good brand awareness and strong bargaining with suppliers. Apple and other companies can focus more on marketing and relationship between them and suppliers. And study shows the strength and the weakness of Apple. The technology industry shift rapidly, other threats may have effect on the industry. In future study, more factors can be taken into consideration.
References
[1]. Apple Inc. ANNUAL REPORT PURSUANT TO SECTION 13 OR 15(d) OF THE SECURITIES EXCHANGE ACT OF 1934. pp:1-3,2021 https://investor.apple.com/investor-relations/default.aspx, last accessed 2022/06/24.
[2]. Forbes. The World’s Most Valuable Brands. https://www.forbes.com/powerful-brands/list/, 2020, last accessed 2022/06/24.
[3]. Apple Inc. ANNUAL REPORT PURSUANT TO SECTION 13 OR 15(d) OF THE SECURITIES EXCHANGE ACT OF 1934. pp:1-2,2021 https://investor.apple.com/investor-relations/default.aspx, last accessed 2022/06/24.
[4]. Bankmycell, HOW MANY SMARTPHONES ARE IN THE WORLD? https://www.bankmycell.com/blog/how-many-phones-are-in-the-world, last accessed 2022/06/24.
[5]. Needham, M.: Smartphone Shipments to Grow 5.5% in 2021 Driven by Strong 5G Push and Pent-up Demand, according to IDC, https://www.idc.com/getdoc.jsp?containerId=prUS47523321, 2021, last accessed 2022/06/24.
[6]. Apple Homepage, https://www.apple.com/, last accessed 2022/06/24.
[7]. Statista, Smartphones - Statistics & Facts. https://www.statista.com/topics/840/smartphones/#topicHeader__wrapper, 2022, last accessed 2022/06/24.
[8]. Statista, Personal computer (PC) vendor shipment share worldwide from 2011 to 2022, by quarter. https://www.statista.com/statistics/269703/global-market-share-held-by-pc-vendors-since-the-1st-quarter-2009/, 2022, last accessed 2022/06/25.
[9]. Counterpoint, Infographic: 2021 | Smartwatch, https://www.counterpointresearch.com/zh-hans/infographic-smartwatch-2021/, 2022, last accessed 2022/06/25.
[10]. Statista, Market share of the leading true wireless stereo (TWS) vendors as of 2nd quarter 2021, https://www.statista.com/statistics/1105407/leading-tws-vendors/, last accessed 2022/06/25.
[11]. Statista, Personal computer (PC) vendor shipment share worldwide from 2011 to 2022, by quarter, 2022, https://www.statista.com/statistics/269703/global-market-share-held-by-pc-vendors-since-the-1st-quarter-2009/, last accessed 2022/07/01.
[12]. Forbes. The World’s Most Valuable Brands. https://www.forbes.com/powerful-brands/list/, 2020, last accessed 2022/06/24.
[13]. Apple Inc. ANNUAL REPORT PURSUANT TO SECTION 13 OR 15(d) OF THE SECURITIES EXCHANGE ACT OF 1934. pp:23,2021 https://investor.apple.com/investor-relations/default.aspx, last accessed 2022/07/02.
[14]. Kaur D. Apple: Bye Qualcomm, hello TSMC? https://techwireasia.com/2021/12/apple-dodges-qualcomm-to-join-hands-with-tsmc-for-custom-iphone-5g-modems/, (2021), last accessed 2022/07/02
[15]. AppleInsider, Apple Car, https://appleinsider.com/inside/apple-car, last accessed 2022/07/03
[16]. Supplier List, pp:2-17, (2020)
[17]. DynamicInventory, A Look at Apple’s Supply Chain Management, https://www.dynamicinventory.net/apple-best-supply-chain-management-company/, 2018, last accessed 2022/07/03.
[18]. Miller, C., Apple Park valued at over $4 billion, making it one of the world’s most expensive buildings, https://9to5mac.com/2019/07/13/apple-park-value/, last accessed 2022/07/03.
Cite this article
Li,M. (2023). Five-Force Analysis, SWOT Analysis, Value Chain Analysis of Apple in Technology Industry. Advances in Economics, Management and Political Sciences,4,511-516.
Data availability
The datasets used and/or analyzed during the current study will be available from the authors upon reasonable request.
Disclaimer/Publisher's Note
The statements, opinions and data contained in all publications are solely those of the individual author(s) and contributor(s) and not of EWA Publishing and/or the editor(s). EWA Publishing and/or the editor(s) disclaim responsibility for any injury to people or property resulting from any ideas, methods, instructions or products referred to in the content.
About volume
Volume title: Proceedings of the 6th International Conference on Economic Management and Green Development (ICEMGD 2022), Part Ⅱ
© 2024 by the author(s). Licensee EWA Publishing, Oxford, UK. This article is an open access article distributed under the terms and
conditions of the Creative Commons Attribution (CC BY) license. Authors who
publish this series agree to the following terms:
1. Authors retain copyright and grant the series right of first publication with the work simultaneously licensed under a Creative Commons
Attribution License that allows others to share the work with an acknowledgment of the work's authorship and initial publication in this
series.
2. Authors are able to enter into separate, additional contractual arrangements for the non-exclusive distribution of the series's published
version of the work (e.g., post it to an institutional repository or publish it in a book), with an acknowledgment of its initial
publication in this series.
3. Authors are permitted and encouraged to post their work online (e.g., in institutional repositories or on their website) prior to and
during the submission process, as it can lead to productive exchanges, as well as earlier and greater citation of published work (See
Open access policy for details).
References
[1]. Apple Inc. ANNUAL REPORT PURSUANT TO SECTION 13 OR 15(d) OF THE SECURITIES EXCHANGE ACT OF 1934. pp:1-3,2021 https://investor.apple.com/investor-relations/default.aspx, last accessed 2022/06/24.
[2]. Forbes. The World’s Most Valuable Brands. https://www.forbes.com/powerful-brands/list/, 2020, last accessed 2022/06/24.
[3]. Apple Inc. ANNUAL REPORT PURSUANT TO SECTION 13 OR 15(d) OF THE SECURITIES EXCHANGE ACT OF 1934. pp:1-2,2021 https://investor.apple.com/investor-relations/default.aspx, last accessed 2022/06/24.
[4]. Bankmycell, HOW MANY SMARTPHONES ARE IN THE WORLD? https://www.bankmycell.com/blog/how-many-phones-are-in-the-world, last accessed 2022/06/24.
[5]. Needham, M.: Smartphone Shipments to Grow 5.5% in 2021 Driven by Strong 5G Push and Pent-up Demand, according to IDC, https://www.idc.com/getdoc.jsp?containerId=prUS47523321, 2021, last accessed 2022/06/24.
[6]. Apple Homepage, https://www.apple.com/, last accessed 2022/06/24.
[7]. Statista, Smartphones - Statistics & Facts. https://www.statista.com/topics/840/smartphones/#topicHeader__wrapper, 2022, last accessed 2022/06/24.
[8]. Statista, Personal computer (PC) vendor shipment share worldwide from 2011 to 2022, by quarter. https://www.statista.com/statistics/269703/global-market-share-held-by-pc-vendors-since-the-1st-quarter-2009/, 2022, last accessed 2022/06/25.
[9]. Counterpoint, Infographic: 2021 | Smartwatch, https://www.counterpointresearch.com/zh-hans/infographic-smartwatch-2021/, 2022, last accessed 2022/06/25.
[10]. Statista, Market share of the leading true wireless stereo (TWS) vendors as of 2nd quarter 2021, https://www.statista.com/statistics/1105407/leading-tws-vendors/, last accessed 2022/06/25.
[11]. Statista, Personal computer (PC) vendor shipment share worldwide from 2011 to 2022, by quarter, 2022, https://www.statista.com/statistics/269703/global-market-share-held-by-pc-vendors-since-the-1st-quarter-2009/, last accessed 2022/07/01.
[12]. Forbes. The World’s Most Valuable Brands. https://www.forbes.com/powerful-brands/list/, 2020, last accessed 2022/06/24.
[13]. Apple Inc. ANNUAL REPORT PURSUANT TO SECTION 13 OR 15(d) OF THE SECURITIES EXCHANGE ACT OF 1934. pp:23,2021 https://investor.apple.com/investor-relations/default.aspx, last accessed 2022/07/02.
[14]. Kaur D. Apple: Bye Qualcomm, hello TSMC? https://techwireasia.com/2021/12/apple-dodges-qualcomm-to-join-hands-with-tsmc-for-custom-iphone-5g-modems/, (2021), last accessed 2022/07/02
[15]. AppleInsider, Apple Car, https://appleinsider.com/inside/apple-car, last accessed 2022/07/03
[16]. Supplier List, pp:2-17, (2020)
[17]. DynamicInventory, A Look at Apple’s Supply Chain Management, https://www.dynamicinventory.net/apple-best-supply-chain-management-company/, 2018, last accessed 2022/07/03.
[18]. Miller, C., Apple Park valued at over $4 billion, making it one of the world’s most expensive buildings, https://9to5mac.com/2019/07/13/apple-park-value/, last accessed 2022/07/03.