


1. Introduction
NHS (national healthcare service) is one of the world’s largest and most complete national healthcare systems. It is responsible for providing publicly funded healthcare for all citizens and foreign residents in the United Kingdom. Unlike public health systems in other countries, NHS provides completely free healthcare services. As a result, the UK government spends high government spending on NHS every year. In fact, the UK government has always been increasing its spending on NHS since its establishment.
COVID-19 is a type of coronavirus with high transmission rates. When the COVID-19 pandemic first hit the UK at the start of 2020, it soon infected over 2.3 million people in just one year. In 2021, which is at the height of the COVID-19 pandemic, there were about 30,000 new people got infected every day [1]. In that year, the UK government spent over £276.6 billion on its national healthcare which accounts for 26.1% of the government expenditure that year [2, 3].
The UK government's high spending on NHS is controversial to many. On one hand, the high government spending on NHS has brought great benefits to the local people in the UK and directly helped the economic recovery from the recession under the pandemic. However, on the other hand, the high spending led to an increase in the UK government's budget deficit and also resulted in an inefficient allocation of medical resources to some extent. This paper is aimed to evaluate the effectiveness of the British government's high spending on NHS from an economic perspective with the help of online databases, basic economic theories, and case studies, thus coming out with potential policies to level up the effectiveness of NHS.
The remaining sections of the paper are arranged as the following: Section 2 discusses NHS's negative impacts on UK's economy including budget deficit and market inefficiency; Section 3 analyses NHS's positive impacts on UK's economy from welfare economics and the impact on aggregate demand respectively; Section 4 gives overall conclusion and proposes potential policies to improve the current system.
2. Negative Effects
2.1. Budget Deficit
2.1.1. A Spike in National Debt
Under the COVID-19 pandemic, UK's economy fell into recession. Since the economy operates as a circular flow of money, the government's revenue from taxation fell as citizens’ income, companies’ revenue, etc. fell automatically. Meanwhile, the UK government increased its government spending, especially on the healthcare system. Increased government spending combined with the decreased revenue caused UK's government to experience a high budget deficit and a large increase in national debt.
Table 1: UK government gross debt.
Financial year ending March | 2016 | 2017 | 2018 | 2019 | 2020 | 2021 |
Debt (£bn) | 1651.0 | 1719.8 | 1763.2 | 1820.6 | 1875.7 | 2223.0 |
Debt (as % GDP) | 84.5 | 84.3 | 83.5 | 82.8 | 83.0 | 103.7 |
Data source: Gov.UK [4]
As Table 1 has shown, the UK government’s national debt has always been kept at a relatively stable level from 2016 to 2020, with less than 1% of change every year in terms of debt-to-GDP ratio. In contrast, in 2021, the UK government's national debt spiked from £1875.7 billion to £2223.0 billion, with a 20% increase in debt-to-GDP ratio. In 2021, the UK government's budget deficit (please see Table 2) which is the increase in national debt is £327.6 billion; it is about 5 times larger than the previous year's budget deficit. All the above statistics show that the UK government has experienced a significant increase in budget deficit and national debt during the height of the COVID-19 pandemic.
Table 2: General government deficit.
Financial year ending March | 2016 | 2017 | 2018 | 2019 | 2020 | 2021 |
Deficit (£bn) | 83.1 | 55.6 | 55.1 | 39.1 | 59.4 | 327.6 |
Deficit (as % GDP) | 4.3 | 2.7 | 2.6 | 1.8 | 2.6 | 15.3 |
Data source: Gov.UK [4]
2.1.2. The Impact of High Government Spending on NHS
To what extent has the high government spending on NHS contributed to the high budget deficit in 2021? In 2021, the UK government spent over £276.6 billion on healthcare, which accounts for 26.1% of the total government spending and 84.4% of the budget deficit [2-4]. The increase of government spending on NHS from 2020 to 2021 is £19.1 billion which is 5.8% of the budget deficit. This shows that the high government spending on NHS occupies a large percentage of the budget deficit, and the government's decision of increasing spending on NHS during the pandemic has a noticeable impact on the increase in the national debt.
2.1.3. Costs of the Budget Deficit
There are several costs of the high government budget deficit. The first, also the most direct cost is the high debt interests that the UK government has to pay back. “Spending on debt interest accounted for around 5% of government spending since 1990/91. [5]” Although it is hard to estimate the exact amount of debt interest in the next few years, the debt interest will only be higher than that due to the significant increase in the national debt in 2021. This implies that in future years, government spending on the public sector will be reduced due to the current high budget deficit. This slows down economic growth and reduces welfare in the future.
|
Figure 1: Effective Interest Rates on Individual Loans. |
Data source: Bank of England [6] |
Photo credit: Bank of England [6] https://edu.bankofengland.co.uk/statistics/effective-interest-rates/2021/december-2021 |
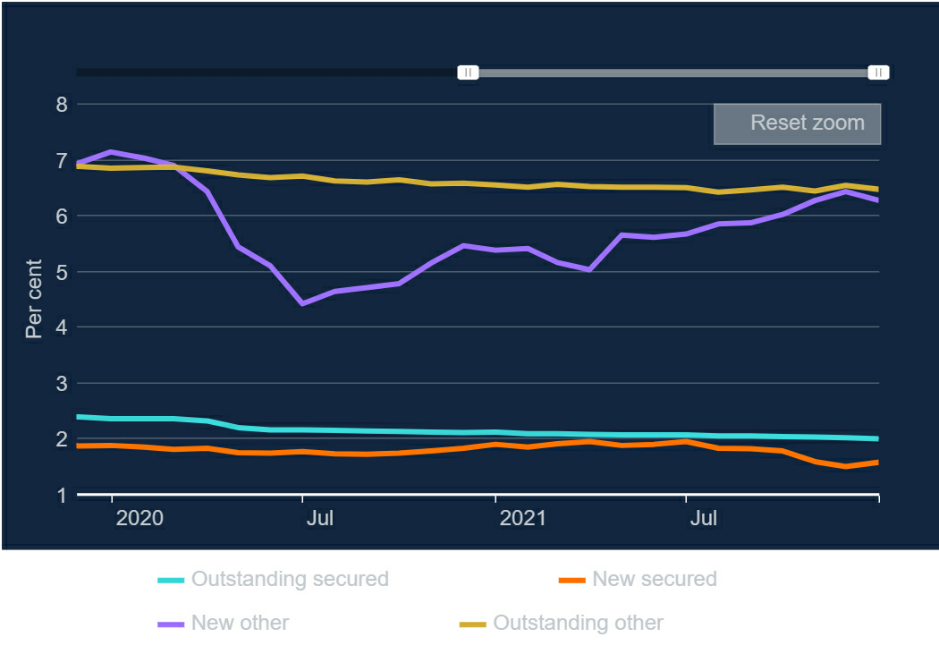
The second potential cost of the budget deficit is the crowding-out effect. The UK government borrowing more money increases the demand in the domestic loanable funds market. In theory, the interest rate will be pulled up and causes a decrease in private investment thus decreasing aggregate demand and national output.
Figure 1 shows that the interest rate of New other loans fell rapidly at the start of 2020 and slowly increased back to its initial position over the next year. The rapid fall in the interest rate might be due to the fall in demand for loans when the pandemic first hit the UK and companies became afraid to invest. Then, the increase in interest can be explained by the increase in the government's demand for loans as the government started to increase government spending. Therefore, the increase in government borrowing did have an impact on interest rates. However, the crowding out effect might be insignificant due to the general low business confidence in the recession. Under the COVID-19 pandemic, firms, in general, were afraid to invest due to the uncertainty brought by the pandemic; this means that firms were irresponsive to the change in interest rates. Thus, the amount of investment that was crowded out was negligible. Also, here government borrowing acted to stabilize the demand in the loanable funds market thus stabilizing the interest rate. In that sense, the crowding-out effect might not be a bad thing.
The third potential cost of the high budget deficit is the fall in the UK government's credibility. As the national debt rose to 103.7% of the country’s GDP, the UK government could not pay back the debt on time [4]. In October 2022, three financial agencies, Moody’s, Fitch, and S&P had given the UK government debt a negative outlook in terms of credit rating [7]. Credit rating is commonly used by investors to determine the worthiness of investing in a country’s financial assets. The decrease in credit rating will decrease the demand for UK government bonds thus increasing the interest rate and government's cost of borrowing. This is especially unhealthy for the country's long-term economic growth since most countries rely on stable deficit spending to stimulate the economy.
2.2. Market Inefficiency
2.2.1. Tragedy of the Common
The overuse of medical resources has always been a major problem of the NHS. Since all healthcare services are free to all UK citizens, healthcare-related resources and services are non-excludable; since NHS can only provide healthcare service to a limited number of people at a time, the service is rivalrous. Thus, the resources and services that NHS provides are more like common goods rather than public goods. Therefore, the tragedy of the commons happens in which individuals overuse the resources and negatively affect other people’s use of the resources. People abuse the current medical system as they frequently go to the hospital for unnecessary medical examinations and unnecessary treatment. One common example is that patients with nonurgent conditions present to the Emergency Department. It is found that 46% of those patients think they might need a radiograph and 29% of those patients believe General Practitioners would be unable to help [8]. This causes long queues in Emergency Department and affects the normal use of medical resources for real emergency patients. Such a problem can be greatly reduced if presenting to Emergency Department charges an extra fee. Since NHS offers all healthcare services for free, there is no difference between attending to ED and attending to GP in terms of financial costs for the patients. Thus, the patients often demand more than what they actually need. The situation can be understood as a deviation of the market demand curve for medical resources from the actual utility curve. Thus, medical resources in the UK are allocated inefficiently. The problem is particularly significant when medical resources became scarcer during the COVID-19 pandemic.
Under the pandemic, “The NHS has been falling behind the target that 95 percent of patients should be seen within four hours of arrival.” [2] This shows that queueing problem in NHS became more severe during the pandemic, thus implying an increase in the rivalrousness of medical resources. Therefore, the tragedy of the commons of the NHS is a more severe problem during the pandemic.
2.2.2. Overtreatment of Patients
Overtreatment refers to the NHS giving patients excess and unnecessary medical treatment, violating the clinical medical norms and ethical guidelines, and failing to truly improve the health condition of the patients. It causes the overconsumption of medical resources and even negative impacts on the patients. The problem is particularly severe back in 2013 when the Academy of Medical Royal claimed that over £2 billion in medical resources were wasted every year due to overtreatment [9]. This mainly includes giving patients excess and unnecessary X-rays, drugs and treatment, and the cost of adverse drug reaction treatment. The situation can be understood as a supply-side problem. NHS, as a publicly funded system offering non-profit services, managers of the system lack incentives to minimize the cost of healthcare services compared to privately owned hospitals. This causes productive inefficiency. Meanwhile, negative externality rises as overtreatment causes adverse impacts on the patients. Thus, the market equilibrium deviates from the social optimum, causing allocative inefficiency. Under the COVID-19 pandemic, the problem had a particularly adverse impact since the waste of medical resources made the already scarce medical resources worse. Unlike the tragedy of the common, such problem can be reduced over time as the government sets stricter guidelines for effective treatment.
3. Positive Effects
3.1. Welfare Economics
3.1.1. Living Standards
The high government spending on NHS largely improves national health in the UK which is a main part of the standard of living that is measured in welfare economics. One direct indicator of the standard of living in terms of national health is life expectancy. The UK is currently (2023) one of the top countries in average life expectancy. It ranks 29th out of 193 countries that are being counted with an average life expectancy of 81.77 [8]. It is only 3.5 years behind the top one country on the list [10].
To what extent does the high government spending on NHS relate to the high life expectancy in the UK? To investigate the problem, the paper uses life expectancy data from U.K. Life Expectancy 1950-2023 | MacroTrends and government spending data from Healthcare expenditure UK 1997-2021 | Statista to examine the relationship between government spending on NHS and life expectancy in the UK. The following table 3 is obtained by combining the data from the two sources.
Table 3: Government spending on NHS and average life expectancy in the UK from 2000 to 2021.
Year | Government spending on NHS (in bn) | Life Expectancy (year) |
2000 | 78.9 | 77.67 |
2001 | 86.1 | 77.91 |
2002 | 94.3 | 78.16 |
2003 | 101.9 | 78.41 |
2004 | 110.5 | 78.67 |
2005 | 117.6 | 78.92 |
2006 | 126.6 | 79.18 |
2007 | 135.8 | 79.43 |
2008 | 144.1 | 79.69 |
2009 | 153 | 79.93 |
2010 | 160.4 | 80.16 |
2011 | 165.5 | 80.4 |
2012 | 170.9 | 80.63 |
2013 | 176.4 | 80.87 |
2014 | 184.3 | 80.93 |
2015 | 188.7 | 80.98 |
2016 | 195.5 | 81.04 |
2017 | 201 | 81.09 |
2018 | 210 | 81.15 |
2019 | 222.7 | 81.27 |
2020 | 257.5 | 81.4 |
2021 | 276.6 | 81.52 |
Data source: Statista [2], Macrotrend [11] | ||
Then, Figure 2 is obtained by plotting each corresponding point of life expectancy against government spending on NHS. The two sets of data are comparable since they correspond to the same set of time periods. The graph is valid to show a trend because the time durations between all data points are equal. (Both government spending and life expectancy are strictly increasing with the variation of time and both data are measured once a year)
|
Figure 2: Life expectancy against government spending on NHS graph. |
Data source: Statista [2], Macrotrend [11] |
Photo credit: Original |
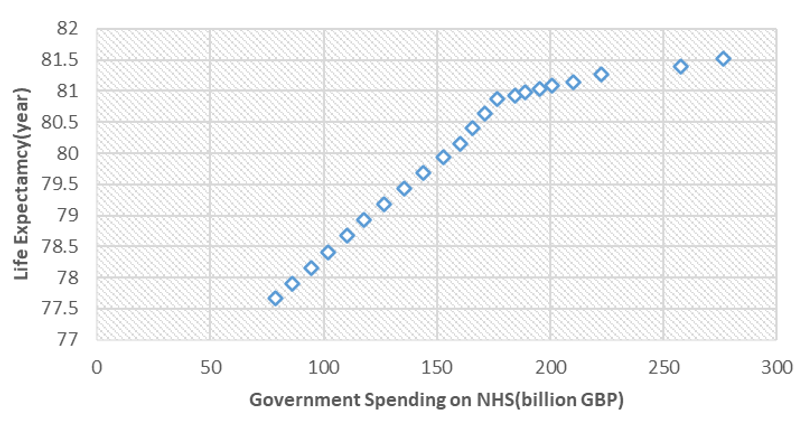
Figure 2 is then modeled into a function through regression tests. After trying various models, the quadratic function turns out to be the most fitting model for the data with the R2 of 0.991 which indicates a strong positive correlation between government spending on NHS and life expectancy in the UK (Figure 3 shows the result).
|
Figure 3: Life expectancy against government spending on NHS graph with regression test. |
Data source: Statista [2], Macrotrend [11] |
Photo credit: Original |

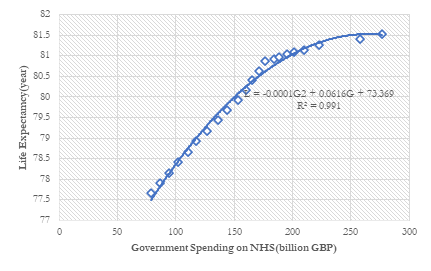
The function that models the relationship between government spending on NHS and average life expectancy in the UK is given by L = -0.0001G2 + 0.0616G + 73.369, where L is defined as the average life expectancy in UK and G is defined as the government spending on NHS in one fiscal year. The function that shows the relationship between the change in government spending and the change in life expectancy is thus given by dL/dG=-0.0002G+0.0616. The function is strictly decreasing within the domain of the data. This shows that the effect of government spending on life expectancy keeps decreasing. dL/dG|G=276.6=0.00628, meaning currently the rate of change of life expectancy with government spending is 0.00628 years per billion GBP. In other words, the government has to increase its spending on NHS by 57.6% for an additional increase in average life expectancy by one year, which is way too costly. The result makes sense since the increase in government spending on NHS mainly increases the quantity but not the quality of healthcare services. As most people in the UK already get enough medical treatment that the current technology can offer, the marginal utility of the spending decreases. Therefore, the UK government may want to decrease its additional annual investment in NHS unless there is a huge technological development in medicine.
3.1.2. Equity
NHS’s free healthcare service indirectly reduces income inequality. The average healthcare that a UK citizen consumed in 2021 can be calculated by the per capita healthcare expenditure in 2021, which is £276.6 billion/67 million=£4128 per citizen [2, 12]. If healthcare is not free, the burden would fall heavily on low-income earners as the consumption of necessities occupies a large percentage of their disposable income. Under NHS, healthcare is “free”, but the citizens do pay taxes for it. Like most countries in the world, the UK government uses progressive taxation, meaning citizens with higher incomes need to pay a higher percentage of tax. This implies that the implicit money that all citizens pay for healthcare is different. Low-income earners pay less for healthcare, thus leading to the proportion of income spent on necessities being less spread for different income earners. This indicates a promotion in equity. Under the pandemic, the impact is more significant since healthcare is more of a necessity.
3.2. Impact on Aggregate Demand
The increase in government spending on NHS has a direct impact on the aggregate demand of the UK's economy. In 2021, the UK government has increased its spending on NHS by £19.9 billion [2]. However, the impact on the aggregate demand is more than £19.9 billion due to the multiplier effect. The multiplier effect state that an increase in government spending will induce a further increase in consumption thus leading to a further increase in aggregate demand. The multiplier, or the factor by which the overall increase in total output is greater than the initial change in government spending, is calculated by 1/(1-MPC). MPC stands for marginal propensity to consume. It represents the proportion of any additional income earned that is consumed on domestically produced goods and services. The effectiveness of expansionary fiscal policy largely depends on the multiplier since the spending that a government can afford is usually little compared to national output. However, MPC is usually low in a recession. Households are often afraid to spend their income in recession due to the uncertainty of their future employment condition. According to the survey conducted by the Bank of England in 2020 and 2021, the average elicited MPC under the pandemic is only 11% [13]. This means the multiplier is only 1/ (1-0.11) =1.124 and the impact on the economy is only £19.9 times 1.124=£22.4 billion, which accounts for only 0.7% of that year’s GDP [14]. Thus, the impact of the increase in government spending on national output is slim.
The crowding-out effect will not be discussed as section 2.1 has already explained.
4. Conclusion
The COVID-19 pandemic is a time when the economies of many countries have been hit hard. The UK government has largely increased its spending on NHS during the pandemic both as a way to ensure the living standards of their citizens and as an expansionary fiscal policy to help the economy to recover. To investigate whether the UK government had reached its goal thus giving potential policies for adjustment, this paper evaluates the pros and cons of the high government spending on NHS with the discussion of budget deficit, market inefficiency, welfare economics, and the impact on AD.
The result of the investigation shows that government spending on NHS did improve the standard of living in terms of life expectancy. However, such an impact will only be smaller as the government spends more money due to the limitation of current technology. Thus, the government is suggested to shift its focus from the purchase of medical resources to investment in the research and development of healthcare.
In terms of economic recovery, government spending on NHS has little impact on the economy due to the relatively small multiplier under COVID-19. Meanwhile, the potential risks of the high budget deficit imply that the government spending on NHS might not be worth it if it could not stimulate significant economic growth. The government may want to wait for the MPC to increase in order to achieve a greater multiplier effect or just simply use monetary policy as an alternative as it does not have the costs of the budget deficit.
Meanwhile, the tragedy of the common and overtreatment as the long-standing problems of NHS are also discussed in the paper. It is suggested that the government improves the guidelines for medical treatment as soon as possible and punish those who abuse medical resources.
References
[1]. Gov.UK (2023) Coronavirus (COVID-19) in the UK. https://coronavirus.data.gov.uk/details/cases?areaType=overview&areaName=United%20Kingdom
[2]. Statista (2022) Total healthcare expenditure in the United Kingdom from 2000 to 2021. https://www.statista.com/statistics/317669/healthcare-expenditure-in-the-united-kingdom/
[3]. Statista (2022) Total managed expenditure of the government of the United Kingdom from 1981/82 to 2024/25. https://www.statista.com/statistics/298465/government-spending-uk/
[4]. Gov.UK (2022) UK government debt and deficit: September 2022. https://www.ons.gov.uk/economy/governmentpublicsectorandtaxes/publicspending/bulletins/ukgovernmentdebtanddeficitforeurostatmaast/september2021
[5]. Mathew Keep (2023) The budget deficit: A short guide. https://commonslibrary.parliament.uk/research-briefings/sn06167/#What%20Is%20The%20Budget%20Deficit%20and%20How%20Big%20Is%20It?
[6]. Bank of England (2022) Effective interest rates-December 2021. https://edu.bankofengland.co.uk/statistics/effective-interest-rates/2021/december-2021
[7]. Trading Economics (2023) United Kingdom-Credit Rating. https://tradingeconomics.com/united-kingdom/rating
[8]. Robert Atenstaedt, Jayne Gregory, Carole Price-Jones, Jill Newman, Lyn Roberts, Jim Turner (2015) Why do patients with nonurgent conditions present to the Emergency Department despite the availability of alternative services? https://pubmed.ncbi.nlm.nih.gov/25405462/
[9]. Denis Campbell (2014) NHS wastes over £2bn a year on unnecessary or expensive treatments. https://www.theguardian.com/society/2014/nov/05/nhs-wastes-over-2-bn-on-unnecessary-treatment
[10]. Worldometers (2023) Life Expectancy of the World Population. https://www.worldometers.info/demographics/life-expectancy/
[11]. Macrotrend (2023) U.K. Life Expectancy 1950-2023. https://www.macrotrends.net/countries/GBR/united-ki ngdom/life-expectancy
[12]. Statista (2022) Population of the United Kingdom from 1871 to 2021. https://www.statista.com/statistics/281296/uk-population/#:~:text=In%202021%2C%20the%20population%20of%20the%20United%20Kingdom,million%20since%20the%20start%20of%20the%20twenty-first%20century.
[13]. Bank of England (2022) Financial concerns and the marginal propensity to consume in Covid times: evidence from UK survey data. https://www.bankofengland.co.uk/-/media/boe/files/working-paper/2022/financial-concerns-and-the-marginal-propensity-to-consume-in-covid-times.pdf
[14]. Macrotrend (2023) U.K. GDP 1960-2023. https://www.macrotrends.net/countries/GBR/united-kingdom/gdp-gross-domestic-product
Cite this article
Jeremy,Y. (2023). Evaluation of the Effectiveness of NHS under the COVID-19 Pandemic. Advances in Economics, Management and Political Sciences,33,30-38.
Data availability
The datasets used and/or analyzed during the current study will be available from the authors upon reasonable request.
Disclaimer/Publisher's Note
The statements, opinions and data contained in all publications are solely those of the individual author(s) and contributor(s) and not of EWA Publishing and/or the editor(s). EWA Publishing and/or the editor(s) disclaim responsibility for any injury to people or property resulting from any ideas, methods, instructions or products referred to in the content.
About volume
Volume title: Proceedings of the 7th International Conference on Economic Management and Green Development
© 2024 by the author(s). Licensee EWA Publishing, Oxford, UK. This article is an open access article distributed under the terms and
conditions of the Creative Commons Attribution (CC BY) license. Authors who
publish this series agree to the following terms:
1. Authors retain copyright and grant the series right of first publication with the work simultaneously licensed under a Creative Commons
Attribution License that allows others to share the work with an acknowledgment of the work's authorship and initial publication in this
series.
2. Authors are able to enter into separate, additional contractual arrangements for the non-exclusive distribution of the series's published
version of the work (e.g., post it to an institutional repository or publish it in a book), with an acknowledgment of its initial
publication in this series.
3. Authors are permitted and encouraged to post their work online (e.g., in institutional repositories or on their website) prior to and
during the submission process, as it can lead to productive exchanges, as well as earlier and greater citation of published work (See
Open access policy for details).
References
[1]. Gov.UK (2023) Coronavirus (COVID-19) in the UK. https://coronavirus.data.gov.uk/details/cases?areaType=overview&areaName=United%20Kingdom
[2]. Statista (2022) Total healthcare expenditure in the United Kingdom from 2000 to 2021. https://www.statista.com/statistics/317669/healthcare-expenditure-in-the-united-kingdom/
[3]. Statista (2022) Total managed expenditure of the government of the United Kingdom from 1981/82 to 2024/25. https://www.statista.com/statistics/298465/government-spending-uk/
[4]. Gov.UK (2022) UK government debt and deficit: September 2022. https://www.ons.gov.uk/economy/governmentpublicsectorandtaxes/publicspending/bulletins/ukgovernmentdebtanddeficitforeurostatmaast/september2021
[5]. Mathew Keep (2023) The budget deficit: A short guide. https://commonslibrary.parliament.uk/research-briefings/sn06167/#What%20Is%20The%20Budget%20Deficit%20and%20How%20Big%20Is%20It?
[6]. Bank of England (2022) Effective interest rates-December 2021. https://edu.bankofengland.co.uk/statistics/effective-interest-rates/2021/december-2021
[7]. Trading Economics (2023) United Kingdom-Credit Rating. https://tradingeconomics.com/united-kingdom/rating
[8]. Robert Atenstaedt, Jayne Gregory, Carole Price-Jones, Jill Newman, Lyn Roberts, Jim Turner (2015) Why do patients with nonurgent conditions present to the Emergency Department despite the availability of alternative services? https://pubmed.ncbi.nlm.nih.gov/25405462/
[9]. Denis Campbell (2014) NHS wastes over £2bn a year on unnecessary or expensive treatments. https://www.theguardian.com/society/2014/nov/05/nhs-wastes-over-2-bn-on-unnecessary-treatment
[10]. Worldometers (2023) Life Expectancy of the World Population. https://www.worldometers.info/demographics/life-expectancy/
[11]. Macrotrend (2023) U.K. Life Expectancy 1950-2023. https://www.macrotrends.net/countries/GBR/united-ki ngdom/life-expectancy
[12]. Statista (2022) Population of the United Kingdom from 1871 to 2021. https://www.statista.com/statistics/281296/uk-population/#:~:text=In%202021%2C%20the%20population%20of%20the%20United%20Kingdom,million%20since%20the%20start%20of%20the%20twenty-first%20century.
[13]. Bank of England (2022) Financial concerns and the marginal propensity to consume in Covid times: evidence from UK survey data. https://www.bankofengland.co.uk/-/media/boe/files/working-paper/2022/financial-concerns-and-the-marginal-propensity-to-consume-in-covid-times.pdf
[14]. Macrotrend (2023) U.K. GDP 1960-2023. https://www.macrotrends.net/countries/GBR/united-kingdom/gdp-gross-domestic-product