


1. Introduction
1.1. Background
Air travel is a vital part of modern society, connecting people and businesses across the world. However, despite the significant safety measures that are in place, air crashes still occur, resulting in devastating consequences for everyone involved. These incidents not only cause loss of life and injuries but also have a significant impact on the airline industry as a whole. The impact of air crashes on an airline company can be felt in various ways. Firstly, there is the financial cost of the incident, including the cost of compensating victims and their families, legal fees, and the cost of repairing or replacing damaged aircraft. Additionally, the negative publicity and reputational damage that follows such an incident can lead to a decline in passenger confidence, resulting in decreased demand for the airline's services.
In light of the significant impact of air crashes on the airline industry, it is crucial to understand the factors that contribute to such incidents and the steps that can be taken to prevent them. A thorough analysis of the impact of air crashes on an airline company can provide valuable insights into how to improve safety measures, restore public confidence, and minimize the negative consequences of such incidents.
1.2. Related Research
Over the past few years, the airline industry has placed an immense focus on achieving the critical objective of implementing Safety Management Systems to bolster the provision of safe service delivery. This goal has been deemed one of the most crucial and indispensable aspects of the industry, with a heightened emphasis placed on achieving it [1]. It is important to acknowledge that when aircraft accidents occur, they have the potential to significantly impact the public's perception regarding the safety of a particular type of aircraft. This is a matter that should be approached with great caution and concern, as it can have far-reaching consequences for both the aviation industry and the public [2]. In taking a closer look at the financial data of airlines, their overall health, safety violations, and the satisfaction levels of their employees, it appears that the economy may have a significant impact on aviation safety, specifically through the decisions made by management [3]. In 2014, two tragedies hit Malaysia Airlines, leading to significant damage to the company's reputation and finances. This harmed Malaysian tourism, and the share price response was swift and substantial. The carrier made sweeping changes, but passenger traffic declined rapidly, especially in Asian markets [4]. Despite the extensively high safety measures implemented in the aviation industry, it is still inevitable that aviation safety (AS) incidents occur from time to time. These occurrences can result in a multitude of undesirable consequences, such as fatalities, injuries, flight delays, aircraft damages, and even loss of reputation for the airline company [5]. The findings of the study suggest that there is a significant increase in the level of share price volatility after aviation disasters occur. Additionally, the cumulative abnormal returns of the examined companies demonstrate a noticeable decline in performance compared to their counterparts in global markets. This implies that aviation disasters have a detrimental impact on the financial stability of the affected firms [6]. In four specific instances, it was noted that the market response exhibited abnormal behaviour [7].
The study reveals a significant correlation between the accident propensity of air carriers and their profitability, whereby a negative relationship exists between the two variables [8]. The initial adverse response to tragic airplane accidents is substantial but only persists for a single complete business day following the incident [9]. This implies that investors and market participants tend to quickly recover from the impact of such unfortunate events, demonstrating resilience and adaptability in the face of adversity. However, it is worth noting that this conclusion is based on a thorough examination of the available data and statistical evidence, which supports the validity and reliability of the results. Therefore, it can be inferred that while the effects of fatal airline crashes may be severe in the short term, they do not have a lasting impact on the financial markets or the broader economy.
According to the research, they have created a comprehensive method for evaluating the degree of overlap in the market. They proceeded to perform a regression analysis, where they examined the individual non-crash-airline abnormal returns to this measure [10]. This paper also uses linear regression as one of the analyzing methods.
1.3. Framework
To sum up, to better study the impact of air disasters (uncontrollable factors) on airlines, this paper collected and analyzed multiple data on airlines related to air disasters. Firstly, the data sources were introduced, then the data analysis methods were interpreted in detail, and finally, the research results were analyzed and summarized.
2. Methodology
2.1. Source of Data
A dataset, from Investing.com, is used to analyze, to what extent the air crash would affect the companies’ sales. The data consists of 2 different but similar airline companies in China: Eastern Airline and Southern Airline.
This dataset consists of two columns, one is the date, and the other one is the stock before and after the Eastern Airlines flight crash happened for both airline companies. Both of these variables are relevant to this topic. It contains two categorical variables, one is to illustrate whether the data belongs to the company involved in the crash accident or not, and the other is to indicate whether the data is from before or after the accident happened.
2.2. Data Processing
The original dataset includes data from 2019-01-01 to 2023-03-17, in case to analyze the topic more accurately, since the aircraft happened on 2022-03-21, the final analysis contains data from 2021-09-05 to 2022-11-27 and the data is collected weekly. To make sure the trend is clear and reliable, the data is collected half a year(six months) before the month of the aircraft happened, to observe the further influence on the stock, the aircraft happened at the end of March, eight months’ data after the aircraft are taken to analyze.
The stock market is closed on Saturdays, Sundays and public holidays, so the data was omitted. This is consistent with the strategy of analyzing flight data because the purchase rate of air tickets will increase relatively during holidays or weekends, which will affect the sorting and analysis of the overall data. Therefore, the current analysis does not include data on statutory holidays and every weekend.
2.3. Machine Learning Models
In this paper, the Difference-in-Difference (DID) method is used to analyze the data, the shock is the Airplane Crash of the Eastern Airline Company. Furthermore, the data is divided into two groups: the treatment group, which is the data of the airline company involved in the crash(Eastern Airlines) and the control group, which is the data of the airline company not involved in it(Southern Airline). The data is divided into two slots in time: before and after the crash.
Regression analysis is also used to further analyze the data. Based on the variables included in the data, the regression formula is:
\( Y={α_{0}}+{α_{1}}{X_{1}}+{α_{2}}{X_{2}}+{α_{3}}{X_{3}}+ε \) (1)
Where Y is the company’s stock price, \( {X_{1}} \) represents whether the data belongs to the company involved in the crash accident, \( {X_{2}} \) represents whether the data is from before or after the crash, and \( {α_{3}} \) represents the impact of the crash on the stock price. The data belonging to the treatment group is assigned to \( {X_{1}} \) = 1, and vice versa.
The research procedures of this paper contain three main parts:
Step 1: Draw to check the smoothness of the data, visualization of data provides a clear and general graph for subsequent analysis, making it easier to observe the general trend and stability of data and ensuring that the data is reasonable and researchable. If the trend is smooth, the data is ready for the next analysis, if the trend is unstable, the data fluctuated greatly, which means using the average value is not suitable for keep analyzing it.
Step 2: Take the average value to see the change in the data before and after the shock, by analyzing the difference between the average values of the control group and the treatment group before and after the shock, we can intuitively see the impact of the event on the stocks of the two parties, to facilitate further analysis of the reasons for data changes. If the average difference after the shock is greater than that in before, the data pass the average test. However, if the average difference after the shock is smaller than that in before, the DID would be negative, which means that the shock has not made an influence on the treatment group, therefore the data can be concluded as a failed dataset since it is not meet the analysis requirements.
Step 3: Regression analysis, coefficient and p-value are obtained through regression analysis, to judge the extent of positive or negative impact brought by the occurrence of events, as well as the reliability of data.
2.4. Evaluation Metric
The objective of the DID method is to compare the differences between the treatment and control groups before and after the period of the air crash to discuss the influence of non-controllable factors(air crash) on airline stock price and product(flight tickets) sales. Control for unobserved heterogeneity: DID analysis helps control for unobserved heterogeneity that may affect the outcomes being studied. By comparing the treatment group with a control group that is similar in terms of observable characteristics, any difference in the outcome can be attributed to the treatment effect. Using DID analysis can help avoid selection bias, which occurs when the treatment and control groups differ systematically before the intervention, by comparing the change in outcomes over time in the treatment and control groups, DID analysis can also isolate the effect of the intervention from any pre-existing differences between the groups.
3. Results and Discussion
3.1. Data Visualization
3.1.1. Stationarity Test
This paper approaches several steps to address the stock price data.
The line chart of Eastern and Southern Airline Companies’ stock price change from 2021-09-05 to 2022-11-27 is plotted using Excel (Fig. 1) to check the parallel trend for DID analysis. Via the parallel trend assumption check which states that the treated (Eastern) and control group (Southern) would have followed the same trend in the absence of treatment, the risk of bias is reduced. In addition, conducting a parallel check can help to assess whether the assumption holds or not and whether any other confounding factors could bias the results. With the success of the parallel check, the validity of the DID assumptions and estimate of the treatment effect using different specifications are tested.
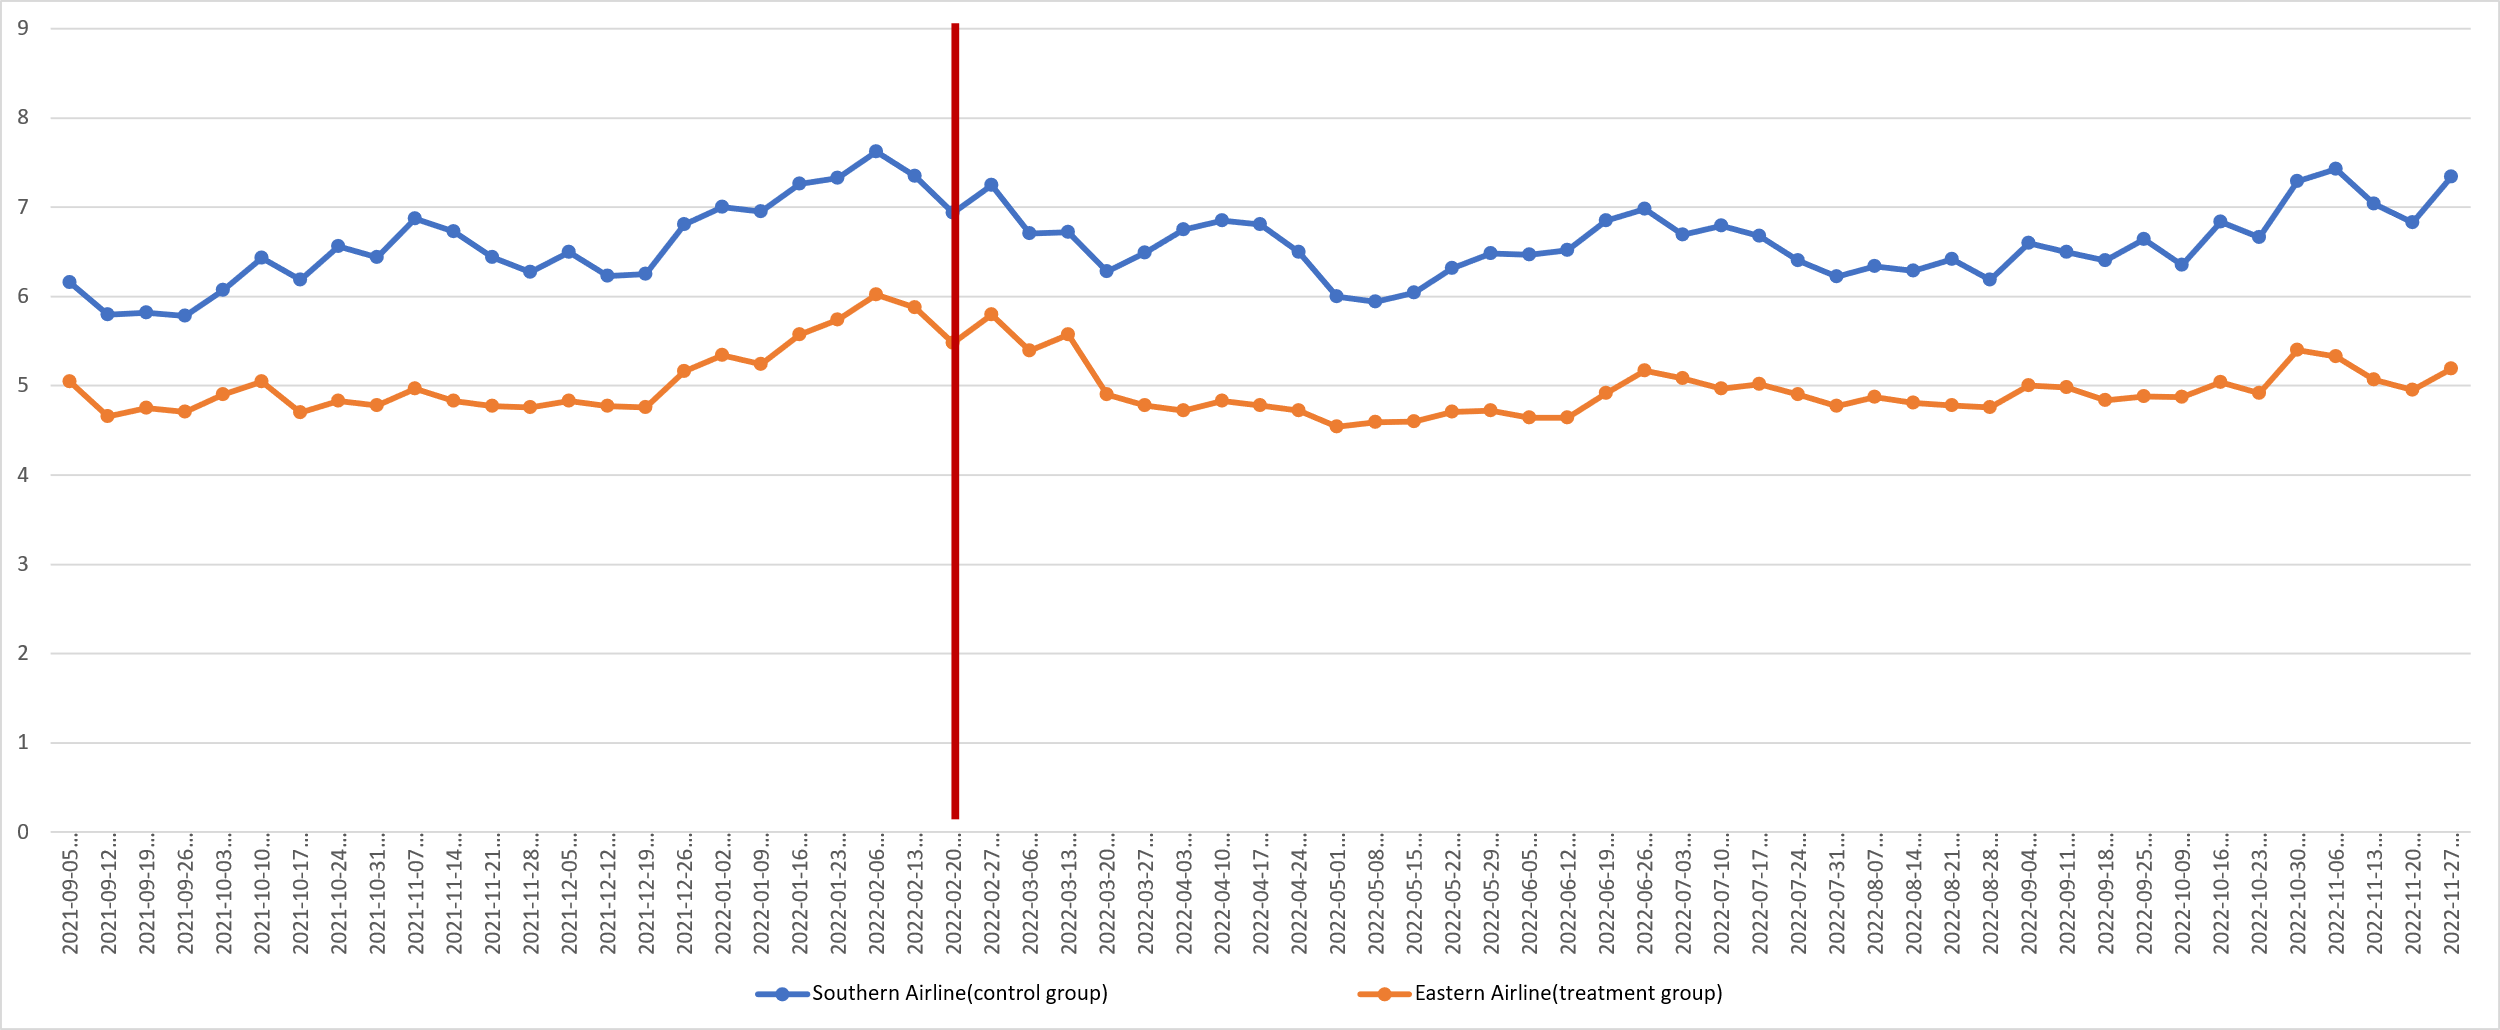
Figure 1: Southern Airline vs Eastern Airline stock price for weekly data (Photo credit: Original).
3.1.2. Average Analysis
Calculate the average stock prices of the treatment and control groups and separate the data into two groups: before and after the air crash. (Table 1) This provides the initial observation of the basic effect of whether the air crash has an impact on the stock price or not. Moreover, the difference between the two groups’ average stock prices before and after the crash happen can be calculated to compare to what extent the difference is affected. As seen in Table 1, the aircraft nearly made no influence on the stock price of the control group, the average price for both before and after the shock is 6.6, however, it is clear that there is a drop of 0.2 in the average of the treatment group, which means that the aircraft had made a negative influence to the Eastern Airlines(treatment group).
Table 1: DID test for weekly data.
Before | After | |
Control Group | 6.6 | 6.6 |
Treatment Group | 5.1 | 4.9 |
Difference | 1.5 | 1.7 |
DID | 0.2 |
3.1.3. DID Analysis
The regression is used to analyze the data (Table 2), based on the formula, the \( {α_{3}} \) and its p-value is mainly considered in the analysis, \( {α_{3}} \) can prove whether the crash has a positive or negative impact, and the p-value shows the significance of the impact.
Table 2: Regression test results for weekly data.
Coefficients | Standard Error | t Stat | P-value | |
Intercept | 6.598571429 | 0.070492649 | 93.60652 | 1.8*10^-115 |
After | -0.00028571 | 0.094575813 | -0.00302 | 0.997595 |
Treated | -1.48392857 | 0.09969166 | -14.8852 | 3.33*10^-29 |
Interaction Term (After*Treated) | -0.23464286 | 0.133750398 | -1.75433 | 0.081884 |
The result coefficient value does show that there is a negative impact on Eastern Airlines’ stock price due to the airplane crash. However, the p-value (0.08) is not that significant, and the DID (0.2) cannot support the statement strongly.
3.2. Model Training and Evaluation
To make the result more specific, the day-to-day stock price is used to do the further analysis, which is to collect the daily stock price information, in case to make sure the specification of the shock event, the data before and after a month is taken to use. After the same analysis steps, the results have a dramatically better performance than the stock price. (Fig. 2, Table3-4)
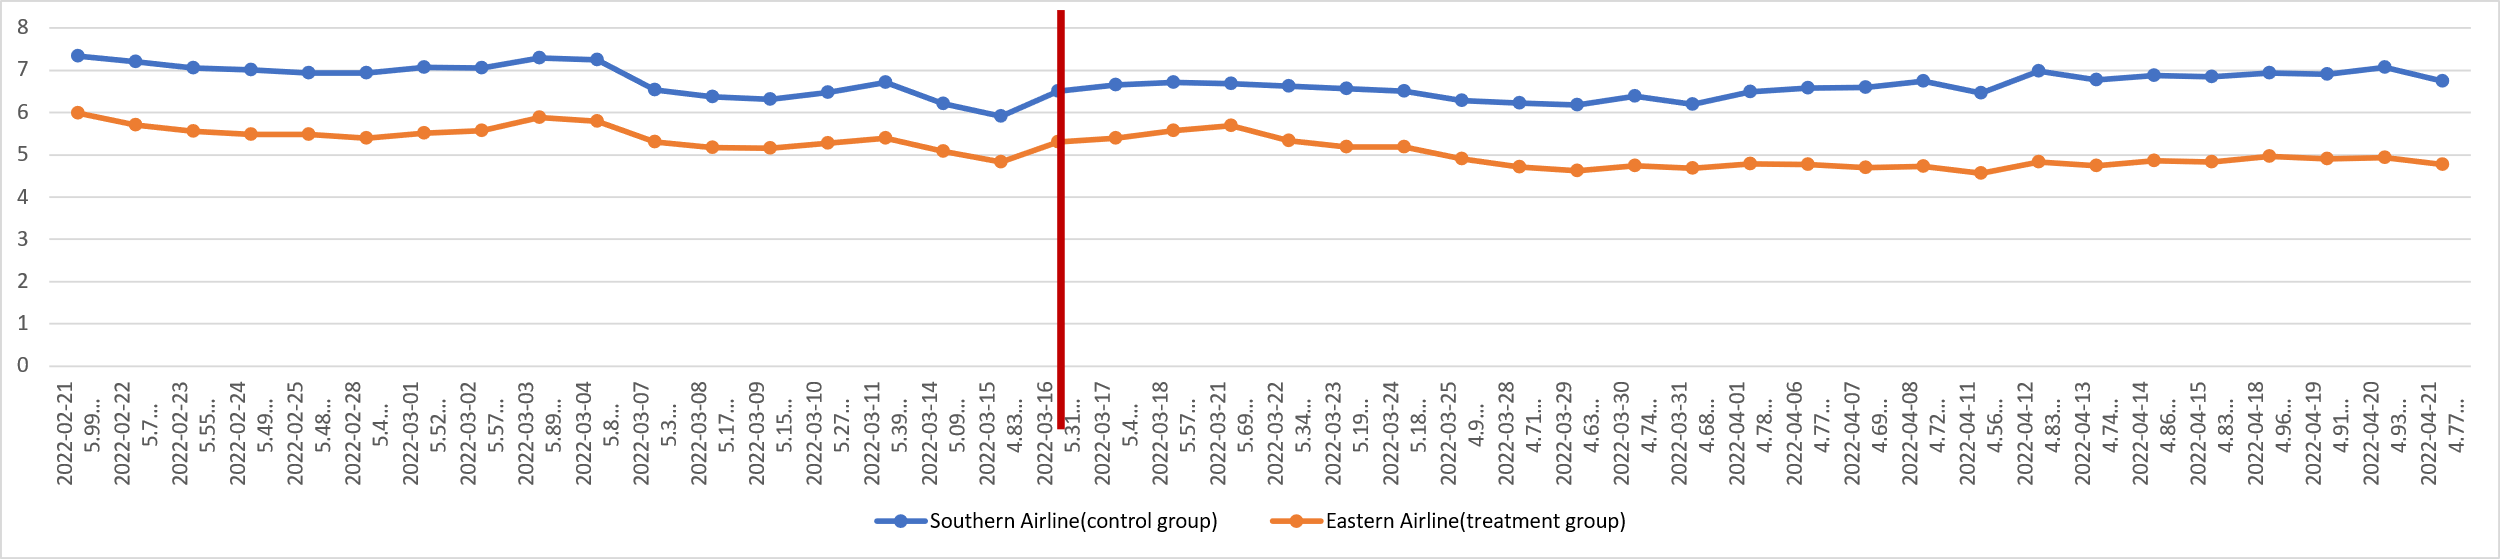
Figure 2: Southern Airline stock price vs Eastern Airline stock price for daily data(Photo credit: Original).
Table 3: DID test for daily data.
Before | After | |
Control Group | 6.8 | 6.6 |
Treatment Group | 5.5 | 4.8 |
Difference | 1.3 | 1.8 |
DID | 0.5 |
Table 4: Regression test results for daily data.
Coefficients | Standard Error | t Stat | P-value | |
Intercept | 6.7728571 | 0.06338013 | 106.8609 | 4.44*10^-88 |
After | -0.155238 | 0.089633039 | -1.73193 | 0.08714 |
Treated | -1.317619 | 0.089633039 | -14.7001 | 1.91*10^-24 |
Interaction Term (After*Treated) | -0.45619 | 0.126760259 | -3.59884 | 0.000552 |
The DID value is 0.5 and the p-value is 0.000552 which can strongly prove that the effect is significant.
Analyzing the difference in stock price between two companies may contain other factors to disturb the analyzing result.
To make a more obverse contract, the data of stock price in May from 2020 to 2022 yearly is collected and compared in Table 5. Table 5 illustrates the yearly comparison in March from 2020 to 2022, the table below can be seen in two parts, the left part compares the years 2020 and 2021, it can be seen clearly from the bold part: the year 2021 has a 304.69% year to year change on the domestic passengers' number, however, from the right part of the table, the change between 2022 and 2021 dropped to -71.07%, the air crash happened in March 2022, and the data shows a dramatically decreasing.
Table 5: Yearly comparison in March.
Actual amount completed for Mar 2021 | Actual amount completed for Mar 2020 | Y/Y Chg(%) | Actual amount completed for Mar 2022 | Actual amount completed for Mar 2021 | Y/Y Chg(%) | |
Passenger Number (thousands) | 8609.50 | 2263.50 | 280.36 | 2,507.79 | 8,608.12 | -70.87% |
Domestic | 8568.22 | 2117.23 | 304.69 | 2,478.32 | 8,566.85 | -71.07% |
International | 23.85 | 136.71 | -82.55 | 17.84 | 23.85 | -25.20% |
Regional | 17.43 | 9.56 | 82.23 | 11.63 | 17.43 | -33.28% |
3.3. Limitation
Analyzing stock price changes alone may not provide a comprehensive understanding of the airline company's overall performance or financial health. Other factors such as revenue, costs, and profitability also play important roles in assessing an airline company's financial situation. Comparing the stock price of one airline company with another may not always be an apples-to-apples comparison. Different airlines may have different business models, market segments, and risk profiles, which can affect their stock price performance in different ways.
Several variables can influence the change in the airline company’s stock price, such as Fuel Prices, Competition, Macroeconomic Factors, Industry Regulations, Natural Disasters and Global Events. Since the shock(airplane crash) happened in March 2022 and the data is collected near to that, all the data is not influenced by the biggest effect: COVID-19. When using the DID analysis, the data of the control group and the treatment group were studied and analyzed when other factors were assumed to be the same except for the aircraft accident. This data cannot exclude other interference factors, the plane crash is a relatively large event, which will have a short but strong impact on the company and the stock, therefore, the data near the shock time is selected to analyze.
4. Conclusion
In conclusion, the impact of an air crash on an airline company can be devastating both financially and in terms of reputation. The immediate consequences of an air crash include loss of lives and property, disruption of operations, and investigation costs. The airline may also face legal liability, compensation claims from victims and families, and regulatory scrutiny. In the short-term aftermath of an air crash, the airline will experience a drop in bookings and revenue due to public safety concerns and negative media coverage. This can lead to a decline in market share and profitability and will necessitate cost-cutting measures such as layoffs, route cancellations, and fleet reduction.
However, the long-term impact of an air crash on an airline company largely depends on how the company handles the crisis. To minimize the impact of an air crash, airlines need to prioritize safety as their top priority and invest in advanced technology, rigorous training, and robust maintenance procedures. In addition, airlines should have crisis management plans in place that can be activated promptly in the event of an accident. Effective communication with all stakeholders, including passengers, employees, regulatory agencies, and the media, is also crucial in managing the aftermath of an air crash.
References
[1]. David Rios Insua, Cesar Alfaro, Javier Gomez, Pablo Hernandez-Coronado, Francisco Bernal, Forecasting and assessing consequences of aviation safety occurrences, Safety Science, 2019, Volume 111, Pages 243-252.
[2]. Wouter Dewulf, Silke Forbes, Yufei Li, The Air Transportation Industry, Elsevier, Amsterdam, Pages 411-431, 2022.
[3]. Panagiotis Stamolampros, Economic pressures on airlines’ safety performance, Safety Science, 2022, Volume 148.
[4]. Shaen Corbet, Marina Efthymiou, Brian Lucey, John F. O'Connell, When lightning strikes twice: The tragedy-induced demise and attempted corporate resuscitation of Malaysia airlines, Annals of Research,2021, Volume 87.
[5]. Bruno Flores, David Rios Insua, Cesar Alfaro, Javier Gomez, Forecasting aviation safety occurrences, Applied Stochastic Models in Business and Industry, 2022, Volume 38, Issue, pp. 545-567
[6]. Erdinc Akyildirim, Shaen Corbet, Marina Efthymiou, Cathal Guiomard, John F. O'Connell, Ahmet Sensoy, The financial market effects of international aviation disasters, International Review of Financial Analysis, 2020, Volume 69.
[7]. R. Dillon, B. Johnson, M. Pate-Cornell, Risk assessment based on financial data: Market response to airline accidents, Risk Analysis, 1999, Volume 19.
[8]. Fardnia, P., Kaspereit, T., Walker, T., Xu, S., Financial performance and safety in the aviation industry, International Journal of Managerial Finance, 2021, Volume 17, Issue 1, Pages 138-165
[9]. W.B. Barrett, A.J. Heuson, R.W. Kolb, G.H. Schropp, The adjustment of stock prices to completely unanticipated events, Financial Review, 1987, Volume 22.
[10]. Jean‐Claude Bosch, E. Woodrow Eckard and Vijay Singal, The Competitive Impact of Air Crashes: Stock Market Evidence, The Journal of Law & Economics,1998, Vol. 41, No. 2, pp. 503-519.
Cite this article
Tu,H. (2023). Research on the Economic Impact of Air Disasters on Airlines. Advances in Economics, Management and Political Sciences,36,45-52.
Data availability
The datasets used and/or analyzed during the current study will be available from the authors upon reasonable request.
Disclaimer/Publisher's Note
The statements, opinions and data contained in all publications are solely those of the individual author(s) and contributor(s) and not of EWA Publishing and/or the editor(s). EWA Publishing and/or the editor(s) disclaim responsibility for any injury to people or property resulting from any ideas, methods, instructions or products referred to in the content.
About volume
Volume title: Proceedings of the 7th International Conference on Economic Management and Green Development
© 2024 by the author(s). Licensee EWA Publishing, Oxford, UK. This article is an open access article distributed under the terms and
conditions of the Creative Commons Attribution (CC BY) license. Authors who
publish this series agree to the following terms:
1. Authors retain copyright and grant the series right of first publication with the work simultaneously licensed under a Creative Commons
Attribution License that allows others to share the work with an acknowledgment of the work's authorship and initial publication in this
series.
2. Authors are able to enter into separate, additional contractual arrangements for the non-exclusive distribution of the series's published
version of the work (e.g., post it to an institutional repository or publish it in a book), with an acknowledgment of its initial
publication in this series.
3. Authors are permitted and encouraged to post their work online (e.g., in institutional repositories or on their website) prior to and
during the submission process, as it can lead to productive exchanges, as well as earlier and greater citation of published work (See
Open access policy for details).
References
[1]. David Rios Insua, Cesar Alfaro, Javier Gomez, Pablo Hernandez-Coronado, Francisco Bernal, Forecasting and assessing consequences of aviation safety occurrences, Safety Science, 2019, Volume 111, Pages 243-252.
[2]. Wouter Dewulf, Silke Forbes, Yufei Li, The Air Transportation Industry, Elsevier, Amsterdam, Pages 411-431, 2022.
[3]. Panagiotis Stamolampros, Economic pressures on airlines’ safety performance, Safety Science, 2022, Volume 148.
[4]. Shaen Corbet, Marina Efthymiou, Brian Lucey, John F. O'Connell, When lightning strikes twice: The tragedy-induced demise and attempted corporate resuscitation of Malaysia airlines, Annals of Research,2021, Volume 87.
[5]. Bruno Flores, David Rios Insua, Cesar Alfaro, Javier Gomez, Forecasting aviation safety occurrences, Applied Stochastic Models in Business and Industry, 2022, Volume 38, Issue, pp. 545-567
[6]. Erdinc Akyildirim, Shaen Corbet, Marina Efthymiou, Cathal Guiomard, John F. O'Connell, Ahmet Sensoy, The financial market effects of international aviation disasters, International Review of Financial Analysis, 2020, Volume 69.
[7]. R. Dillon, B. Johnson, M. Pate-Cornell, Risk assessment based on financial data: Market response to airline accidents, Risk Analysis, 1999, Volume 19.
[8]. Fardnia, P., Kaspereit, T., Walker, T., Xu, S., Financial performance and safety in the aviation industry, International Journal of Managerial Finance, 2021, Volume 17, Issue 1, Pages 138-165
[9]. W.B. Barrett, A.J. Heuson, R.W. Kolb, G.H. Schropp, The adjustment of stock prices to completely unanticipated events, Financial Review, 1987, Volume 22.
[10]. Jean‐Claude Bosch, E. Woodrow Eckard and Vijay Singal, The Competitive Impact of Air Crashes: Stock Market Evidence, The Journal of Law & Economics,1998, Vol. 41, No. 2, pp. 503-519.