


1. Introduction
From a national perspective, increasing air passenger traffic can promote communication and interaction between regions and countries. From the perspective of airlines, obtaining more passenger traffic can increase competitiveness, thereby gaining a larger market share and improving the company's profits [1].
And airline companies always face great competition in the world, the reason is that most of them offer approximately homogeneous services in the same field. To retain their customers, they need to make their customers to be more willing to choose themselves instead of other companies. In other words, airline companies want customers to be more loyal to themselves. And service quality and customer satisfaction are significant factors that are related to customer loyalty [2].
In fact, service quality and customer satisfaction are not independent. Service quality is central to airline passengers’ satisfaction. If customers’ expectations are met by a specific airline company, their satisfaction index might be high enough to choose the company. In general, high service quality can always cover various criteria. But airline passengers can come from hundreds of communities which develop disparate cultures. It’s typically impossible to meet everyone’s requirements, which means companies need to find more efficient factors to bring higher utility. On the other hand, customers have varying levels of perception when it comes to service quality. By promoting an increase in the level of perception, it can also have a positive impact on satisfaction [3].
Finding the target customer group and identifying the circumstances are important. In the low-cost airline companies which offer cheaper tickets, the target group is money-oriented people. That group generally has a low budget, which means they rate the value for money for each airline company to find the most cost-efficient one. Money-oriented groups tend to pursue lower ticket prices when their service requirements are met. For example, security, Luggage safety and so one They always focus on the price of tickets and present tolerance to service quality. However, service-oriented groups demonstrate inverse tendency, they want to get higher service quality of airline company within their budget. Such as Catering quality and Seat comfort. Also, different loyalties have different tendencies. loyal customers tend to tolerate bad services and enjoy good service. Although there are several terrible quality parts of the whole airline service, loyal customers focus on those good quality parts of services and keep giving high satisfaction scores. But disloyal customers will focus on some parts of service that bring bad emotion and give low score of satisfaction. Besides, there are several other groups that can be researched, such as gender, wealth, and customers' goal [4].
High service quality indeed promotes customer satisfaction, but service quality isn’t the only factor that influences customer satisfaction. Different psychological factors, market strategy and online comment will influence passengers to choose one airline company [5,6].
Passenger will choose airline brand which can bring high psychological utility, which include multiple aspects. When an airline company is widely known, people who never know Brands in the aircraft industry always will choose the one that is thought to have the highest popularity. Also, airline companies with high reputation can bring high psychological utility which can improve passengers’ satisfaction. On the other hand, when companies present an empathetic and kind image, customers will be more willing to choose them [7].
Exploring Online Customer Reviews brings two-side effects. Customers will provide Satisfied comments or dissatisfied comments according to their airplane experience, which can provide some factors that play an important role in passengers’ satisfaction evaluation. Satisfiers demonstrate high sensitivity to positive comments and dissatisfiers are sensitive to negative comments. Also, airline companies can use some strategies to promote high satisfied customers comment to lead passengers to choose themselves.
This paper will build a Neural Network model to find various factors that affect airline customers' satisfaction. From the model, several most important factors that force customers to feel satisfied or not will be found out. And according to different groups, their characteristics that affect satisfaction will be explored. Then companies can find the most efficient way to improve customer satisfaction to keep passengers loyal and gain much more profit.
2. Method
2.1. Dataset
The data in this study is from Kaggle https://www.kaggle.com/datasets/teejmahal20/airline-passenger-satisfaction?resource=download) and it contains data of 103,904 customers, and 43 percent of them were satisfied. The data set has 23 fields and stores information by categorizing and numerically representing the degree. They are all shown in table 1:
Table 1:Field explanation.
Variable Name | Detail |
Gender | Gender of the passengers (Female, Male) |
Customer Type | The customer type (Loyal customer, disloyal customer) |
Age | The actual age of the passengers |
Type of Travel | Purpose of the flight of the passengers (Personal Travel, Business Travel) |
Class | Travel class in the plane of the passengers (Business, Eco, Eco Plus) |
Flight distance | The flight distance of this journey |
Inflight wifi service | Satisfaction level of the inflight wifi service (0:Not Applicable;1-5) |
Departure/Arrival time convenient | Satisfaction level of Departure/Arrival time convenient |
Ease of Online booking | Satisfaction level of online booking |
Gate location | Satisfaction level of Gate location |
Food and drink | Satisfaction level of Food and drink |
Online boarding | Satisfaction level of online boarding |
Seat comfort | Satisfaction level of Seat comfort |
Inflight entertainment | Satisfaction level of inflight entertainment |
On-board service | Satisfaction level of On-board service |
Leg room service | Satisfaction level of Leg room service |
Baggage handling | Satisfaction level of baggage handling |
Check-in service | Satisfaction level of Check-in service |
Inflight service | Satisfaction level of inflight service |
Cleanliness | Satisfaction level of Cleanliness |
Departure Delay in Minutes | Minutes delayed when departure |
Arrival Delay in Minutes | Minutes delayed when Arrival |
Satisfaction | Airline satisfaction level(Satisfaction, neutral or dissatisfaction) |
ID | Just number |
2.2. Data Preprocess
Irrelevant, extreme, and high correlated variables need to be eliminated to:
Reduce Overfitting: Including irrelevant or extreme features can lead to overfitting, where the model performs well on the training data but poorly on new, unseen data. By removing these features, the model can generalize better to new data.
Improve Performance: Neural networks have a limited capacity to learn and represent complex patterns. Including irrelevant or extreme features can overwhelm the network and prevent it from focusing on the most important features. By removing these features, the network can better focus its attention on the relevant features, which can improve its performance.
Reduce Noise: Extreme values in the input features can introduce noise and make it more difficult for the network to learn the underlying patterns in the data. By removing these values, the network can better identify the important patterns in the data.
Also, some variables which are not 0 to 1 scale need to be normalized. Because several variables are on different scale with other variables, machine learning algorithms will give those variables much higher weight which force the result to be less credible. So those variables need to be normalized and brought to the same scale as others by Min-Max Normalization (see Equation. 1). Putting all variables in common range will promote algorithm to analyze each variable to find the relative importance. Also using this method can reduce the influence of data outliers.
\( Normalized Value=\frac{Original Value - Minimum Value}{Maximum Value - Minimum Value} \) (1)
2.3. Satisfaction Prediction based on Machine Learning Algorithm
In the machine learning algorithm, there are two most used methods, the first is supervised machine learning, the second is unsupervised one. Both methods are used to develop models that can predict, classify, cluster, or segment data according to the complex relationship in the dataset. This paper will focus on supervised machine learning:
The supervised machine learning algorithm always uses labeled data to train the model. Labeled data refers to data that is marked with a target or output variable. Then supervised learning can build a model that performs well in predicting the output variable through a given dataset input. One of the most important advantages of supervised learning is that it allows for the development of highly accurate and precise models.
Supervised learning algorithms can be roughly divided into two categories: regression and classification. In regression problems, the output variable is continuous, and the goal is to predict a numerical value. In classification problems, the output variable is categorical, and the target is to predict which category a given observation belongs to.
Neural networks are powerful machine learning algorithms that can be used for both regression and classification tasks and can learn complex patterns and relationships from data. It is a computational model inspired by the structure and functioning of biological neural networks in the human brain. Neural networks can have parallel distributed processing, high degree of robustness and fault tolerance. By adjusting parameters, selecting different hidden layers and neurons, and choosing specific transfer functions, they can build very complex relationships between predictor variables and response variables. This complex relationship can bring accurate prediction to the target of model. The paper considers that the prediction of data set in this paper can be handled well by Neural network [8].
3. Empirical Result
3.1. Irrelevant Value
Because the sequence number and id of the data have no significance to the prediction result, these two variables will be directly deleted.
3.2. High Correlated Value
According to the Figure 1, the correlation between “male” and “female” is -1. The correlation between “eco” and “business” is -0.86. Taking into consideration that this high correlation is not due to a causal relationship between the variables. So, “female” and “business” will be kept.
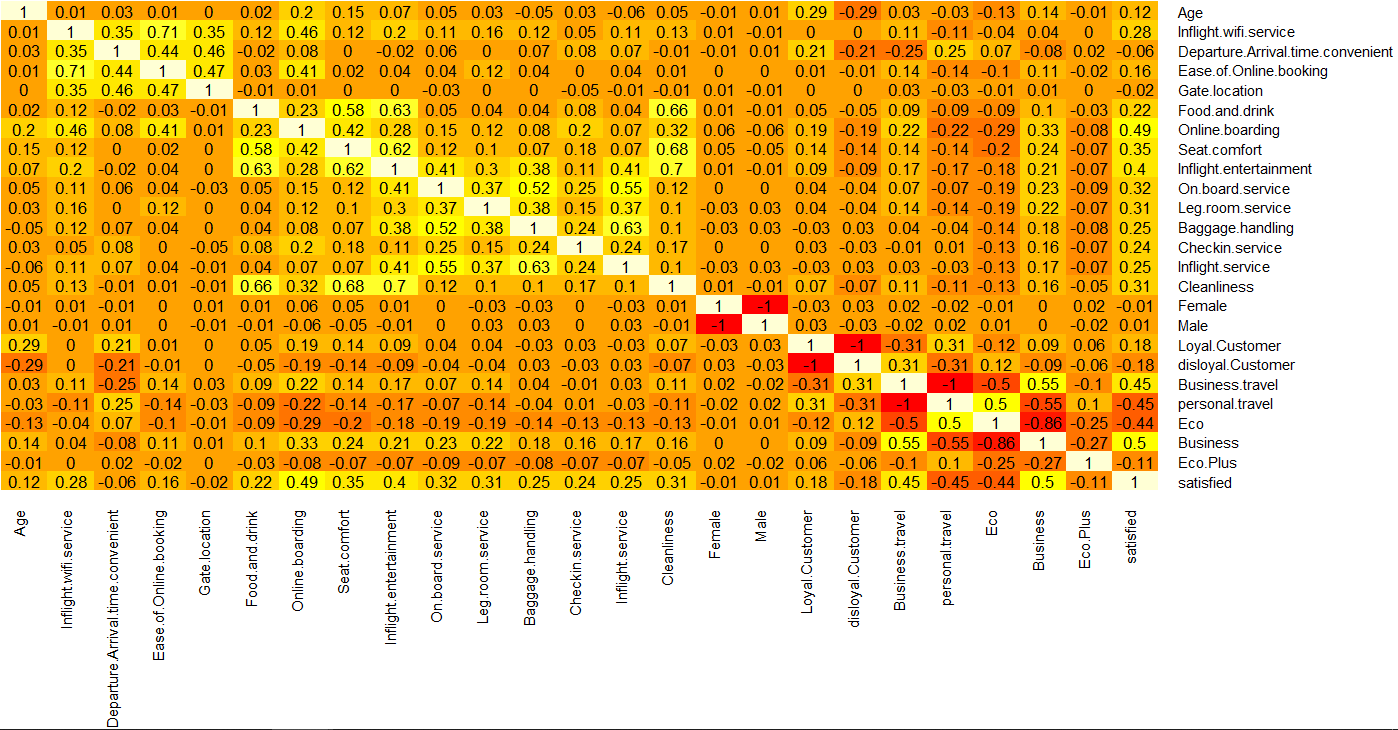
Figure 1: Correlation between 23 factors.
3.3. Extreme Value
“Flight.Distance”, “Departure.Delay.in.Minutes” and “Arrival.Delay.in.Minutes” are right skewed in Figure 2, which means they bring multiple influence on model. The mean of three variables will be less than the median instead of equaling. To avoid biased estimates and promote accuracy and performance, these three variables will be deleted.
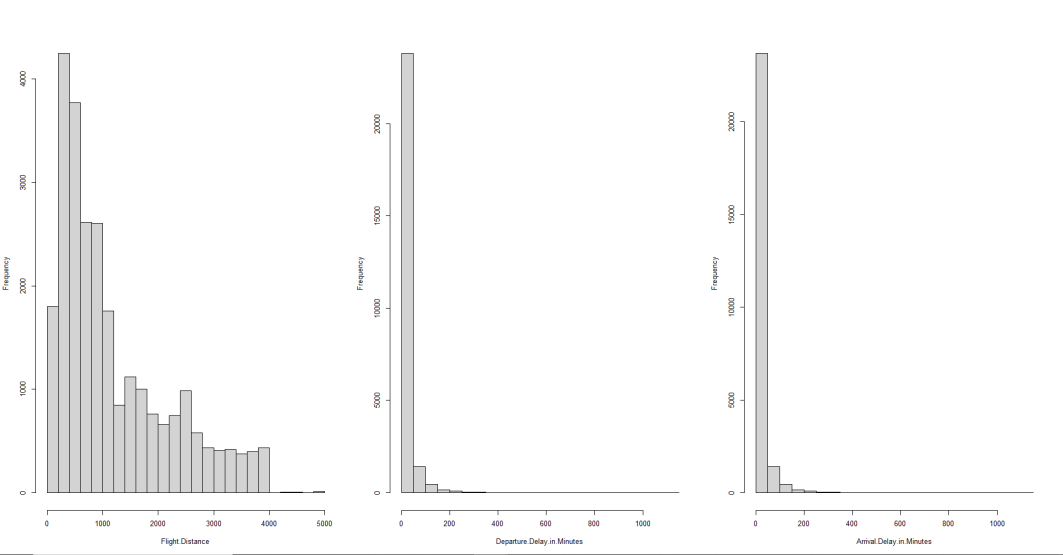
Figure 2: Extreme value distribution.
3.4. Neural Network
During the model building, the optimal number of hidden layers and nodes needs to be found. The training process involves testing 36 combinations of hidden layers and neural nodes, using a maximum of 100,000 iterations in training, and stopping the training process when the error change between consecutive iterations is less than 0.01. Additionally, the logistic transformation function is used. By testing RMSE with different layers of neural networks and found that the model performed best. According to the following Figure 3, the fourteenth point is the lowest point, which means that the neural network model with two hidden layers and three nodes each layer has the best performance.
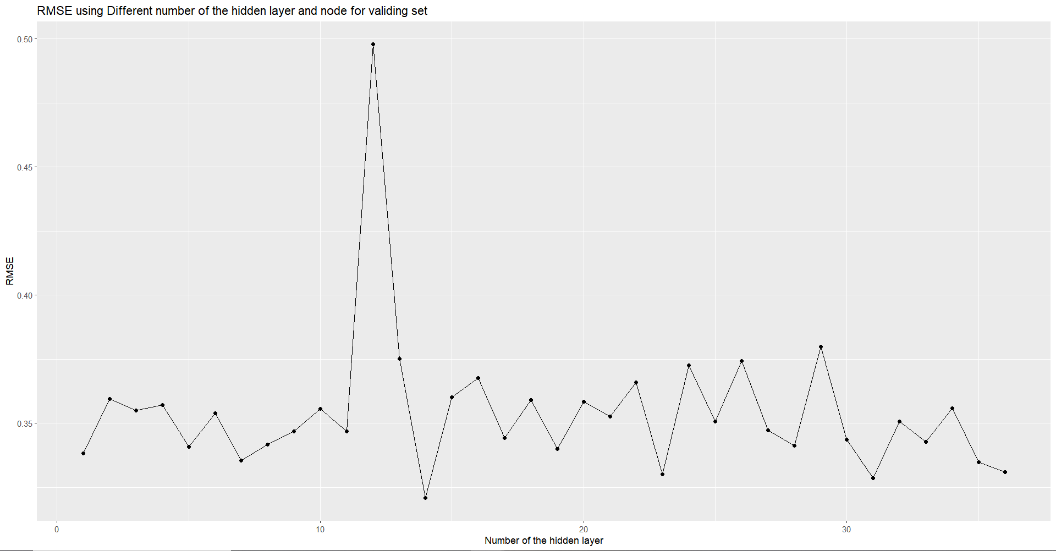
Figure 3: Accuracy variation with different combination of nodes and layers.
This paper draws the picture of the best model in Figure 4.
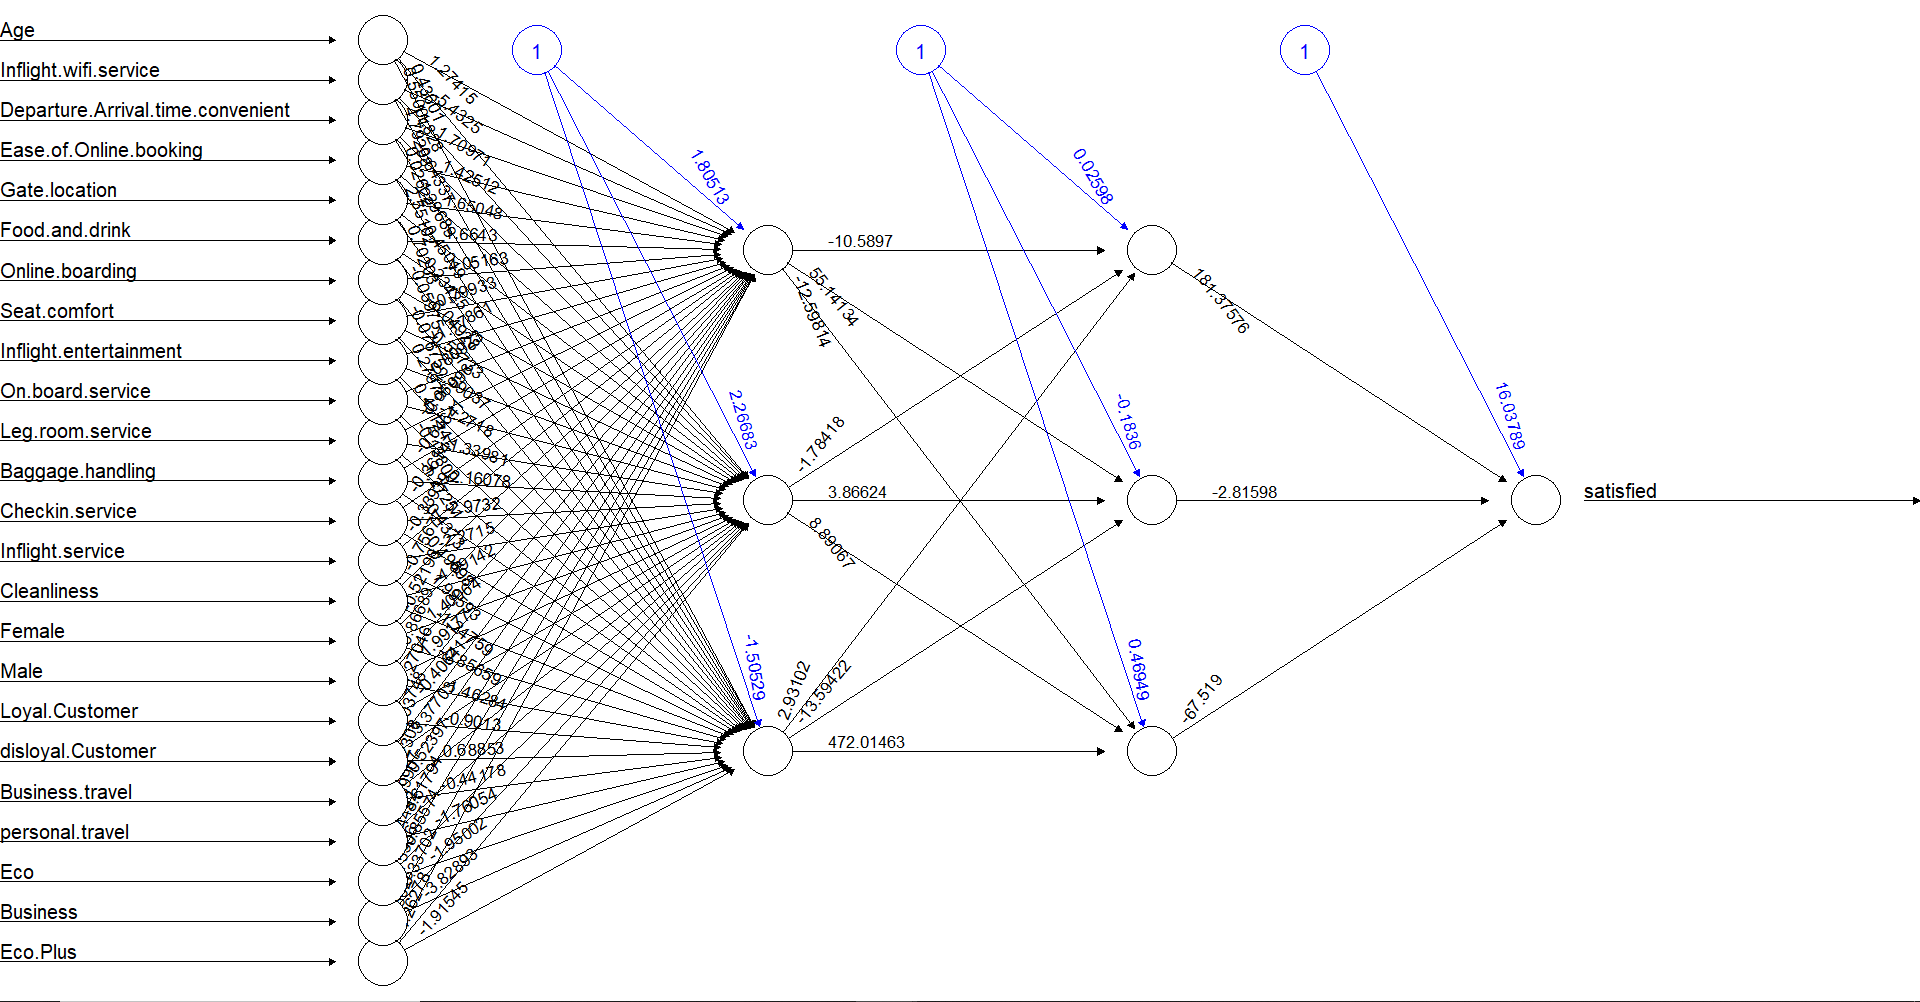
Figure 4: The neural network.
The cutoff value is a threshold in neural network models that is used to convert the predicted probabilities into binary classifications. In other words, after a neural network model makes predictions on a dataset, the predicted probabilities for each observation are compared to the cutoff value, and observations with predicted probabilities greater than or equal to the cutoff are assigned to one class, while observations with predicted probabilities less than the cutoff are assigned to the other class.
Different cutoff values are tried in Figure 5, and it is found that when cutoff is greater than 0.7, the accuracy of the model is the highest and very stable, 0.8904, which is close to 0.9.
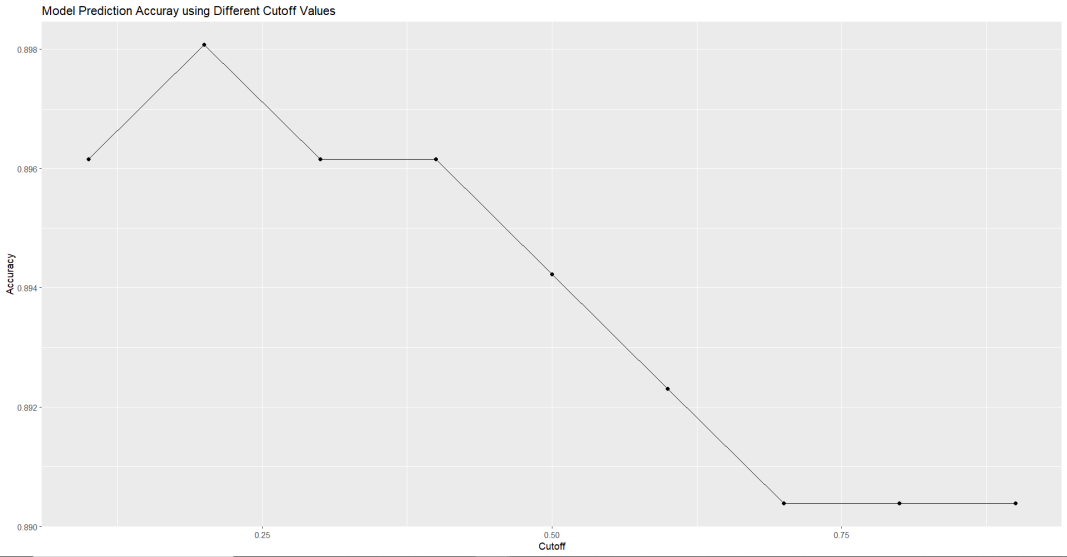
Figure 5: Accuracy variation with different cutoff values.
Lift chart is used to evaluate this model's ability to rank the data by the predicted probability of an outcome of interest. A lift chart plots the cumulative percentage of positive outcomes against the percentage of the population. By comparing the accumulated outcome from both model and random selection of data, the lift chart graph was pictured to demonstrate the model details of ranking the data and promote the finding of how easy the model is to recognize the target outcome.
Through the lift chart in Figure 6, this paper found that the response rate reached around 80 percent when the data was 40 percent, indicating that Neural Network Model performed very well.
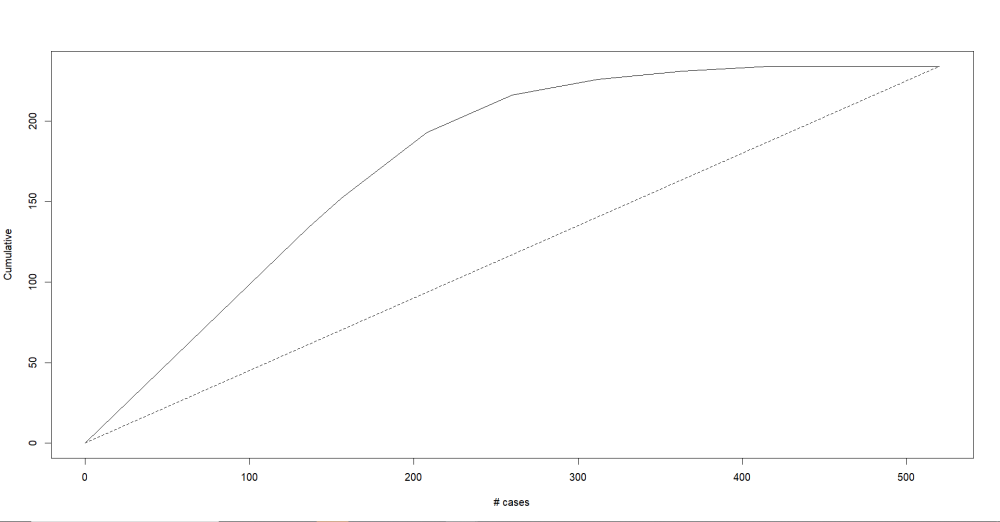
Figure 6: Lift chart.
3.5. Variable Comparison
Four existing factors were picked out, using the generalized weights method. Four existing factors are heavily weighted and near and above 200 in the neural network model and plots them separately in Figure 8, which means that “Inflight.wifi.service”, “Online.boarding”, “personal.travel”, “business” are more important than others.
It is evident from the study in this paper that WiFi service, online check-in service, business class customers, and individual travelers have the highest weights. This means that for airlines, improving the quality of these services will be the most cost-effective choice. Among them, WiFi service has a greater weight compared to other services with a more evenly distributed weight impact. Furthermore, the weight impact of WiFi service is mainly concentrated on positive effects, approaching 400.
It is easy to understand that in the information age, the internet has become the most essential service for modern people. Unfortunately, most airlines do not provide internet services, and some airlines offer low-quality internet services. If airlines can provide better internet services or reduce the prices of internet services, it will be the best tool to improve customer satisfaction.
For online printing of boarding passes and business class customer services, just like WiFi services, they all bring more positive effects to satisfaction ratings. However, as shown in Figure 7, compared to business class customer services, there are more extreme weight points exceeding the critical line of 200 for online printing of boarding passes. This also means that investing in this service will bring the second highest return on satisfaction among the four services.
The weight of personal traveler services is mainly distributed in negative impact and exceeds the critical line of 200. This means that for airlines, making certain service level improvements at a lower level of personal traveler service may not necessarily bring more satisfactory evaluations, but will certainly reduce the number of dissatisfied customers. Therefore, it is also an important part of ensuring satisfaction.
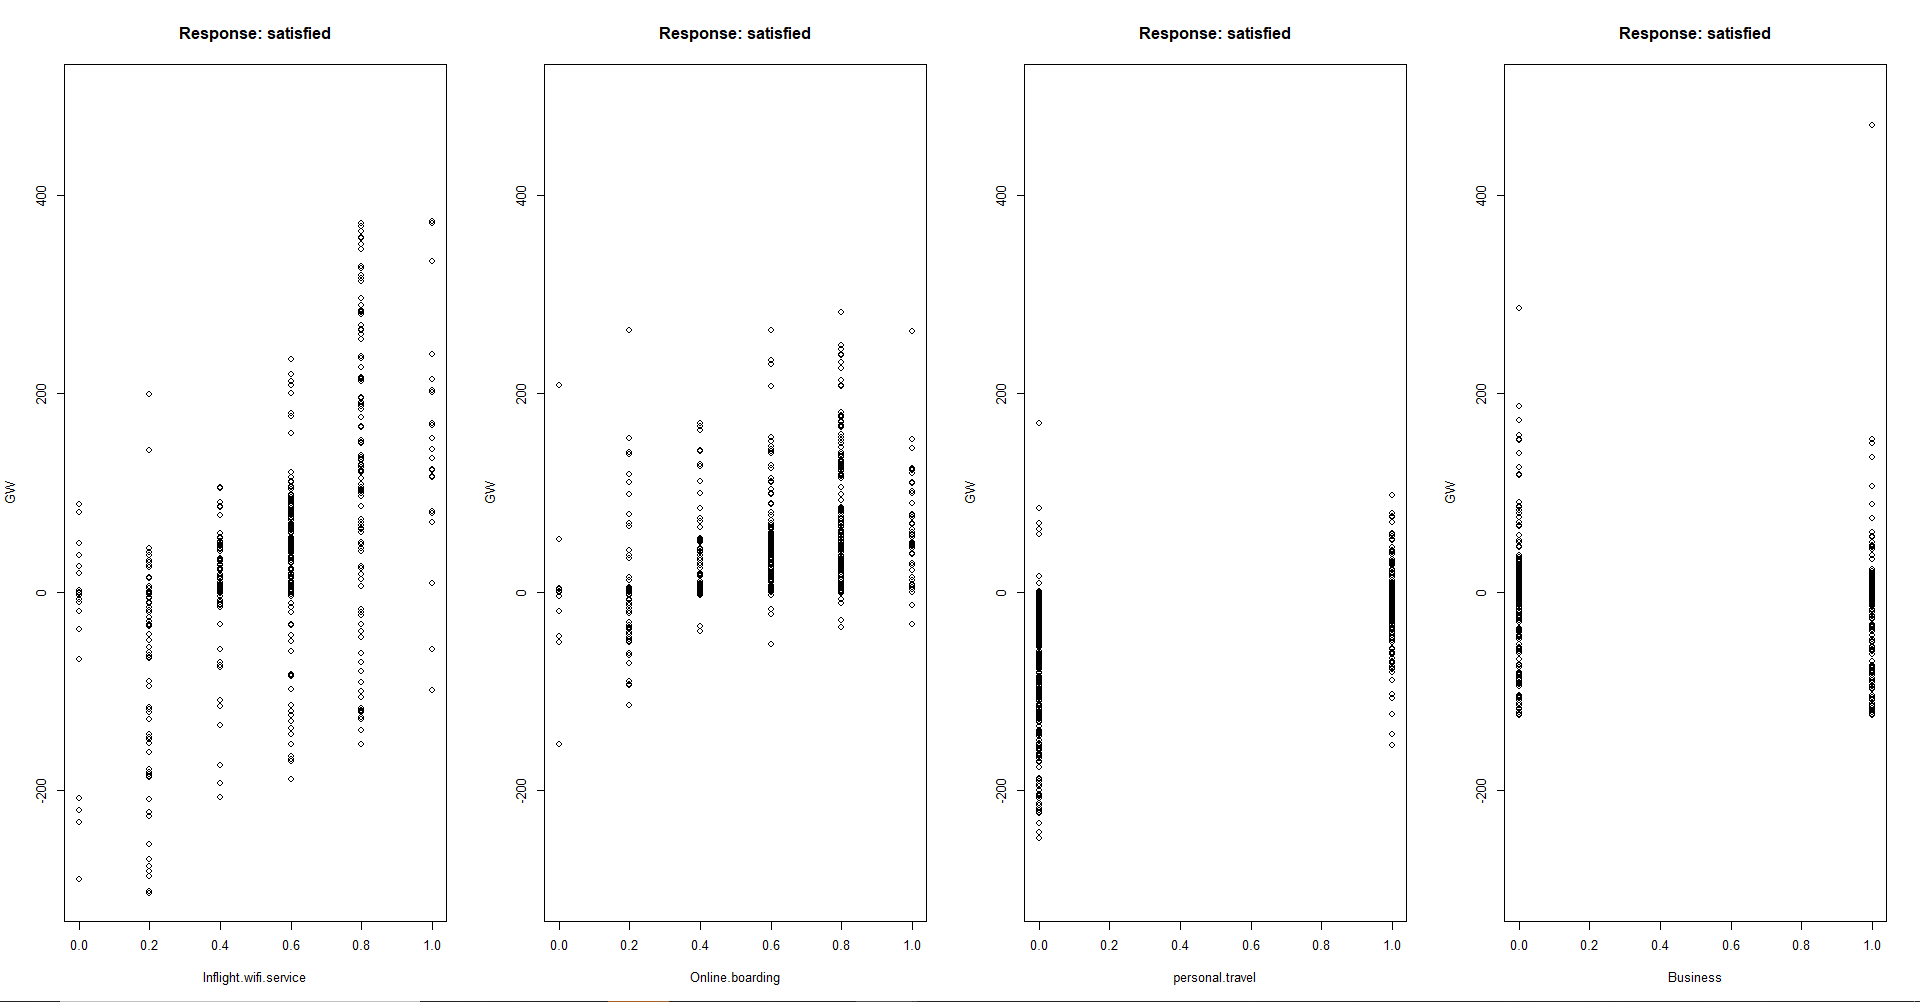
Figure 7: Four important variables.
In Figure 8, non-loyal customers have nearly three times the weight of loyal customers, and unlike loyal customers whose weight is concentrated on positive impacts, non-loyal customers have almost 1.5 times the weight of negative impact while having similar positive impact weight as loyal customers. Non-loyal customers are more concerned about the negative aspects of each service, so airlines can improve the loyalty program service level or lower the loyalty program price while improving service level to some extent, which will benefit the satisfaction of non-loyal customers and may also convert them into loyal customers [9,10].
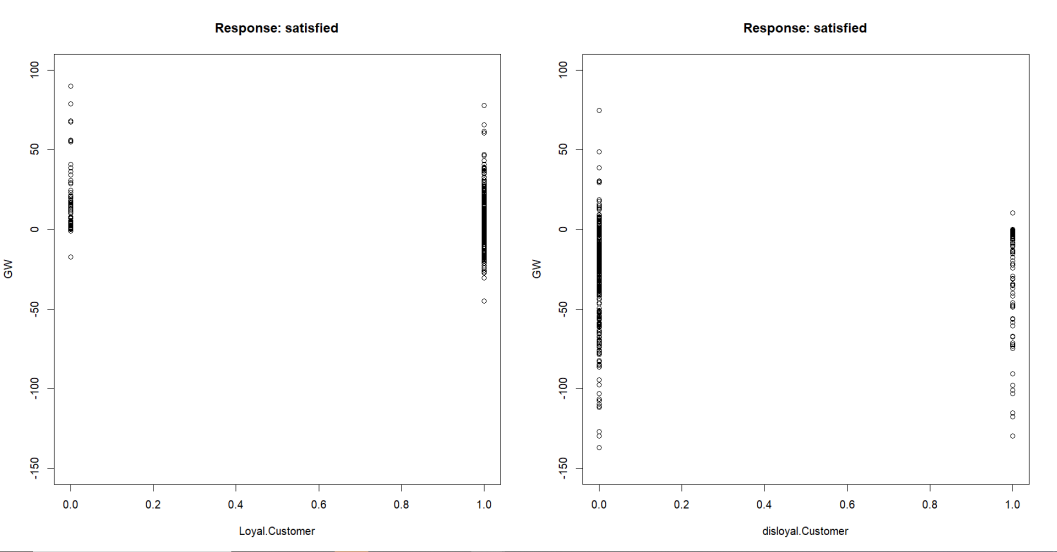
Figure 8: Loyalty comparison.
In Figure 9, individual travelers have nearly four times more weight than business travelers and are mainly concentrated in negative weight impacts. However, individual travelers also have occasional extremely high positive weight impacts compared to business travelers. This means that individual travelers care more about the service experience during their vacation and have a stronger aversion to inadequate services. On the other hand, business travelers are relatively less concerned about the quality of service and are more focused on the transportation attributes of the flight. Thus, airlines can improve the service level while increasing the loyalty program's quality or reducing its price, which will benefit the satisfaction of non-loyal customers and increase the likelihood of converting them into loyal customers.
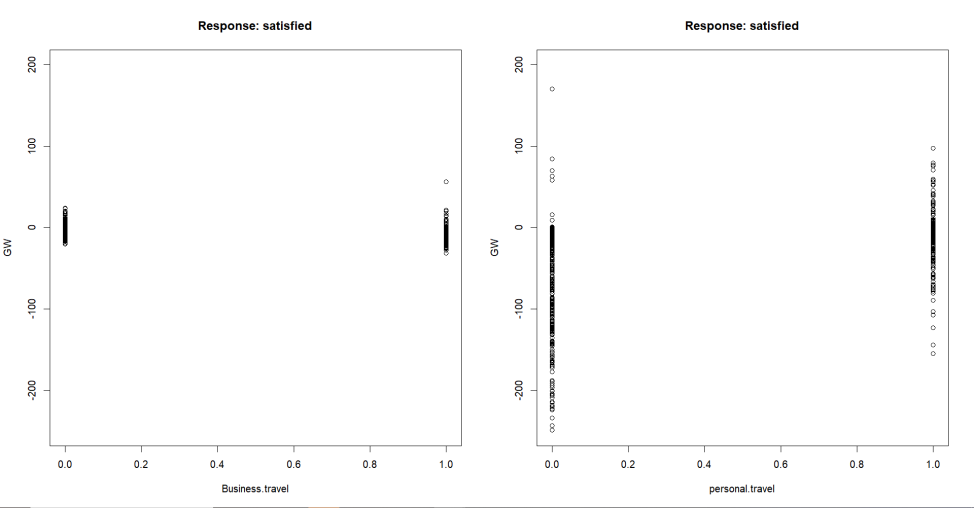
Figure 9: Customer type comparison.
In the weight comparison chart for different airplane cabin classes shown in Figure 10, it is easy to notice that both the business class and premium economy class have higher weights than the economy class. However, the business class is concentrated on positive impacts and has a peak weight of nearly 300, while the premium economy class is mainly focused on negative impacts. Firstly, business class is an airline's high-end service product aimed at providing a high-quality flight experience that can meet customers' service needs and exceed their expectations. On the other hand, the relatively even distribution of economy class weights implies that economy class customers are not particularly demanding of service quality. From this, it can be inferred that the premium economy class, compared to the economy class, has increased prices and customers expect better services. If the service does not meet their expectations, it will lead to more dissatisfaction. Business class, therefore, is a premium product that is highly valued by customers.
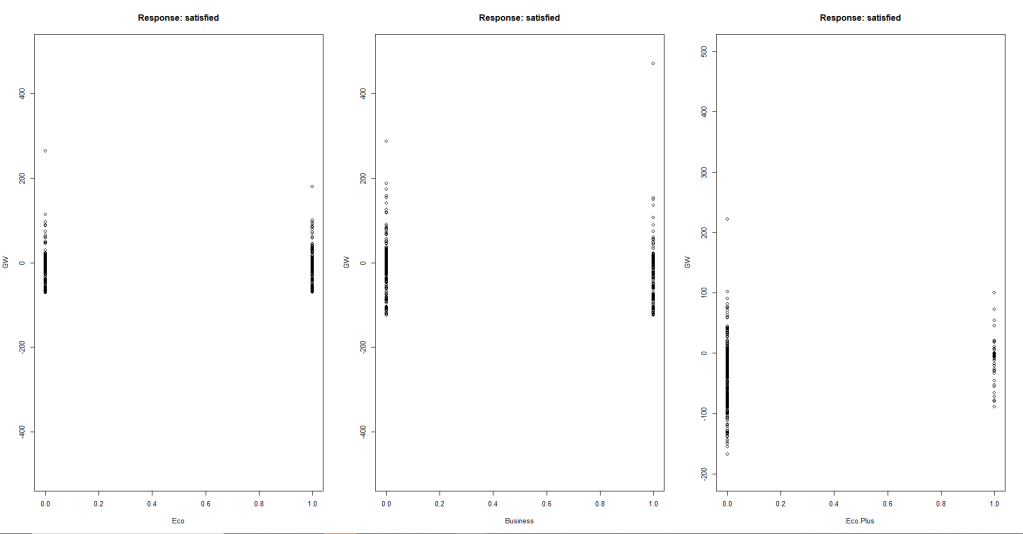
Figure 10: Cabin classes comparison.
4. Conclusion
4.1. Analysis
This article aims to identify the most efficient service items for improving customer satisfaction and the varying degrees of impact that changes in service quality have on different customer segments by establishing a relationship model between service quality and service satisfaction. In the model conclusions, Wi-Fi service, online check-in service, business class customers, and individual travel customers have the highest weights.
In the current era of being already in the Internet age. For Wi-Fi service, airlines that have not yet launched Wi-Fi services should launch network services as soon as possible, and for airlines that have already launched Wi-Fi services, reducing appropriately the purchase price or improving the network quality of Wi-Fi services will bring considerable satisfaction benefits. In terms of the quality of online check-in service, it has a better cost-performance ratio compared to Wi-Fi service, because improving the quality of online check-in service can not only increase customer satisfaction but also reduce the business volume and cost of offline check-in service. This can bring more profits to the airline.
Improving business class services or lowering prices are the third most cost-effective options for airlines. Improving the service quality for individual travelers or lowering ticket prices are the fourth most important options.
Loyalty programs are important marketing strategies for airlines. By improving service quality appropriately, more satisfied evaluations may be received, which can help retain subscribed loyalty program customers. For customers who have not joined the loyalty program, airline company can lower the loyalty program price while improving their service quality to attract more customers to join the program, thereby gaining a larger market share.
Investing in service quality for ordinary businesspeople may not have a significant impact on satisfaction, but for business people who order business class tickets, higher service quality usually leads to more satisfactory evaluations. Individual travelers are more demanding in their evaluation of service quality, and for this group, offering specific discounts or service improvement activities may lead to more satisfactory evaluations. For the three different cabin classes, improving the quality of premium economy class may be relatively more important. High-quality premium economy class services may significantly reduce dissatisfaction evaluations and attract more customers to book premium economy class tickets.
4.2. Development
Data side: The dataset used in this paper still has some insufficiencies in terms of surveying passengers.
Firstly, the target population of the survey can be segmented by identity, including businesspeople, students, tourists, and others. This can help airlines understand the sensitivity of different passenger identities to different service levels of different service items in terms of satisfaction and dissatisfaction.
Secondly, the evaluation indicators for the satisfaction survey in the dataset are not sufficient. In future studies, the satisfaction score can be designed to include indices ranging from one to five, and the weather conditions during each flight can be included to understand how customer satisfaction fluctuates under different weather conditions.
Program: First, running a neural network on a large dataset in R can result in excessively long processing times. The dataset used had to be reduced by a factor of twenty. To address this issue, the dataset can be divided into smaller subsets, with each subset processed separately using a neural network, before combining the results.
Second, in the model prediction of this paper, only default parameters were used without considering the combination of different parameters for prediction results. In fact, neural networks have many parameters that can be set, including threshold, stepmax, and so on. In the future, attempts can be made to optimize the combination of parameters to obtain better accuracy.
Thirdly, in future studies, ensemble learning methods can others, combine multiple models including KNN, logistic regression, multiple linear regression, and others, and integrate their prediction results into a final output to avoid the weaknesses of individual models and achieve the best predictive performance.
References
[1]. Zhang, F., Graham, D. J.: Air transport and economic growth: a review of the impact mechanism and causal relationships. Transport Reviews, 40(4), 506-528(2020).
[2]. Ismail, I. J.: Speaking to the hearts of the customers! The mediating effect of customer loyalty on customer orientation, technology orientation and business performance. Technological Sustainability, 2(1), 44-66 (2023).
[3]. Boubker, O., Naoui, K. Factors affecting airline brand love, passengers’ loyalty, and positive word-of-mouth. A case study of Royal Air Maroc. Case Studies on Transport Policy, 10(2), 1388-1400(2022).
[4]. Koech, A. K., Buyle, S., Macário, R.: Airline brand awareness and perceived quality effect on the attitudes towards frequent-flyer programs and airline brand choice-Moderating effect of frequent-flyer programs. Journal of Air Transport Management 107, 102342(2023).
[5]. Kumar, S., Zymbler, M.: A machine learning approach to analyze customer satisfaction from airline tweets. Journal of Big Data 6.1, 1-16(2019).
[6]. Lucini, F. R., Tonetto, L. M., Fogliatto, F. S., Anzanello, M. J.: Text mining approach to explore dimensions of airline customer satisfaction using online customer reviews. Journal of Air Transport Management 83, 101760(2020).
[7]. de Figueiredo Marcos, A., da Silva, A. R. L.: Antecedents and outcomes of brand love. 2020 15th Iberian Conference on Information Systems and Technologies (CISTI). IEEE, 1-7(2020).
[8]. Amesoeder, C., Hartig, F., Pichler, M.: cito: An R package for training neural networks using torch. arXiv preprint arXiv:2303.09599(2023).
[9]. Shen, C., Yahya, Y.: The impact of service quality and price on passengers' loyalty towards low-cost airlines: The Southeast Asia perspective. Journal of Air Transport Management, 91, 101966(2021).
[10]. Leon, S., Leon, A.: Exploring personality moderation effects on satisfaction and loyalty in the airline industry. Journal of Airline and Airport Management, 13(1), 31-49(2023).
Cite this article
Du,W. (2023). Neural Network in Aircraft Customer Satisfaction Prediction. Advances in Economics, Management and Political Sciences,38,19-29.
Data availability
The datasets used and/or analyzed during the current study will be available from the authors upon reasonable request.
Disclaimer/Publisher's Note
The statements, opinions and data contained in all publications are solely those of the individual author(s) and contributor(s) and not of EWA Publishing and/or the editor(s). EWA Publishing and/or the editor(s) disclaim responsibility for any injury to people or property resulting from any ideas, methods, instructions or products referred to in the content.
About volume
Volume title: Proceedings of the 7th International Conference on Economic Management and Green Development
© 2024 by the author(s). Licensee EWA Publishing, Oxford, UK. This article is an open access article distributed under the terms and
conditions of the Creative Commons Attribution (CC BY) license. Authors who
publish this series agree to the following terms:
1. Authors retain copyright and grant the series right of first publication with the work simultaneously licensed under a Creative Commons
Attribution License that allows others to share the work with an acknowledgment of the work's authorship and initial publication in this
series.
2. Authors are able to enter into separate, additional contractual arrangements for the non-exclusive distribution of the series's published
version of the work (e.g., post it to an institutional repository or publish it in a book), with an acknowledgment of its initial
publication in this series.
3. Authors are permitted and encouraged to post their work online (e.g., in institutional repositories or on their website) prior to and
during the submission process, as it can lead to productive exchanges, as well as earlier and greater citation of published work (See
Open access policy for details).
References
[1]. Zhang, F., Graham, D. J.: Air transport and economic growth: a review of the impact mechanism and causal relationships. Transport Reviews, 40(4), 506-528(2020).
[2]. Ismail, I. J.: Speaking to the hearts of the customers! The mediating effect of customer loyalty on customer orientation, technology orientation and business performance. Technological Sustainability, 2(1), 44-66 (2023).
[3]. Boubker, O., Naoui, K. Factors affecting airline brand love, passengers’ loyalty, and positive word-of-mouth. A case study of Royal Air Maroc. Case Studies on Transport Policy, 10(2), 1388-1400(2022).
[4]. Koech, A. K., Buyle, S., Macário, R.: Airline brand awareness and perceived quality effect on the attitudes towards frequent-flyer programs and airline brand choice-Moderating effect of frequent-flyer programs. Journal of Air Transport Management 107, 102342(2023).
[5]. Kumar, S., Zymbler, M.: A machine learning approach to analyze customer satisfaction from airline tweets. Journal of Big Data 6.1, 1-16(2019).
[6]. Lucini, F. R., Tonetto, L. M., Fogliatto, F. S., Anzanello, M. J.: Text mining approach to explore dimensions of airline customer satisfaction using online customer reviews. Journal of Air Transport Management 83, 101760(2020).
[7]. de Figueiredo Marcos, A., da Silva, A. R. L.: Antecedents and outcomes of brand love. 2020 15th Iberian Conference on Information Systems and Technologies (CISTI). IEEE, 1-7(2020).
[8]. Amesoeder, C., Hartig, F., Pichler, M.: cito: An R package for training neural networks using torch. arXiv preprint arXiv:2303.09599(2023).
[9]. Shen, C., Yahya, Y.: The impact of service quality and price on passengers' loyalty towards low-cost airlines: The Southeast Asia perspective. Journal of Air Transport Management, 91, 101966(2021).
[10]. Leon, S., Leon, A.: Exploring personality moderation effects on satisfaction and loyalty in the airline industry. Journal of Airline and Airport Management, 13(1), 31-49(2023).