


1. Introduction
The US financial sanctions against Russia and the bankruptcy of Credit Suisse Bank have aggravated many people’s doubts about the wealth security of the US and Switzerland. Therefore, people start to consider transferring funds to Hong Kong. As an international financial center, Hong Kong has a relatively stable banking system. The inflow and outflow of funds are also convenient.
The Hang Seng Index (HSI) is one of the important indices in the Hong Kong stock market, which was established by the Hong Kong and Shanghai Banking Corporation Limited (HSBC) in 1969 to reflect the overall performance of the securities market in Hong Kong. As one of the major stock indices of the Hong Kong securities market, the HSI is widely used in academic research. For instance, the HSI can be used to study volatility, market risk and volatility prediction of the Hong Kong stock market. Furthermore, as a common risk management tool in financial investments, the HSI can assist investors in developing strategies, diversifying risks, and obtaining information. The index calculation rules and composition of the Hang Seng Index have been continuously updated to keep pace with the constantly changing market environment. And its Exchange Traded Fund (ETF), as a type of index funds representing the stock index future, is the good choice for investors who expect to gain from Hong Kong market.
The price-to-earnings ratio (P/E ratio) is an important measure for determining the valuation level of companies. The P/E ratio evaluates the current price of share in relation to the earnings per share to determine the worth of a company [1]. The P/E ratio is commonly used by investors to figure out whether a stock is overvalued or undervalued with regard to its future earnings potential. Generally, a firm with a higher P/E ratio is anticipated to see faster future profits growth. The P/E ratio shows both market fundamentals and mispricing [2]. The conventional P/E ratio is more representative of market fundamentals, while the cyclically adjusted P/E ratio is a more accurate signal for incorrect pricing. According to the article, there is an inverse relation between the portfolio returns and P/E ratio, and higher returns can be achieved systematically by an investor by investing the right stock having low P/E ratio. The results of the study typically assume that the P/E ratio follows the reversion to the mean that can predict future stock price fluctuations [3]. The basic logic behind it is that when the current P/E ratio is lower than the historical average, the asset valuation is considered to be undervalued, and there is the potential for the stock price to rise, driving the P/E ratio back up to the average. Conversely, if the asset valuation is considered overvalued, there is pressure on the stock price to fall, causing the P/E ratio to return to the average.
Several researchers applied historical data to investigate the significance of P/E ratio in stock markets. By applying historical data, this study examined the connection between P/E ratios and subsequent stock market performance [4]. Strong historical evidence suggests that high P/E ratios have been associated with short-term as well as long-term stock market poor performance. This study revealed that there is considerable significance for the P/E ratio as a tool for predicting future dividend increases [5]. The results of the study demonstrated that P/E ratio has a substantial impact on forecasting share market price [6]. Theoretically, a standardized P/E ratio may be attained as a benchmark by taking the mean/median of P/E ratios over a significant period of time and investors can find out more regarding whether or not a company should be viewed as a purchasing opportunity [7]. The P/E ratio may also be seen as an expectation of future company profitability, along with views of the associated risk. The study employed Price-to-Earnings Ratio Network (PEN) methodology as a substitute for mean-variance analysis in the context of optimizing a portfolio [8]. Nathan et al. examined the effectiveness of trading strategy combining P/E ratio and price-to-sales ratio (P/S ratio) with industry characteristics [9]. Even though many researches showed that P/E ratio is a strong forecaster of market price, the analysis in Indonesia market concluded that P/E ratio had no effect on stock price [10].
Therefore, this paper studies the Hang Seng ETF investment strategy based on HSI’s P/E ratio and backtests the strategy with the historical data. The article collects the data of HSI’s P/E ratio and Hang Seng ETF’ price during 2013-2022 and builds a investment strategy to arbitrage from the market. According to the strategy, trading happens at the first trading day of every month if there is a signal of purchasing. The signal of purchasing or selling depends on the performance of P/E ratio. The rate of return shows that the investment strategy based on P/E ratio is feasible and practical.
2. Methods
2.1. Data Source
The data of the research is collected from the Wind Database and Hang Seng Index official website. Wind Database provides the closing price and P/E ratio of Hang Seng Index and the closing and opening price of its ETF on every trading day. Monthly P/E ratio is from the official website.
To discover the viability of the trading strategy, the author collects ten years’ data to backtest the strategy. Data collection spans from 2013 to 2022.
2.2. Strategy Description
The strategy is based on the performance of P/E ratio. A parameter called P is defined in this strategy. P, standing for the performance of P/E ratio, measures the current month with the last five years’ P/E ratio. It captures the fluctuations among years. By comparing the P/E ratio with past statistics, this strategy suggests investors purchase or not.
\( P=\frac{P/E ratio of current month-min{P/E ratio of five years}}{max-min{P/E ratio of five years}} \) (1)
In this strategy, one board lot equals to 100 shares. All the buying and selling occurs on the first trading day of the subsequent month. If P is smaller than 30%, buy 200 board lots of HSI ETF. If P is larger than 30% and smaller than 50%, buy 100 lots. If P is larger than 50% and smaller than 70%, hold the shares. If P is larger than 70%, sell 200 lots.
Overall, P/E ratio has fluctuated a lot during the last ten years. However, it shows no significant change in volatility frequency or only demonstrates an upward or downward trend. Therefore, this paper focus on building the long-term trading strategy.
3. Results and Discussion
3.1. Statistics Description
Figure 1 shows the closing price of Hang Seng Index from 1/1/2013 to 31/12/2022. The line chart demonstrates the trends over time. Most of the index points fluctuate between 15000 and 35000. The index shows a downward trend from 2018 and reaches the lowest value around 2022. It rises until the end of 2022.
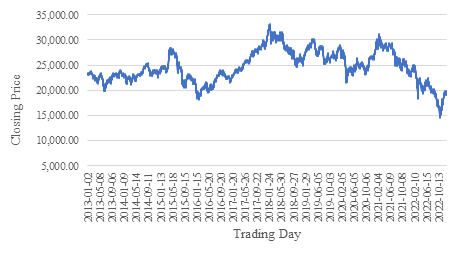
Figure 1: Hang Seng Index (1/1/2013-31/12/2022).
Figure 2 shows forward P/E ratio of Hang Seng Index from 2013 to 2022. P/E ratio reaches to the peak in 2020 and then significantly drop down till 2022. The overall P/E ratio performance is relatively stable with most of data between 8 and 14.
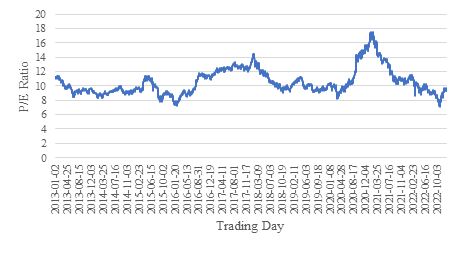
Figure 2: HSI P/E ratio (1/1/2013-31/12/2022).
Figure 3 shows the opening price and closing price of HSI ETF. The trend between ETF price and HSI is almost the same. The price fluctuates between 1 and 1.6. The increase from 2016 to 2018 is relatively fast and it drops from 2021.
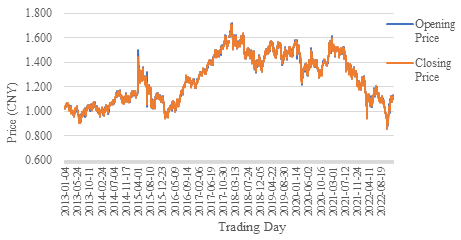
Figure 3: HSI ETF (1/1/2013-31/12/2022).
3.2. Empirical Analysis
Result Analysis. In order to examine the feasibility of the strategy, the data from 2013 to 2022 is applied to calculate the rate of return. Table 1 shows the data of cumulative investment, investment amount, profit and rate of return. Total rate of return is 4.83%, which is a little larger than U.S. 10-Year Treasury Yield, 3.64%. There is no investment chance in 2018 and 2021, for their P/E ratio is relatively high, which is considered to be overvalued.
Table 1: Basic data of year, investment amount and rate of return.
Year | Cumulative Inv. | Investment Amount | Profit(CNY) | Return rate |
2018 | 0 | 0 | 0 | 0 |
2019 | 2,100 | 306,400 | 19,520 | 6.37% |
Table 1:(continued).
2020 | 4,100 | 276,720 | 9,480 | 3.43% |
2021 | 4,100 | 0 | -2,803 | 0 |
2022 | 5,600 | 160,420 | 9,680 | 6.03% |
Total | 5,600 | 743,540 | 35,877 | 4.83% |
Strategy Improvement. From Figure 3, it can be seen that the overall price trend is downward since 2018. It makes the strategy difficult to capture the downward trend of price changes only through the P/E ratio. In addition, the five-year difference between the maximum and minimum values does not reflect the distribution of P/E. For example, P/E ratio fluctuated around 11 times in 2016. But it increased significantly in 2017. Five-year performance of P/E ratio may be too long to make great profit. Therefore, to improve this strategy, the performance (P) measures the P/E ratio with the last one year instead of the last five years.
The data in Table 2 is the result of nine years’ backtesting after improvement. The total rate of return increases from 4.83% to 5.51%. Especially, the highest rate of return almost reaches 25%. Through adjustments, there are no investment losses occurring in 2021. In addition, there is also no investment in 2017, for P/E ratio in 2017 is much larger than its in 2016, which indicates that the price may be overvalued. However, according to the figure 3, the price in 2017 continues to rise, which shows that the Hong Kong stock market has investment potential. Investors loses an opportunity to make profits in 2017. Moreover, the result indicates that even though the investment strategy based on P/E ratio is able to make investors profitable, the information provided by P/E ratio is not enough to capture the overall market situation. Therefore, the strategy can be improved better with more indicators and parameters.
Table 2: Year, investment amount and rate of return.
Year | Cumulative Investment | Investment Amount (CNY) | Profit (CNY) | Rate of Return |
2014 | 800 | 82,770 | 5,530 | 6.68% |
2015 | 2,000 | 134,300 | 5,870 | 4.37% |
2016 | 2,700 | 71,320 | 17,340 | 24.31% |
2017 | 2,700 | 0 | 0 | 0 |
2018 | 4,200 | 219,240 | -90 | -0.04% |
2019 | 6,600 | 352,500 | 21,180 | 6,01% |
2020 | 8,100 | 204,660 | 9,540 | 4.66% |
2021 | 8,100 | 0 | 0 | 0 |
2022 | 9,000 | 97,460 | 4,600 | 4.72% |
Total | 9,000 | 1,162,180 | 64,970 | 5.51% |
4. Conclusion
This research develops an investment strategy of Hang Seng Index ETF based on HSI P/E ratio. This strategy helps investors get profits and reduce losses. P/E ratio, as a predictive indicator, plays an important role in investing Hong Kong stock market, which makes the strategy feasible. By empirical analysis, the rate of return could reach nearly 5%. With the improvement of the strategy, the rate of return increased to 5.51% and the loss was close to zero.
According to the improvement, the indicator built in this strategy didn’t show the distribution of historical P/E ratio. Therefore, investors would lose a lot of information that might help predict price. Hence, the strategy applied one-year data instead of original five-year data to reduce the negative impact of missing information. The increase of return rate indicates that the improvement is useful and the opportunities to arbitrage in the market also increase.
P/E ratio is suitable for long-term trading. Its features determine that P/E ratio is not a well-performed indicator in High-Frequency Trading. This article contributes to development of long-term investment strategy as a reference and examines how much effect the P/E ratio has in the strategy. The strategy can also be applied to HSI future and other relative funds.
References
[1]. Francis, N. S.: Price-Earnings Ratios. Financial Analysts Journal 16(4), 43-45 (1960).
[2]. 2.Park, S.: The Business Cycle, and Timing the Stock Market. Journal of Porfolio Management 47(8), 165-183 (2021).
[3]. Zhong, G. H.: Hang Seng Index Price-earnings Ratio Mean Regression Problem. Times Finance 681(35), 173-174 (2017).
[4]. Shen, P.: The P/E Ratio and Stock Market Performance. Economic Review 85(4), 23-36 (2000).
[5]. Ang, A., Bekaert, G.: Stock Return Predictability: Is It There?. The Review of Financial Studies 20(3), 651-707 (2007).
[6]. Kumar, P.: Impact of Earning Per Share and Price Earnings Ratio on Market Price of Share: A Study on Auto Sector in India. International Journal of Research 5(2), 113-118 (2017).
[7]. Wisniewski, T. P., Lightfoot, G., Lilley. S.: Speculating on presidential success: exploring the link between the price-earnings ratio and approval ratings. Journal of Economics and Finance 36, 106-122 (2012).
[8]. Yan, X., Yang, H., Hou, C., Zhang, S., Zhu, P.: Portfolio optimization by price-to-earnings ratio network analysis. International Journal of Mordern Physics B 36(19), 2250107 (2022).
[9]. Nathan, S., Sivakumar, K., Vijayakumar, J.: Returns to Trading Strategies Based on Price-to-Earnings and Price-to-Sales Ratios. The Journal of Investing 10(2), 17-28 (2001).
[10]. Saputra, F.: Analysis Effect Return on Assets (ROA), Return on Equity (ROE), and Price Earning Ratio (PER) on Stock Prices of Coal Companies in the Indonesia Stock Exchange (IDX) Period 2018-2021. Dinasti International Journal of Economics, Finance & Accounting 3(1), 82-94 (2022).
Cite this article
Xue,L. (2023). Research on Investment Strategy of Hang Seng ETF Based on Hang Seng Index’s P/E Ratio. Advances in Economics, Management and Political Sciences,39,194-199.
Data availability
The datasets used and/or analyzed during the current study will be available from the authors upon reasonable request.
Disclaimer/Publisher's Note
The statements, opinions and data contained in all publications are solely those of the individual author(s) and contributor(s) and not of EWA Publishing and/or the editor(s). EWA Publishing and/or the editor(s) disclaim responsibility for any injury to people or property resulting from any ideas, methods, instructions or products referred to in the content.
About volume
Volume title: Proceedings of the 7th International Conference on Economic Management and Green Development
© 2024 by the author(s). Licensee EWA Publishing, Oxford, UK. This article is an open access article distributed under the terms and
conditions of the Creative Commons Attribution (CC BY) license. Authors who
publish this series agree to the following terms:
1. Authors retain copyright and grant the series right of first publication with the work simultaneously licensed under a Creative Commons
Attribution License that allows others to share the work with an acknowledgment of the work's authorship and initial publication in this
series.
2. Authors are able to enter into separate, additional contractual arrangements for the non-exclusive distribution of the series's published
version of the work (e.g., post it to an institutional repository or publish it in a book), with an acknowledgment of its initial
publication in this series.
3. Authors are permitted and encouraged to post their work online (e.g., in institutional repositories or on their website) prior to and
during the submission process, as it can lead to productive exchanges, as well as earlier and greater citation of published work (See
Open access policy for details).
References
[1]. Francis, N. S.: Price-Earnings Ratios. Financial Analysts Journal 16(4), 43-45 (1960).
[2]. 2.Park, S.: The Business Cycle, and Timing the Stock Market. Journal of Porfolio Management 47(8), 165-183 (2021).
[3]. Zhong, G. H.: Hang Seng Index Price-earnings Ratio Mean Regression Problem. Times Finance 681(35), 173-174 (2017).
[4]. Shen, P.: The P/E Ratio and Stock Market Performance. Economic Review 85(4), 23-36 (2000).
[5]. Ang, A., Bekaert, G.: Stock Return Predictability: Is It There?. The Review of Financial Studies 20(3), 651-707 (2007).
[6]. Kumar, P.: Impact of Earning Per Share and Price Earnings Ratio on Market Price of Share: A Study on Auto Sector in India. International Journal of Research 5(2), 113-118 (2017).
[7]. Wisniewski, T. P., Lightfoot, G., Lilley. S.: Speculating on presidential success: exploring the link between the price-earnings ratio and approval ratings. Journal of Economics and Finance 36, 106-122 (2012).
[8]. Yan, X., Yang, H., Hou, C., Zhang, S., Zhu, P.: Portfolio optimization by price-to-earnings ratio network analysis. International Journal of Mordern Physics B 36(19), 2250107 (2022).
[9]. Nathan, S., Sivakumar, K., Vijayakumar, J.: Returns to Trading Strategies Based on Price-to-Earnings and Price-to-Sales Ratios. The Journal of Investing 10(2), 17-28 (2001).
[10]. Saputra, F.: Analysis Effect Return on Assets (ROA), Return on Equity (ROE), and Price Earning Ratio (PER) on Stock Prices of Coal Companies in the Indonesia Stock Exchange (IDX) Period 2018-2021. Dinasti International Journal of Economics, Finance & Accounting 3(1), 82-94 (2022).