


1. Introduction
Executives are critical to a company's success since they are the ones that determine the strategy and make the critical choices. The right benefits package will enable executives to better perform their roles and maintain their motivation and satisfaction with the company. Most countries pay their executives dozens of times more than ordinary employees, some people see this as a waste. Others believe that executive pay motivates companies to grow. So, the relationship between executive pays and corporate performance has always been a matter of debate [1]. Although a large number of articles have appeared on the correlation between executive compensation and corporate performance, there is still no definitive conclusion on the topic, with some believing that the two are unrelated and others believing that they are related [2-4]. This paper analyzes whether there is a correlation between executive compensation and corporate performance of listed companies based on data and, based on the results of the data analysis, makes recommendations for future corporate executive compensation policies. The data is selected from the financial statements of 30 high-profile, high-performing listed companies.
This paper combines theoretical and empirical analyses to develop hypotheses based on relevant literature and theory, and to draw conclusions about the correlation between listed companies and corporate performance.
2. Theoretical and methodological techniques
2.1. Executive Compensation
Senior management refers to those in the company's management who hold important positions, are responsible for the company's management, and have access to important information about the company, such as management staff, deputy managers, financial officers, the secretary of the board of directors of the listed company, and other individuals as defined in the company's articles of association. Executive compensation, often known as executive pay, refers to a company's top executives, senior management, and executive-level workers receiving remuneration packages suited to their needs. In addition to this, the paper also uses the average compensation of corporate executives. Definition of average company compensation: average salary per executive, total salary divided by the number of executives.
2.2. Corporate performance
The operational efficiency of an enterprise and the performance of its operators throughout a certain operating period are referred to as enterprise performance. Profitability, asset operation level, solvency, and eventual development potential are the major indicators of business efficiency.
This paper uses basic accounting indicators to measure business performance, such as return on equity (ROE), return on asset (ROA), operating margin, sales and operating growth, and total assets growth. All data from company reports. The following formulas are required for data processing.
ROE= \( \frac{net income}{shareholder{s^{ \prime }}equity} \)
ROA= \( \frac{A fir{m^{ \prime }}sbet income }{the average of its total assets} \)
Operating growth= \( \frac{(previous revenue- current revenue) }{perio{d^{ \prime }}s revenue} \)
Operating margin= \( \frac{operating earnings}{revenue} \)
Growth of assets = \( \frac{the growth of assets}{the period of assets} \)
3. Correlation analysis of variables
Table 1. kendall’s related
Kendall’s related - standard format | |
executive compensation $ | |
ROE% | 0.087 |
ROA% | -0.122 |
Operating margin% | -0.26 |
operating growth% | -0.039 |
Growth of assets% | -0.191 |
* p<0.05 ** p<0.01 | |
From the table 1, we can see that the correlation between average executive compensation and ROE, ROA, sales (operating) margin, sales (operating) growth rate and total assets growth rate is investigated by using correlation analysis and the Kendall correlation coefficient to indicate the strength of the correlation. Specific analysis shows that the correlation coefficient between average executive compensation and ROE is 0.087, which approaches zero, and the value of P is 0.646>0.05, thus indicating that there is no correlation between average executive compensation and ROE. The correlation coefficient between average executive compensation and ROA is -0.122, which approaches 0, and the value of P is 0.520>0.05, so indicating that there is no correlation between average executive compensation and ROA. The correlation coefficient between average executive compensation and sales (operating) margin is -0.260, which is close to 0, and the p-value is 0.166>0.05, so indicating that there is no correlation between average executive compensation and sales (operating) margin. The correlation coefficient between average executive compensation and sales (operating) margin is -0.039, which approaches 0, and the p-value is 0.837>0.05, thus indicating that there is no correlation between average executive compensation and sales (operating) margin. The correlation coefficient between average executive compensation and total assets growth is -0.191, which approaches 0, and the value of P is 0.312>0.05, so indicating that there is no correlation between average executive compensation and total assets growth.
Scatterplot: Use each indicator of corporate performance to create a scatterplot against executive compensation.
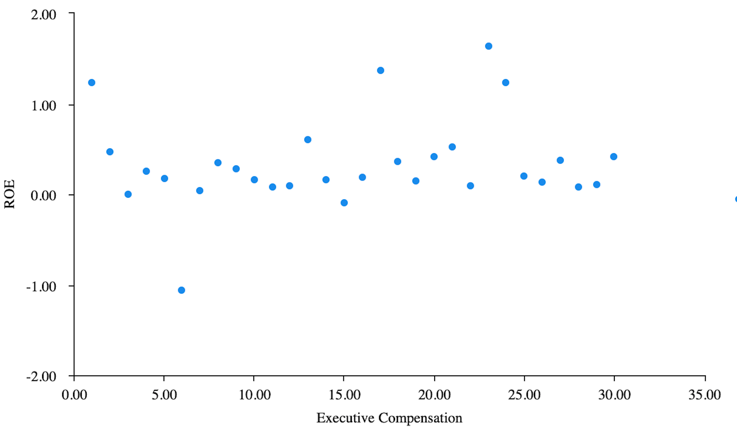
Fig.1. Scatterplot of executive compensation and ROE
Figure 1 shows that the scattered data prior fit formula is ROE = 0.191 + 0.009*executive compensation with an \( {R^{2}} \) of 0.026.
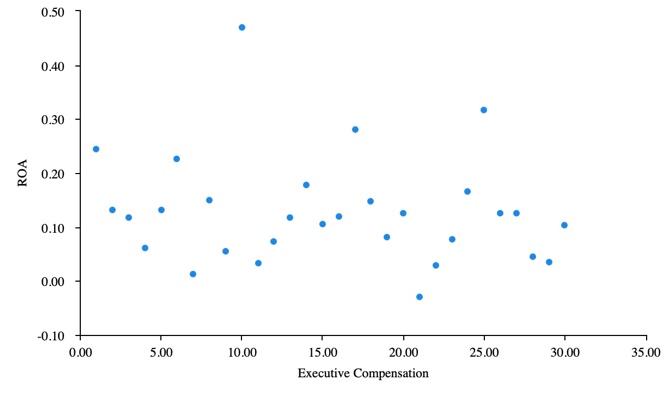
Fig.2. Scatterplot of executive compensation and ROA
As shown as in figure 2, the linear fit formula for scattered data is ROA = 0.157-0.002*Executive Compensation with an \( {R^{2}} \) value of 0.026
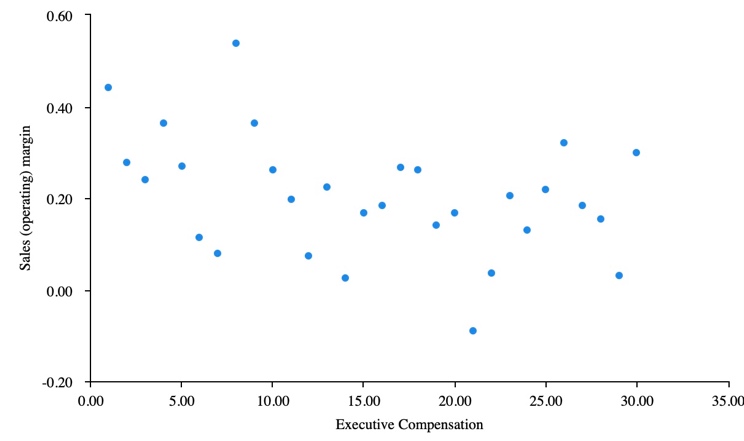
Fig.3. Scatterplot of executive compensation and Sale(operating)margin
Figure 3 shows that the linear fit formula for scattered data is Sales (operating) margin = 0.291-0.006*Executive Compensation, with an R-squared value of 0.141.
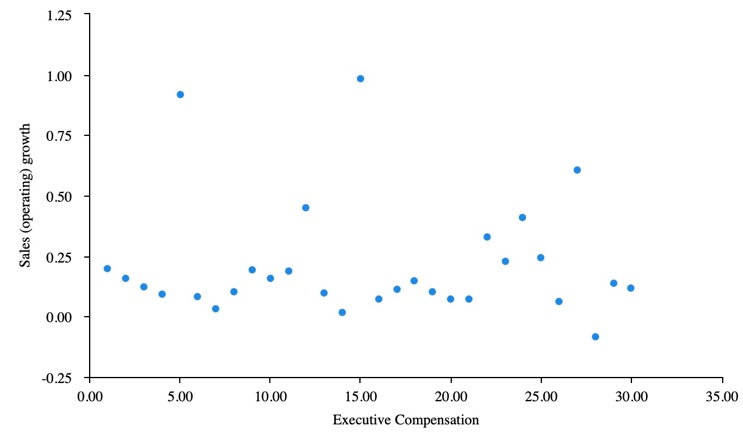
Fig.4. Scatterplot of executive compensation and Sale(operating)growth
Figure 4 shows that the linear fit formula for scattered data is: Sales (operating) growth = 0.234-0.001*Executive Compensation with an R-squared value of 0.002.
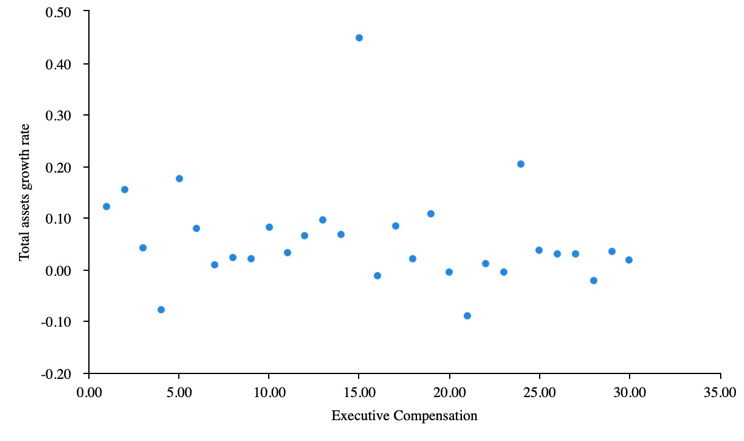
Fig.5. Scatterplot of executive compensation and Toal assets growth rate
Figure 5 shows that the scattered data linear fit formula is: Total assets growth rate = 0.091-0.002*Executive Compensation, with an R-squared value of 0.034.
As seen in the five figures above, the fit between executive compensation and the five indicators in corporate performance is low as they all have an R-squared close to 0.
Analysis of the above data shows that the correlation between executive compensation and corporate performance is not very significant, including the effect of executive compensation on five common indicators of corporate performance. In the following we are going to use a linear regression model to verify the impact of corporate performance on executive compensation.
Table 2. Linear regression analysis results(n=30)
Non-standardized coefficients | Normalized coefficients | t | p | VIF | R ² Adjustment of \( {R^{2}} \) F | R ² | F | ||
B | standard error | Beta | |||||||
constant | 20.045 | 3.537 | - | 5.667 | 0.000** | - | 0.238 0.079. F(5,24)=1.500 P=0.277 | 0.079 | F (5,24)=1.500,p=0.227 |
ROE% | 4.519 | 3.204 | 0.259 | 1.41 | 0.171 | 1.06 | |||
ROA | 1.804 | 17.555 | 0.021 | 0.103 | 0.919 | 1.271 | |||
Operating margin% | -28.8 | 13.094 | -0.428 | -2.2 | 0.038* | 1.191 | |||
Growth of assets% | -21.712 | 23.574 | -0.242 | -0.921 | 0.366 | 2.174 | |||
operating growth% | 4.211 | 9.202 | 0.116 | 0.458 | 0.651 | 2.034 | |||
Dependent variable: Executive remuneration | |||||||||
D-W:2.123 | |||||||||
* p<0.05 ** p<0.01 | |||||||||
From the above table 2, Total assets growth rate, Sales (operating) margin, Sales (operating) growth, ROA, ROE are taken as independent variables and Executive Compensation is taken as dependent variable for linear regression analysis. Executive Compensation = 20.045 - 21.712*Total assets growth rate - 28.800*Sales (operating) margin + 4.211*Sales (operating) growth + 1.804*ROA + 4.519*ROE, the model R-squared value is 0.238, implying that Total assets growth rate, Sales (operating) margin, Sales (operating) growth, ROA, ROE can explain 23.8% of the variation in Executive Compensation of 23.8%. An F-test of the model revealed that the model did not pass the F-test (F=1.500, p=0.227>0.05), which means that Total assets growth rate, Sales (operating) margin, Sales (operating) growth, ROA, ROE do not have an effect on Executive Compensation and therefore the influence of the independent variables on the dependent variable cannot be specifically analyzed. Therefore the effect of the five indicators of corporate performance on executive compensation is also not significant.
4. Research findings
This paper examines the relationship between executive compensation and firm performance. The results of the study show that there is no significant correlation between executive compensation and company performance of listed companies. Based on previous research, we venture a speculate that there are some reasons why the correlation is not significant. The first is that the remuneration incentive policy for executives of listed companies is not perfect and does not have the desired effect. A good executive compensation policy is one that aligns the behavior of executives with that of the company. Poor remuneration policies can lead to brain drain, loss of motivation and misalignment of objectives[5]. That's why we can't ignore our executive remuneration policy. A second reason is likely to be influenced by national regulations. For example, in the US, federal requirements mandate that every publicly traded firm report the amount and type of compensation paid to its CEO, CFO, and other executives, as well as the criteria used to determine remuneration. This requirement therefore leads many boards to look at a large amount of data on executive remuneration when making remuneration decisions. Most companies try to keep up with the salaries offered by their peers to prevent brain drain, which would lead to a situation where most similar types and sizes of companies do not differ much in terms of executive compensation. The relationship between executive compensation and corporate performance is therefore not very significant. Another reason is that it is affected by unforeseen events. For example, the new crown epidemic, the Russian-Ukrainian war, unstable demand, including some other unforeseen events beyond the control of executives[6].
5. Recommendations
This section intends to draw on the experience of others in an attempt to make recommendations for listed companies [7].
Incentive compensation should be based on metrics.
A common mistake in incentive pay policies is the promise of pay that is not tied to a specific metric. The operational efficiency of an enterprise and the performance of its operators throughout a certain operating period are referred to as enterprise performance. Profitability, asset operation level, solvency, and eventual development potential are the major indicators of business efficiency.
Full communication with senior management
Companies should ensure that the compensation plan is known to an executive and that each executive is well-versed in the elements that make up his or her salary package. Progress on the remuneration plan should take place at least once a year, outlining short and long-term incentives. A quarterly message in which essential indicators relating to the incentives are addressed is a better approach. This can help avoid any misunderstandings before incentives are given out.
C). A robust performance appraisal system, which facilitates a productive working atmosphere, aligns individual goals with company objectives and promotes the development of executives themselves. Performance appraisals are an investment in human capital that promotes the development of employees.
D). Company managers should not only improve their executive compensation policies, but also make quick decisions when big events arise to protect the company's interests to the maximum.
6. Conclusion
According to the above study, the correlation between executive compensation and company performance is not significant. The reason for this result may be due to poor executive compensation incentive policies and unexpected events. This paper only focuses on the wage and salary aspect of executive compensation and five indicators of firm performance [8]. In future studies, more data such as stock options in executive compensation should be selected and a larger sample should be used rather than just being limited to one year of data [8].
References
[1]. Wang, C., Zhang, S., Ullah, S., Ullah, R., & Ullah, F. (2021). Executive compensation and corporate performance of energy companies around the world. Energy Strategy Reviews, 38, 100749. doi: 10.1016/j.esr.2021.100749
[2]. Conyon, M., Gregg, P., & Machin, S. (1995). Taking Care of Business: Executive Compensation in the United Kingdom. The Economic Journal, 105(430), 704. doi: 10.2307/2235029
[3]. Conyon, Martin J., and Lerong He. "Executive compensation and corporate governance in China." Journal of Corporate Finance 17.4 (2011): 1158-1175.
[4]. Murphy, Kevin J. "Corporate performance and managerial remuneration: An empirical analysis." Journal of accounting and economics 7.1-3 (1985): 11-42.
[5]. Compensation Packages That Actually Drive Performance. (2022). Retrieved 28 May 2022, from https://hbr.org/2021/01/compensation-packages-that-actually-drive-performance
[6]. Barkema, H., & Gomez-Mejia, L. (1998). MANAGERIAL COMPENSATION AND FIRM PERFORMANCE: A GENERAL RESEARCH FRAMEWORK. Academy Of Management Journal, 41(2), 135-145. doi: 10.2307/257098
[7]. 5 Keys To Effective Executive Compensation. (2022). Retrieved 28 May 2022, from https://chiefexecutive.net/5-keys-to-effective-executive-compensation/
[8]. Murphy, K. (1985). Corporate performance and managerial remuneration. Journal Of Accounting And Economics, 7(1-3), 11-42. doi: 10.1016/0165-4101(85)90026-6
Cite this article
Zhang,X. (2023). Analysis of the Correlation Between Executive Compensation and Corporate Performance in Listed Companies. Advances in Economics, Management and Political Sciences,3,609-615.
Data availability
The datasets used and/or analyzed during the current study will be available from the authors upon reasonable request.
Disclaimer/Publisher's Note
The statements, opinions and data contained in all publications are solely those of the individual author(s) and contributor(s) and not of EWA Publishing and/or the editor(s). EWA Publishing and/or the editor(s) disclaim responsibility for any injury to people or property resulting from any ideas, methods, instructions or products referred to in the content.
About volume
Volume title: Proceedings of the 6th International Conference on Economic Management and Green Development (ICEMGD 2022), Part Ⅰ
© 2024 by the author(s). Licensee EWA Publishing, Oxford, UK. This article is an open access article distributed under the terms and
conditions of the Creative Commons Attribution (CC BY) license. Authors who
publish this series agree to the following terms:
1. Authors retain copyright and grant the series right of first publication with the work simultaneously licensed under a Creative Commons
Attribution License that allows others to share the work with an acknowledgment of the work's authorship and initial publication in this
series.
2. Authors are able to enter into separate, additional contractual arrangements for the non-exclusive distribution of the series's published
version of the work (e.g., post it to an institutional repository or publish it in a book), with an acknowledgment of its initial
publication in this series.
3. Authors are permitted and encouraged to post their work online (e.g., in institutional repositories or on their website) prior to and
during the submission process, as it can lead to productive exchanges, as well as earlier and greater citation of published work (See
Open access policy for details).
References
[1]. Wang, C., Zhang, S., Ullah, S., Ullah, R., & Ullah, F. (2021). Executive compensation and corporate performance of energy companies around the world. Energy Strategy Reviews, 38, 100749. doi: 10.1016/j.esr.2021.100749
[2]. Conyon, M., Gregg, P., & Machin, S. (1995). Taking Care of Business: Executive Compensation in the United Kingdom. The Economic Journal, 105(430), 704. doi: 10.2307/2235029
[3]. Conyon, Martin J., and Lerong He. "Executive compensation and corporate governance in China." Journal of Corporate Finance 17.4 (2011): 1158-1175.
[4]. Murphy, Kevin J. "Corporate performance and managerial remuneration: An empirical analysis." Journal of accounting and economics 7.1-3 (1985): 11-42.
[5]. Compensation Packages That Actually Drive Performance. (2022). Retrieved 28 May 2022, from https://hbr.org/2021/01/compensation-packages-that-actually-drive-performance
[6]. Barkema, H., & Gomez-Mejia, L. (1998). MANAGERIAL COMPENSATION AND FIRM PERFORMANCE: A GENERAL RESEARCH FRAMEWORK. Academy Of Management Journal, 41(2), 135-145. doi: 10.2307/257098
[7]. 5 Keys To Effective Executive Compensation. (2022). Retrieved 28 May 2022, from https://chiefexecutive.net/5-keys-to-effective-executive-compensation/
[8]. Murphy, K. (1985). Corporate performance and managerial remuneration. Journal Of Accounting And Economics, 7(1-3), 11-42. doi: 10.1016/0165-4101(85)90026-6