


1 Introduction
Nike remains to be famously known in the sports industry as a significantly dominant firm. When the COVID pandemic swept the world in 2019, many people feared for its future, but Nike has successfully recovered from its impacts and maintains to be one of the most influential firms in the sportswear market. However, although it is apparent that Nike remains powerful, it is of great curiosity as to what extent its financial performance has been negatively affected by COVID-19, and its competitiveness toward other companies. In this paper, the use of ratio analysis will be utilized based on Nike’s income statements and balance sheets between the years 2019-2021 to vertically compare its performance before, during, and after COVID. Then, they will be horizontally compared to the same ratios of Adidas and Puma, two of Nike’s primary competitors, to examine the relative performance of Nike. The ratios that will be used in this paper are mainly 3 types: Profitability ratios such as Return on Equity (ROE), Return on Assets (ROA), and Earnings per Share (EPS); Efficiency ratios such as Asset Turnover, Inventory Turnover, and Working Capital Turnover; and finally Liquidity ratios such as the Current Ratio. This paper is worthy of investigation because it reveals precise aspects that constitute Nike’s successful recovery. The study of its ratios will give businesses and firms further insight into its success, and can potentially benefit business owners as they understand and work to improve their financial accounts in a similar fashion to achieve such a success.
2 Analysis of Nike’s Performance Based on Its Financial Accounts and Ratios
2.1 Profitability Ratios
Profitability ratios are metrics that evaluate the ability of a firm to generate revenue relative to its revenue, balance sheet assets, operating costs, and shareholder’s equity. [1] In which, three of the ratios, namely, ROE, ROA, and EPS, are calculated using the following methods respectively.
\( ROE=\frac{Net Income}{Shareholde{r^{ \prime }}s Equity}×100 \) , which compares the firm’s income to shareholder’s investment.
\( ROA=\frac{Net Income}{Total Assets}×100 \) , which indicates how profitable a company is relative to its total assets. [2]
\( EPS=\frac{Net Income}{Shares Outstanding} \) , which values the monetary earnings per common stock for a company. [2]
Based on these equations, we can calculate the ratios using the relevant data and Nike’s Income Statement and Balance Sheet.
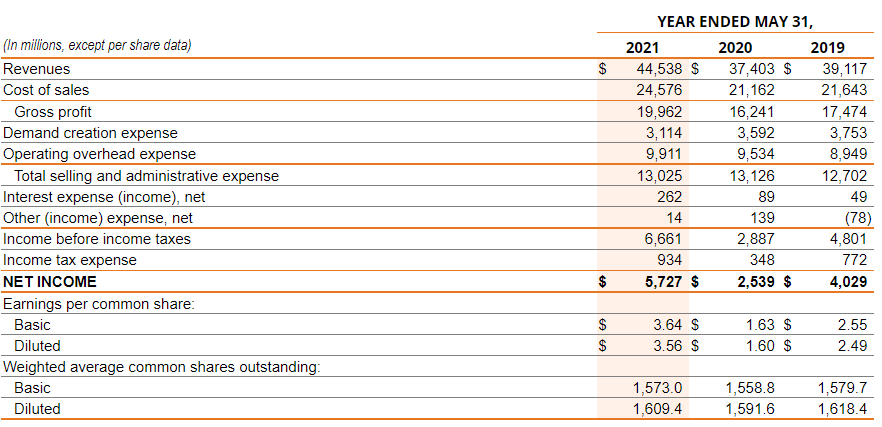
Fig. 1. Nike, Inc. Consolidated Statements of Income [3]
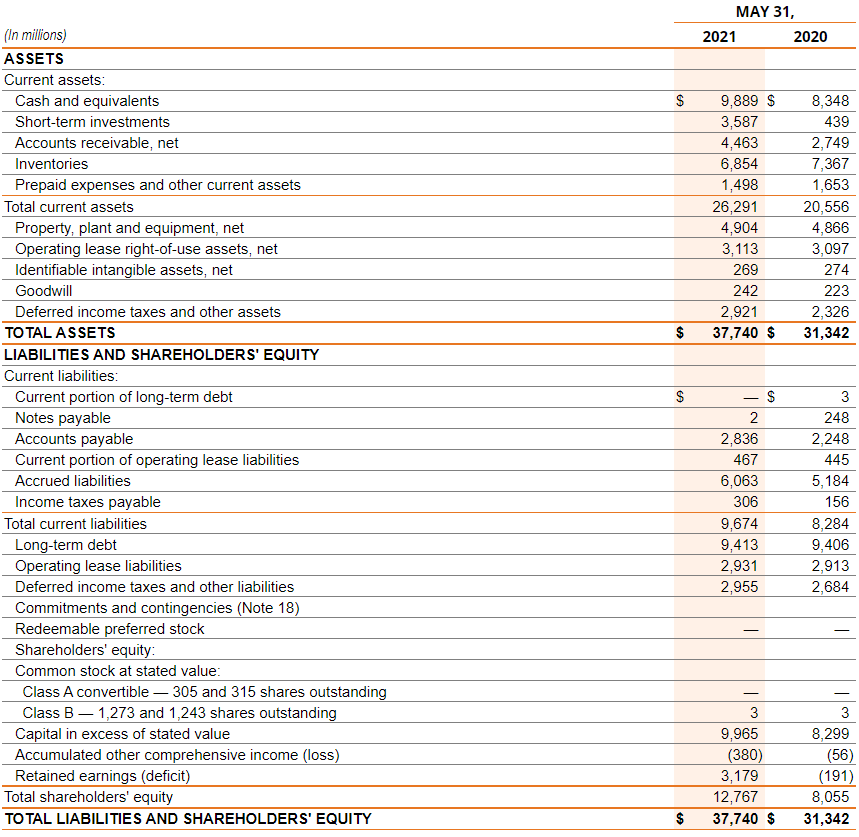
Fig. 2. Nike, Inc. Consolidated Balance Sheets [3]
Therefore, we can compute the profitability ratios of Nike using figures 1 and 2.
Comparison of Nike’s Profitability Ratios to Its Previous Years. By comparing Nike’s profitability ratios to its previous years, we can determine whether its ability to generate revenue has been impacted by COVID-19.
Table 1. Nike’s profitability ratios [3]
Nike’s profitability ratios | |||
1. ROE | |||
Year | 2019 | 2020 | 2021 |
Percentage | 44.6% [2] | 31.5% | 44.9% |
2. ROA | |||
Year | 2019 | 2020 | 2021 |
Percentage | 17.0% [2] | 8.1% | 15.2% |
3. EPS | |||
Year | 2019 | 2020 | 2021 |
Value | $2.55 | $1.63 | $3.64 |
As shown in Table 1, there has clearly been a decrease in the size of the ratios from 2019 to 2020, followed by an increase from 2020 to 2021. The large increases in both ROE and ROA show that it has gained more revenue per unit of total assets or shareholder’s equity, and therefore that Nike’s efficiency has increased considerably following the pandemic. It has improved its ability to utilize its assets to generate revenue, showing shareholders that it is worth investing into the company. The drastic falls in ratios in 2020 demonstrate the impact of COVID on Nike, severely decreasing its revenue and therefore net income, significantly reducing ROE, ROA, and EPS. During the pandemic, the demand for sportswear products drastically fell, explaining the decrease in EPS. It should be noticed that ROE recovered to levels similar to 2019, pre-pandemic, while ROA is still short of 1.8% compared to 2019. EPS, on the other hand, has increased to levels surpassing 2019’s values, showing that Nike has successfully recovered. Generally, Nike has shown better performance compared to before the pandemic in 2019, and a healthy recovery from low ratios in 2020.
Compared to Adidas and Puma. Comparing these ratios against Nike’s competitors, Adidas, and Puma, provides a better perspective of the company’s relative performance in the industry.
Fig. 3. ROE of Nike, Adidas, and Puma 2020-2021 [4,5,6,7]
Fig. 4. ROA of Nike, Adidas, and Puma 2020-2021 [4,5,6,7]
Fig. 5. EPS of Nike, Adidas, and Puma 2019-2021 [4,5]
It is shown that for ROE and ROA, Nike has larger values than both Adidas and Puma for both years 2020 and 2021. Ranking them, Nike has the largest values, followed by Adidas, then Puma. This reflects their revenue-generating efficiencies respectively, with Nike being the most efficient. For EPS, Adidas has the highest dollar values out of the 3 companies, performing much better than Nike. However, it is also much more volatile, with its EPS dropping almost 80% during the pandemic, whilst Nike maintained relatively stable and recovered by a higher proportion.
Comprehensive Analysis of Nike’s Profitability Ratios. In general, Nike’s ratios have experienced an overall trend of decrease in 2020 due to impacts from COVID and falling demand and reduced net income, followed by a considerable increase in 2021, recovering from the crisis and back to high levels of growth and returns. Sales have most likely bounced back because of pent-up demand during COVID. In 2021, the majority of Nike’s profitability ratios have increased back to pre-pandemic levels, or even higher. Vertically comparing, Nike has been improving its performance and is more efficient than before, generating more revenue with its assets and equity. This will please investors as they are getting favorable returns compared to their costs. Horizontally comparing, Nike’s ratios are all larger than those of Adidas and Puma, apart from EPS. It can therefore be deduced that Nike is generally more efficient than them, and more stable too, with relatively little fluctuation. In terms of profitability, Nike is superior to Adidas and Puma, and is the highest in the past 3 years.
2.2 Efficiency Ratios
Efficiency ratios are metrics that evaluate how effectively a firm is utilizing its assets and liabilities. [8] In which, Asset Turnover, Inventory Turnover, and Working Capital Turnover are calculated using the following methods respectively.
\( Asset Turnover=\frac{Revenue}{Total Assets} \) , which measures the efficiency of a company’s use of its assets.
\( Inventory Turnover=\frac{Cost of Sales}{Inventories} \) , which measures the number of times inventory is sold or used within a certain period of time.
\( Working Capital Turnover=\frac{Revenue}{Current Assets−Current Liabilities} \) , which measures how the company is using its working capital to support its sales. [2]
Therefore, we can calculate the efficiency ratios for Nike.
Comparison of Nike’s Efficiency Ratios to Its Previous Years.
Table 2. Nike’s Efficiency ratios
Nike’s Efficiency ratios | |||
1. Asset Turnover | |||
Year | 2019 | 2020 | 2021 |
Percentage | 1.69 | 1.36 | 1.29 |
2. Inventory Turnover | |||
Year | 2019 | 2020 | 2021 |
Percentage | 3.98 | 3.26 | 3.46 |
3. Working Capital Turnover | |||
Year | 2019 | 2020 | 2021 |
Value | 4.52 | 3.04 | 2.68 |
As seen from Table 2, Nike’s efficiency ratios mostly follow a decreasing trend throughout the three-year period. Examining asset turnover, Nike’s efficiency has been consistently falling, with a large decrease between 2019 and 2020. From Nike’s balance sheets, it can be seen that Nike has been increasing its total assets, while revenue has grown in a smaller proportion, resulting in the decrease of asset turnover. It can be reasonably inferred that Nike has chosen to acquire more assets in order to maintain production levels in trying times, in hopes that revenue will increase further in future years as the effect of COVID weakens.
For inventory turnover, it follows the same trend as Nike’s profitability ratios – fall 2020 and rise in 2021. This suggests that Nike is having trouble selling its inventory, which is understandable given the situation presented when demand was low. The rise in 2021 shows that it is beginning to return to its normal levels, which is a good sign.
Finally, for working capital turnover, it also experiences a consistent fall with a particularly large decrease in 2020. During the pandemic, there was high uncertainty among firms, so it is logical to liquidize some of its assets in order to hold more working capital to ensure that they could pay off any unexpected revenue expenditures in the pandemic.
Compared to Adidas and Puma. Below are three diagrams illustrating the respective efficiency ratios of Nike, Adidas, and Puma in years 2019, 2020, and 2021.
Fig. 6. Asset turnover of Nike, Adidas, and Puma 2019-2021 [9,10]
Fig. 7. Inventory turnover of Nike, Adidas, and Puma 2019-2021 [9,10]
Fig. 8. Working capital turnover of Nike, Adidas, and Puma 2019-2021 [9,10]
It is shown that Nike has larger values for both asset and inventory turnovers in the three years, indicating that its efficiency is consistently above that of Adidas and Puma, who have more trouble generating revenue with assets and selling inventories. However, for the working capital turnover, Nike seems to fall short with both companies with the lowest values out of the three. Because of its low values, it did not experience as severe a drop in the ratio as Adidas experienced in 2020, but it can be seen that Nike may have some issues with holding too much working capital on hand.
Comprehensive Analysis of Nike’s Efficiency Ratios. For the efficiency ratios, Nike has experienced a continued decrease, with only inventory turnover undergoing a similar trend as before. The reasons for this are: the bulk purchasing of assets post-pandemic in order to restore a high production level; during the pandemic, Nike would not have found many buyers willing to purchase its inventory; Nike would also most likely have liquidized a sizeable portion of its assets into working capital in order to pay off unexpected revenue expenditures caused by the uncertainty of being in lockdown. Comparing vertically, although its efficiency is constantly falling, the rate of decrease has slowed, which is a good sign as the effects of the pandemic wears off. Comparing horizontally, it is mostly better than its two competitors, apart from the working capital turnover, which is far below both Adidas and Puma. Nike should remain vigilant and work on increasing efficiency ratios for a better performance overall, but so far there is no apparent risk.
2.3 Liquidity Ratios
Liquidity ratios are metrics that evaluate the ability of a debtor to pay off short-term debt obligations using only internal capital.[11] In which, the Current Ratio is calculated using the following method.
\( Current Ratio=\frac{Current Assets}{Current Liabilties} \) , which measures a company’s abilities to pay off short-term obligations.
Therefore, we can calculate the liquidity ratio for Nike.
Comparison of Nike’s Liquidity Ratios to Its Previous Years.
Table 3. Nike’s Liquidity ratios
Nike’s Liquidity ratios | |||
1. Current Ratio | |||
Year | 2019 | 2020 | 2021 |
Value | 2.1 | 2.48 | 2.72 |
In Table 3, a trend different to previous ratios is shown in the current ratio. Here, it seems to be rising consistently during the past three years, instead of decreasing like the other ratios. This shows that Nike has acquired much more current assets, and surpasses its current liabilities by a good portion. There is no doubt in Nike’s ability to pay off its short-term obligations, but the high values of current ratio may suggest that it is inefficiently using its current assets – these assets could be used to generate more revenue instead, meaning that Nike is currently taking on a large opportunity cost by not utilizing these assets. As explained previously, it is sensible that the current ratio increased in 2020, but it remains unclear as to why it has continued to increase in 2021. To determine whether it is ineffectively using its assets, a horizontal comparison is needed.
Compared to Adidas and Puma. Below is the diagram showing the current ratios of Nike, Adidas, and Puma from 2019-2021.
Fig. 9. Current ratio of Nike, Adidas, and Puma 2019-2021
From Figure 9, it is evident that Nike has much larger current ratios than Adidas and Puma, which mostly have their ratios around 1 to 1.5, whereas Nike has values above 2. Adidas and Puma generally have a safe amount of current assets, and can comfortably pay off short-term obligations, utilizing most of its assets. Nike, on the other hand, has an excess amount of current assets in comparison, which suggests that it may have many assets that are idle and not in use. This means that Nike is not fully utilizing its resources to generate revenue, and not reaching their full potential, which could be problematic.
Comprehensive Analysis of Nike’s Liquidity Ratios. Overall, Nike’s current assets have been increasing by a large amount in the past three years, and its current liabilities have been increasing by a slower rate. Since Nike is already extremely safe and capable of paying off its short-term liabilities, the ever-growing ratio suggests that the further increase in current assets may be somewhat unnecessary. Generally, a ratio at 1.5 is most desirable, since it indicates that the company is not only able in paying off short-term debts, but is also efficiently using all of its assets to generate revenue – a value that Adidas and Puma seem to be aiming towards. By comparison, Nike’s values are far too high, showing that much of its assets are not put to good use. Given that its inventory turnover ratio is higher than both Adidas and Puma, inventory not being able to be sold can be safely ruled out as a potential cause. Therefore, this may solely be a managerial complication, and should be sought to be improved in coming years.
3 Conclusion
In this paper, the effects that COVID-19 had on Nike has been shown through the change in its financial ratios. Its recovery and current financial performance is likewise demonstrated through a combined series of vertical and horizontal ratio analysis.
In conclusion, it can be summarized that Nike has successfully recovered from the impacts of COVID, and is maintaining, or even, surpassing its profitability in previous years. The overall outlook on Nike’s financial performance is looking positive, though there is room for improvement. Comparing itself to its main competitors, namely Adidas and Puma, Nike’s profitability, and overall efficiency no doubt surpasses them in general, but certain ratios such as working capital turnover could be aimed to increase in future years. Its main weakness could be the current ratio, where it has too much idle assets on hand which could be put to better use. After the pandemic, it is apparent that Nike remains to be a dominant firm in the sportwear industry, mostly unsurpassed by its competitors with its outstanding financial performance. Although this paper shows the progress and change of Nike’s financial information throughout the past three years, it may not be an extremely accurate depiction of Nike’s financial status as it does not cover a larger time range, which could be considered a limitation. In order to improve the precision of this investigation, a further study could be directed, delving into a specific sportwear product while examining its market and comparing sales vertically and horizontally between firms. For the ratios, Dupont analysis could also be considered where ROE and ROA is involved to show more components that affect the ratio, thereby showing a more detailed, specific analysis.
References
[1]. Hayes, Adam. “The Importance of Profitability Ratios.” Investopedia, Investopedia, 27 Mar. 2022, https://www.investopedia.com/terms/p/profitabilityratios.asp.
[2]. Meng, Sihan, et al. “Analysis of Enterprise Operation under the Impact of Covid-19 Epidemic: A Case Study of Nike Inc..” Proceedings of the 2021 International Conference on Financial Management and Economic Transition (FMET 2021), vol. 190, 2021, pp. 137–145., doi:10.2991/aebmr.k.210917.024.
[3]. “Nike, Inc. Annual Report on Form 10-K.” NKE-20210531, 31 May 2021, https://www.sec.gov/Archives/edgar/data/0000320187/000032018721000028/nke-20210531.htm.
[4]. Journal, Wall Street. “Addyy | Adidas AG ADR Annual Income Statement - WSJ.” The Wall Street Journal, Dow Jones & Company, https://www.wsj.com/market-data/quotes/ADDYY/financials/annual/income-statement.
[5]. Journal, Wall Street. “Addyy | Adidas AG ADR Annual Balance Sheet - WSJ.” The Wall Street Journal, Dow Jones & Company, https://www.wsj.com/market-data/quotes/ADDYY/financials/annual/balance-sheet.
[6]. Journal, Wall Street. “PMMAF | Puma SE Annual Income Statement - WSJ.” The Wall Street Journal, Dow Jones & Company, https://www.wsj.com/market-data/quotes/PMMAF/financials/annual/income-statement.
[7]. Journal, Wall Street. “PMMAF | Puma SE Annual Balance Sheet - WSJ.” The Wall Street Journal, Dow Jones & Company, https://www.wsj.com/market-data/quotes/PMMAF/financials/annual/balance-sheet.
[8]. Kenton, Will. “Efficiency Ratio.” Investopedia, Investopedia, 8 Feb. 2022, https://www.investopedia.com/terms/e/efficiencyratio.asp.
[9]. Adidas AD ADR - Stock Operating Performance ADDYY.” Morningstar, https://www.morningstar.com/stocks/pinx/addyy/performance.
[10]. Puma SE - Stock Operating Performance PUM.” Morningstar, https://www.morningstar.com/stocks/xwbo/pum/performance.
[11]. Hayes, Adam. “What Are Liquidity Ratios?” Investopedia, Investopedia, 8 Feb. 2022, https://www.investopedia.com/terms/l/liquidityratios.asp.
Cite this article
Zhang,M. (2023). Analysis of Nike’s Performance Based on Its Financial Accounts and Ratios. Advances in Economics, Management and Political Sciences,3,616-624.
Data availability
The datasets used and/or analyzed during the current study will be available from the authors upon reasonable request.
Disclaimer/Publisher's Note
The statements, opinions and data contained in all publications are solely those of the individual author(s) and contributor(s) and not of EWA Publishing and/or the editor(s). EWA Publishing and/or the editor(s) disclaim responsibility for any injury to people or property resulting from any ideas, methods, instructions or products referred to in the content.
About volume
Volume title: Proceedings of the 6th International Conference on Economic Management and Green Development (ICEMGD 2022), Part Ⅰ
© 2024 by the author(s). Licensee EWA Publishing, Oxford, UK. This article is an open access article distributed under the terms and
conditions of the Creative Commons Attribution (CC BY) license. Authors who
publish this series agree to the following terms:
1. Authors retain copyright and grant the series right of first publication with the work simultaneously licensed under a Creative Commons
Attribution License that allows others to share the work with an acknowledgment of the work's authorship and initial publication in this
series.
2. Authors are able to enter into separate, additional contractual arrangements for the non-exclusive distribution of the series's published
version of the work (e.g., post it to an institutional repository or publish it in a book), with an acknowledgment of its initial
publication in this series.
3. Authors are permitted and encouraged to post their work online (e.g., in institutional repositories or on their website) prior to and
during the submission process, as it can lead to productive exchanges, as well as earlier and greater citation of published work (See
Open access policy for details).
References
[1]. Hayes, Adam. “The Importance of Profitability Ratios.” Investopedia, Investopedia, 27 Mar. 2022, https://www.investopedia.com/terms/p/profitabilityratios.asp.
[2]. Meng, Sihan, et al. “Analysis of Enterprise Operation under the Impact of Covid-19 Epidemic: A Case Study of Nike Inc..” Proceedings of the 2021 International Conference on Financial Management and Economic Transition (FMET 2021), vol. 190, 2021, pp. 137–145., doi:10.2991/aebmr.k.210917.024.
[3]. “Nike, Inc. Annual Report on Form 10-K.” NKE-20210531, 31 May 2021, https://www.sec.gov/Archives/edgar/data/0000320187/000032018721000028/nke-20210531.htm.
[4]. Journal, Wall Street. “Addyy | Adidas AG ADR Annual Income Statement - WSJ.” The Wall Street Journal, Dow Jones & Company, https://www.wsj.com/market-data/quotes/ADDYY/financials/annual/income-statement.
[5]. Journal, Wall Street. “Addyy | Adidas AG ADR Annual Balance Sheet - WSJ.” The Wall Street Journal, Dow Jones & Company, https://www.wsj.com/market-data/quotes/ADDYY/financials/annual/balance-sheet.
[6]. Journal, Wall Street. “PMMAF | Puma SE Annual Income Statement - WSJ.” The Wall Street Journal, Dow Jones & Company, https://www.wsj.com/market-data/quotes/PMMAF/financials/annual/income-statement.
[7]. Journal, Wall Street. “PMMAF | Puma SE Annual Balance Sheet - WSJ.” The Wall Street Journal, Dow Jones & Company, https://www.wsj.com/market-data/quotes/PMMAF/financials/annual/balance-sheet.
[8]. Kenton, Will. “Efficiency Ratio.” Investopedia, Investopedia, 8 Feb. 2022, https://www.investopedia.com/terms/e/efficiencyratio.asp.
[9]. Adidas AD ADR - Stock Operating Performance ADDYY.” Morningstar, https://www.morningstar.com/stocks/pinx/addyy/performance.
[10]. Puma SE - Stock Operating Performance PUM.” Morningstar, https://www.morningstar.com/stocks/xwbo/pum/performance.
[11]. Hayes, Adam. “What Are Liquidity Ratios?” Investopedia, Investopedia, 8 Feb. 2022, https://www.investopedia.com/terms/l/liquidityratios.asp.