


1. Introduction
Education is a fundamental pillar of society, playing a crucial role in shaping individuals' lives and contributing to the overall development of nations. The academic performance of students is a key indicator of educational outcomes and has significant implications for their future prospects. Understanding the factors that influence student performance is essential for designing effective educational interventions, improving teaching strategies, and fostering a supportive learning environment.
Over the years, extensive research has been conducted to explore the multifaceted nature of student performance. Studies have investigated the influence of various factors, including individual characteristics, socio-economic status, family background, school environment, and teaching practices. These investigations have shed light on the complex interplay between these factors and student outcomes. In recent times, the emergence of advanced data analysis techniques and machine learning algorithms has provided researchers with powerful tools to delve deeper into the analysis of student performance. By leveraging large datasets and employing sophisticated modeling techniques, researchers can uncover hidden patterns, identify predictive factors, and develop models to forecast student performance. Previous studies have extensively explored the factors influencing student performance and the use of advanced data analysis techniques in educational research. Several relevant studies have provided valuable insights into this field. One such study conducted by Iqbal used collaborative filtering (CF), Matrix Decomposition (MF) and Restricted Boltzmann Machine (RBM) technologies to systematically analyze the real data collected from the University of Information Technology (ITU) in Lahore, Pakistan. And a case study was proposed to predict student performance [1]. Another relevant work by Daud collected data on scholarship recipients from different universities in Pakistan with the aim of exploring these feature sets. Research using learning analysis, discrimination, and generative classification models to predict whether students can complete their degrees [2]. Another relevant work by Yan and Au used the classic three-layer feedforward neural network as the machine learning model and uses the proportional conjugate gradient algorithm for training [3]. Furthermore, a study by Yousafzai used to predict student behavior is supervised learning, because it can provide accurate and reliable results. Among them, support vector machine (SVM) algorithm has the most accurate prediction results. In addition, decision tree (DT), naive Bayes (NB) and random forest (RF) algorithms are also widely used and have achieved good results [4].
These studies, among others, have contributed to our understanding of the factors affecting student performance and the utilization of advanced data analysis methods in educational research. Building upon this existing literature, the present study aims to further explore the predictive capabilities of machine learning algorithms in forecasting student performance. In this context, this study aims to contribute to the existing body of research by utilizing advanced data analysis techniques and machine learning algorithms to predict student performance in Mathematics, Reading, and Writing exams. By analyzing a comprehensive dataset, this study seeks to identify the factors that have the most significant impact on student outcomes and develop a predictive model to forecast their exam scores. The results of this study are helpful for educators and can provide valuable insights for them, policymakers, and researchers in their efforts to enhance educational practices and promote equitable and effective learning environments. By understanding the factors that contribute to student performance, stakeholders can develop targeted interventions and strategies to support students' educational journeys and improve overall educational outcomes. This paper aims to predict student performance in Mathematics, Reading, and Writing exams by analyzing a comprehensive dataset that includes student profiles and their exam scores [5].
2. Dataset
The dataset used in this paper was from Kaggle (https://www.kaggle.com/datasets). It is a publicly available dataset created by Mr. Desalegn Gebeyehu. The dataset consists of student profiles and their corresponding exam scores from a public school. The purpose of using this dataset is to analyze the relationship between various factors and student performance in exams. By exploring the dataset, this study can gain insights into the factors that significantly influence test scores and identify any potential interactions among these factors [6]. Some basic information about the dataset is shown in Table 1.
Table 1: Features of the dataset.
Gender | Categorizes the students as male or female. |
EthnicGroup | Represents the ethnic group of the student, labeled as groups A to E. |
ParentEduc | Indicates the educational background of the student's parent(s), ranging from some high school to a master's degree. |
LunchType | Indicates the type of lunch the student receives at school, either standard or free/reduced. |
TestPrep | Indicates whether the student completed a test preparation course or not. |
ParentMaritalStatus | Describes the marital status of the student's parent(s), including categories such as married, single, widowed, or divorced. |
PracticeSport | Reflects the frequency of sports practice for the student. |
IsFirstChild | Indicates whether the student is the first child in the family or not. |
NrSiblings | Represents the number of siblings the student has. |
TransportMeans | Indicates the means of transportation used by the student to travel to school, either school bus or private transportation. |
WklyStudyHours | Represents the number of weekly self-study hours dedicated by the student. |
MathScore | The student's score in the mathematics exam. |
ReadingScore | The student's score in the Reading exam. |
WritingScore | The student's score in the Writing exam. |
Through the analysis of this dataset, it aims to identify the most influential factors that affect test scores and explore any potential interactions among these factors. The findings can provide valuable insights for educational institutions and policymakers to develop targeted interventions and strategies to improve student performance and ensure equitable educational opportunities.
The following Table 2 summarizing the missing values count values for each feature in the dataset.
Table 2: Missing values count.
Column | Missing Values Count |
Gender | 0 |
EthnicGroup | 1840 |
ParentEduc | 1845 |
LunchType | 0 |
TestPrep | 1830 |
ParentMaritalStatus | 1190 |
PracticeSport | 631 |
IsFirstChild | 904 |
NrSiblings | 1572 |
TransportMeans | 3134 |
WklyStudyHours | 955 |
MathScore | 0 |
ReadingScore | 0 |
WritingScore | 0 |
Missing values in the dataset were addressed using three different techniques. For numeric variables, interpolation was applied, which estimates missing data points by considering the neighboring known data points. This method assumes a linear relationship between the data points and calculates the missing value based on the neighboring values. Mean/Median imputation was used for numeric variables as well, where the missing values were replaced with the mean or median of the respective feature [7].
This approach is suitable when the missing data is randomly distributed, and the feature has a symmetric or approximately symmetric distribution. For categorical variables, mode imputation was applied, replacing the missing values with the most frequently occurring value in the feature. This method is particularly useful for categorical data, where the mode represents a good representation for the missing values. It is important to consider the specific dataset and analysis when deciding which method to use, as they all make assumptions about the missing data.
3. Exploratory Data Analysis
In this section, it presents the results of the exploratory data analysis conducted on our dataset. The purpose of EDA is to gain initial insights into the data, identify patterns, and uncover relationships between variables. Here, it focuses on analyzing the scores of students in three subjects: Math, Reading, and Writing, considering different factors.
3.1. Gender-based Analysis
This section is begun by examining the distribution of scores based on gender. Fig. 1 displays three box plots representing Math, Reading, and Writing scores for male and female students. It is observed that there are slight variations in the median scores and the spread of scores between genders.
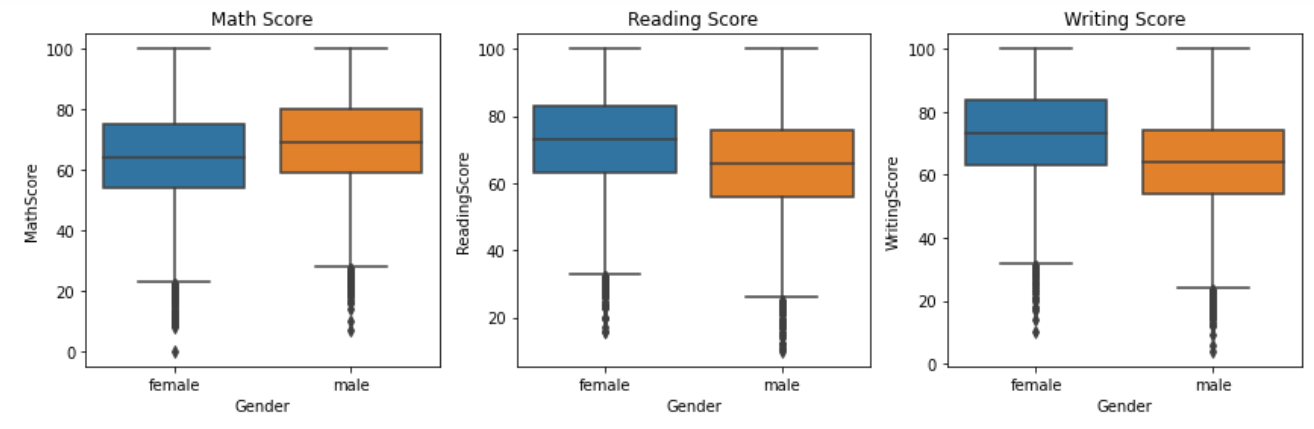
Figure 1: Student performance in Math, Reading, and Writing.
In terms of Math scores, it was observed that male students tended to outperform their female counterparts. The box plot in Fig. 1 indicates that the median Math score for males is higher compared to females. Additionally, the range of scores for males appears to be slightly wider, suggesting a greater dispersion of performance in this subject.
Conversely, when considering Reading and Writing scores, female students displayed higher performance compared to males. Fig. 1 showcases the box plots for Reading and Writing scores, and it can be observed that the median scores for females are higher than those for males in both subjects. Moreover, the box plots suggest that female students generally exhibit less variability in their scores, with a narrower spread of data points.
3.2. Ethnic Group-based Analysis
In this analysis, it explored the performance of students from different ethnic groups in the subjects of Math, Reading, and Writing. Fig. 2 displays the box plots for each subject, grouped by ethnic group.
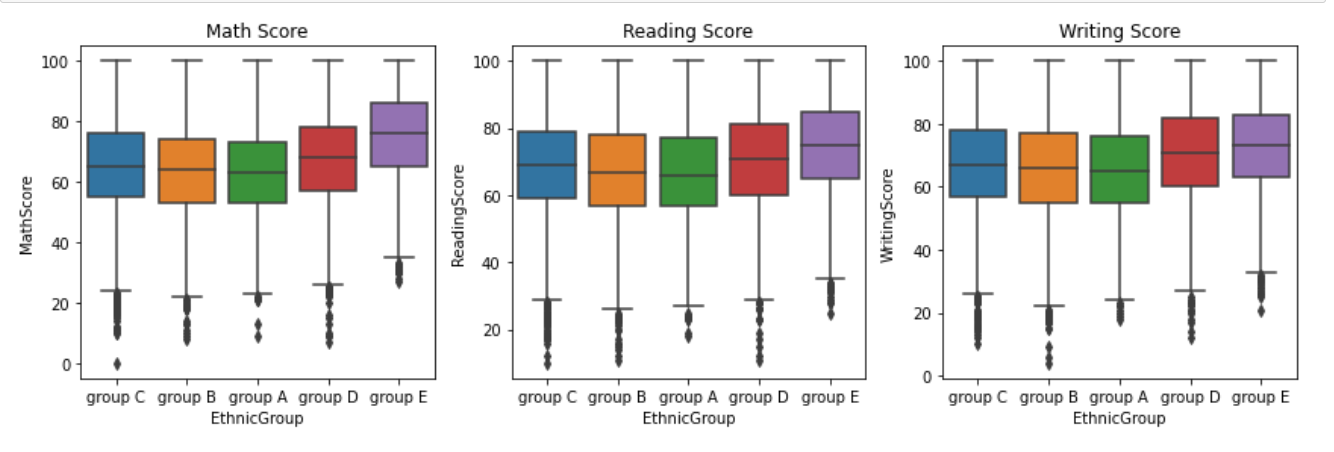
Figure 2: Ethnic group-based in Math, Reading, and Writing.
Fig. 2 presents the analysis of student performance in math, reading, and writing based on ethnic groups. The dataset consists of five ethnic groups labeled as A, B, C, D, and E, with A being the lowest performing group and E being the highest performing group.
Based on the box plots, it is evident that the performance ranking follows the pattern of E > D > C > B > A across all subjects. Group E consistently exhibits the highest scores, followed by groups D, C, B, and A.
3.3. Parental Education-based Analysis
The analysis explores the relationship between students' academic achievements and the educational attainment of their parents (See Fig. 3).
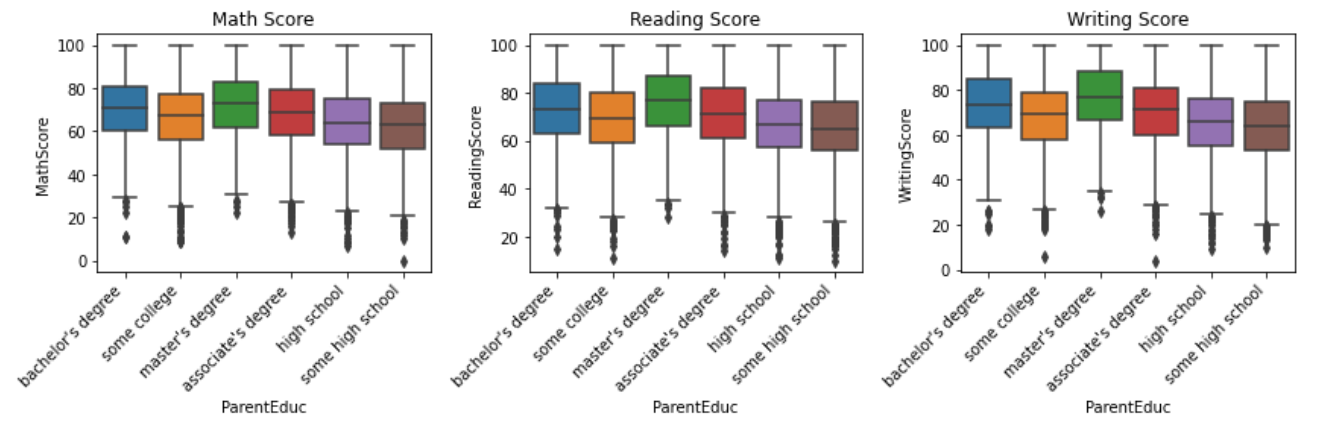
Figure 3: Impact of parental education on student performance.
The three boxes reflect the influence of parents' education level on students' scores. The dataset categorizes parental education into several levels, including "some college," "high school," "associate's degree," "some high school," "bachelor's degree," and "master's degree."
The analysis reveals a clear trend indicating that higher parental education levels are associated with better student performance. Students whose parents have obtained a master's degree or a bachelor's degree tend to exhibit higher academic achievements compared to those whose parents have a lower education level.
4. Data Analysis
4.1. One-hot Encoding
To effectively utilize categorical variables in our analysis, it performed one-hot encoding using the panda’s library in Python. One-hot encoding is a crucial preprocessing step for categorical data, as it allows us to represent categories numerically, which is required by many machine learning algorithms.
One-Hot Encoding involves creating binary columns, also known as dummy variables, for each category in a categorical feature [8].
The process of one-hot encoding involves the following steps: (1) Identify the categorical feature(s) in the dataset that need to be encoded. (2) Create a binary column for each unique category in the feature. (3) Assign a value of 1 to the corresponding binary column if the observation belongs to that category, and 0 otherwise.
This study selected specific categorical variables, including 'Gender', 'EthnicGroup', 'ParentEduc', 'LunchType', 'ParentMaritalStatus', 'PracticeSport', and 'WklyStudyHours', for one-hot encoding. These variables capture important information about the students' demographics, family background, and study habits.
It is important to note that one-hot encoding can significantly increase the dimensionality of the data, known as the "curse of dimensionality." However, in our analysis, this encoding technique provides a valuable representation of the categorical variables, allowing us to extract meaningful insights and make accurate predictions.
4.2. Correlation
In order to identify the variables that are highly relevant to the objective of our study, this study conducted a correlation analysis. This analysis allows us to examine the relationships between different variables and determine their strength and direction [9].
The following Fig. 4, Fig. 5 and Fig. 6 depict the correlation coefficients between each variable and the corresponding academic score. Fig. 4 represents the correlation coefficient with Math Score, Fig. 5 shows the correlation coefficient with Reading Score, and Fig. 6 illustrates the correlation coefficient with Writing Score.
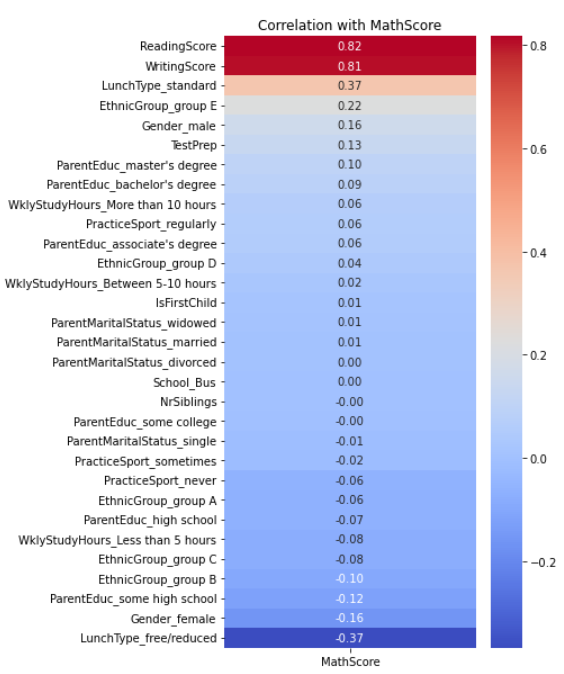
Figure 4: Correlation coefficient with Math Score.
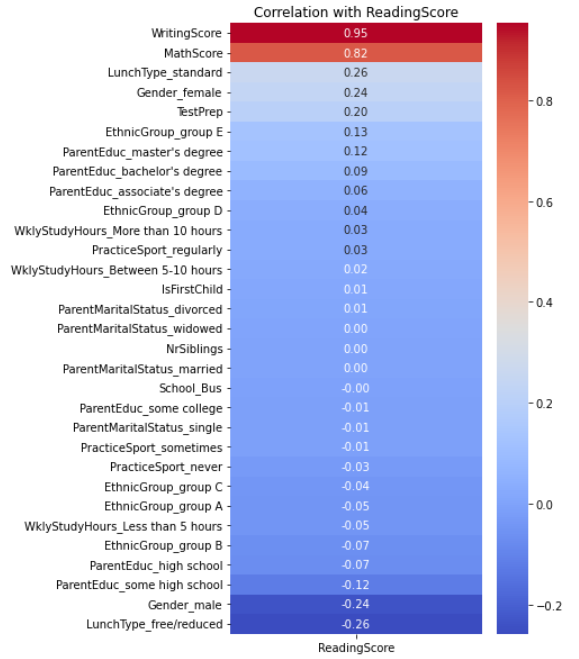
Figure 5: Correlation coefficient with Reading Score.
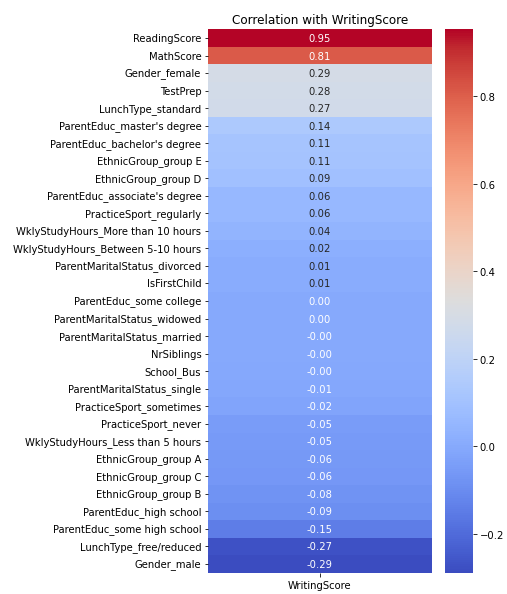
Figure 6: Correlation coefficient with Writing Score.
The correlation analysis reveals important insights into the relationships among variables in our dataset.
Scores in math, reading, and writing are highly correlated, suggesting that if a student has a high score in one subject, he or she is more likely to have a high score in the other subjects. This suggests the presence of common factors such as overall study habits, intelligence, or the quality of education that influence students' performance across multiple subjects.
Students who took a test preparation course show a positive correlation with all three scores, particularly with WritingScore. This suggests that test preparation courses may have a positive impact on students' overall academic performance.
The type of lunch students receive demonstrates a significant correlation with the scores. Students who have a standard lunch tend to achieve higher scores compared to those with a free/reduced lunch. This correlation can serve as an indicator of socio-economic status, suggesting that students from more affluent backgrounds may have better academic performance.
The EthnicGroup variable exhibits varied correlations with the scores. Group E shows a positive correlation, especially with MathScore, indicating that students in this group tend to have higher scores. In contrast, Group B and C display a negative correlation with the scores, suggesting lower performance in these groups compared to others.
4.3. Model
To predict the scores in Math, Reading, and Writing, it employed the Support Vector Machine (SVM) algorithm. SVM is a powerful supervised learning algorithm known for its effectiveness in both classification and regression tasks.
This study was begun by preprocessing the data, including one-hot encoding for the categorical variables. This transformation allows us to represent categorical features as binary variables, making them suitable for SVM [10].
Next, it split the dataset into features and targets. The features consist of all columns except for the MathScore, ReadingScore, and WritingScore, while the targets include these three score columns. To ensure fair evaluation, this study standardized the features using the StandardScaler. Standardization scales the features to have zero mean and unit variance, which helps SVM perform optimally.
This study used cross-validation and random search to find the best hyperparameters for the SVM model. The parameters considered included C (regularization parameter), epsilon (tolerance for the margin), and kernel type. For each target score, it divides the data set into two types. The training set is for model training and hyperparameter tuning, and the test set is for evaluation.
The SVM model was fitted using the best hyperparameters obtained from random search. This study then made predictions on the test set and evaluated the model's performance using three metrics (See Table 3).
Table 3: Results of the SVM Model.
Score | R2 Score | Mean Squared Error | Mean Absolute Error |
MathScore | 0.257 | 172.433 | 10.613 |
ReadingScore | 0.225 | 166.760 | 10.468 |
WritingScore | 0.331 | 158.055 | 10.178 |
The R2 score is the proportion of the variance in the target variable that can be explained by the model. Values closer to 1 indicate a better fit. The mean squared error and mean absolute error provide insights into the magnitude of prediction errors, with lower values indicating better performance. Additionally, it visualized the predicted scores against the actual scores for each target using scatter plots, allowing for a visual assessment of the model's performance. Overall, the SVM model showed moderate performance in predicting the scores, with R2 scores ranging from 0.225 to 0.331. While the model captures some patterns in the data, there is room for improvement to enhance its predictive capabilities.
In conclusion, the SVM model showed moderate performance in predicting the scores of students in Math, Reading, and Writing. While it captured some patterns in the data, further improvements could be explored, such as alternative algorithms, feature engineering, or the inclusion of additional relevant features. These efforts may enhance the model's predictive capabilities and contribute to a more accurate understanding of student performance.
5. Conclusion
In this study, it conducted a comprehensive analysis of student performance based on various factors such as gender, ethnic group, and parental education. Through exploratory data analysis, this study observed that males tend to excel in math while females perform better in reading and writing. Additionally, this study found that students with higher parental education tend to achieve better scores. In conclusion, this research provides valuable insights into student performance and lays the foundation for future studies aimed at developing more accurate predictive models and interventions to enhance educational outcomes. Furthermore, this study examined the correlation between different variables and the three scores: MathScore, ReadingScore, and WritingScore. The results showed that there is a strong positive correlation among these scores, suggesting that students who excel in one subject tend to excel in others. Additionally, this study identified several factors that influence student performance, such as test preparation, lunch type, and ethnic group.
This study highlights the importance of various factors in determining student performance. The findings suggest that addressing factors such as test preparation, lunch type, and parental education can potentially improve student outcomes. However, it is important to note that the predictive model's performance may be further improved by incorporating additional variables and employing more advanced machine learning techniques.
References
[1]. Iqbal, Z., Qadir, J., Mian, A. N., Kamiran, F.: Machine learning based student grade prediction: A case study. arXiv preprint arXiv:1708.08744 (2017).
[2]. Daud, A., Aljohani, N.R., Abbasi, R.A., Lytras, M.D., Abbas, F., Alowibdi, J.S.: Predicting student performance using advanced learning analytics. In Proceedings of the 26th international conference on world wide web companion, 415-421 (2017).
[3]. Yan, N., Au, O. T. S.: Online learning behavior analysis based on machine learning. Asian association of open universities journal 14(2), 97-106 (2019).
[4]. Rastrollo-Guerrero, J. L., Gómez-Pulido, J. A., Durán-Domínguez, A.: Analyzing and predicting students’ performance by means of machine learning: A review. Applied sciences 10(3), 1042 (2020).
[5]. Kapur, R.: Factors influencing the students academic performance in secondary schools in India. University Of Delhi (2018).
[6]. Kaggle, https://www.kaggle.com, last accessed 2023/7/1.
[7]. Johnson, T. F., Isaac, N. J., Paviolo, A., González‐Suárez, M.: Handling missing values in trait data. Global Ecology and Biogeography 30(1), 51-62 (2021).
[8]. Seger, C.: An investigation of categorical variable encoding techniques in machine learning: binary versus one-hot and feature hashing. DEGREE PROJECT TECHNOLOGY (2018).
[9]. Senthilnathan, S.: Usefulness of correlation analysis. Available at SSRN 3416918 (2019).
[10]. Huang, S., Cai, N., Pacheco, P. P., Narrandes, S., Wang, Y., Xu, W.: Applications of support vector machine (SVM) learning in cancer genomics. Cancer genomics & proteomics 15(1), 41-51 (2018).
Cite this article
Zeng,J. (2023). Predicting Student Performance: Analyzing Socio-economic and Personal Factors. Advances in Economics, Management and Political Sciences,42,170-178.
Data availability
The datasets used and/or analyzed during the current study will be available from the authors upon reasonable request.
Disclaimer/Publisher's Note
The statements, opinions and data contained in all publications are solely those of the individual author(s) and contributor(s) and not of EWA Publishing and/or the editor(s). EWA Publishing and/or the editor(s) disclaim responsibility for any injury to people or property resulting from any ideas, methods, instructions or products referred to in the content.
About volume
Volume title: Proceedings of the 7th International Conference on Economic Management and Green Development
© 2024 by the author(s). Licensee EWA Publishing, Oxford, UK. This article is an open access article distributed under the terms and
conditions of the Creative Commons Attribution (CC BY) license. Authors who
publish this series agree to the following terms:
1. Authors retain copyright and grant the series right of first publication with the work simultaneously licensed under a Creative Commons
Attribution License that allows others to share the work with an acknowledgment of the work's authorship and initial publication in this
series.
2. Authors are able to enter into separate, additional contractual arrangements for the non-exclusive distribution of the series's published
version of the work (e.g., post it to an institutional repository or publish it in a book), with an acknowledgment of its initial
publication in this series.
3. Authors are permitted and encouraged to post their work online (e.g., in institutional repositories or on their website) prior to and
during the submission process, as it can lead to productive exchanges, as well as earlier and greater citation of published work (See
Open access policy for details).
References
[1]. Iqbal, Z., Qadir, J., Mian, A. N., Kamiran, F.: Machine learning based student grade prediction: A case study. arXiv preprint arXiv:1708.08744 (2017).
[2]. Daud, A., Aljohani, N.R., Abbasi, R.A., Lytras, M.D., Abbas, F., Alowibdi, J.S.: Predicting student performance using advanced learning analytics. In Proceedings of the 26th international conference on world wide web companion, 415-421 (2017).
[3]. Yan, N., Au, O. T. S.: Online learning behavior analysis based on machine learning. Asian association of open universities journal 14(2), 97-106 (2019).
[4]. Rastrollo-Guerrero, J. L., Gómez-Pulido, J. A., Durán-Domínguez, A.: Analyzing and predicting students’ performance by means of machine learning: A review. Applied sciences 10(3), 1042 (2020).
[5]. Kapur, R.: Factors influencing the students academic performance in secondary schools in India. University Of Delhi (2018).
[6]. Kaggle, https://www.kaggle.com, last accessed 2023/7/1.
[7]. Johnson, T. F., Isaac, N. J., Paviolo, A., González‐Suárez, M.: Handling missing values in trait data. Global Ecology and Biogeography 30(1), 51-62 (2021).
[8]. Seger, C.: An investigation of categorical variable encoding techniques in machine learning: binary versus one-hot and feature hashing. DEGREE PROJECT TECHNOLOGY (2018).
[9]. Senthilnathan, S.: Usefulness of correlation analysis. Available at SSRN 3416918 (2019).
[10]. Huang, S., Cai, N., Pacheco, P. P., Narrandes, S., Wang, Y., Xu, W.: Applications of support vector machine (SVM) learning in cancer genomics. Cancer genomics & proteomics 15(1), 41-51 (2018).