


1. Introduction
AI technology is causing a global stir in 2023. ChatGPT-4 was released by OpenAI on March 14, 2023. Microsoft is providing the company with an additional $10 billion to increase its investment, and this partnership is likely to pose a huge threat to Google's DeepMind. It is reported that Google will launch its new AI chatbot Chinchilla AI [1]. On March 21, NVIDIA announced a suite of cloud services that enable companies to build, refine and run custom large-scale language models and generative AI models [2]. NVIDIA reported record revenue of $7.64 billion for the fourth quarter ended January 30, 2022, up 53 percent from the same quarter last year and up 8 percent from the previous quarter. The gaming, data center and professional visualization marketplaces set new records for both the quarter and the full year [3]. On May 25, 2023, shares of NVIDIA exploded by 28%, with revenue and sales far exceeding Wall Street expectations, and on May 30, NVIDIA opened at over $405 per share, valuing the company at over a trillion dollars [4]. NVIDIA's incredible growth is attributed to dozens of factors, the most prominent of which is the pioneering development of Generative AI technology. Combined with the rapid growth in earnings and sales revenue in the previous fiscal year, the rising audience expectations have raised the stock price. The reason for the tremendous increase in sales was revealed in the FY 2023 annual report: NVIDIA's revenue rose 41% in data center ($15.0 billion) and 60% in automotive ($0.9 billion). With AI technology evolving ever more fast, high-tech companies need to find new entry points to occupy the market and create advantages. This paper will focus on NVIDIA's outstanding contributions over the past fiscal year based on NVIDIA's FY2023 annual report data and relevant events. Four suitable competitors of NVIDIA (AMD, Intel, Broadcom and Texas Instrument) were selected through the screening and comparison of 17 financial data indicators in 2022. NVIDIA's key metrics and comments for liquidity, leverage, efficiency and profitability are also presented based on the financial data comparison with selected competitors. The exists and potential risks of NVIDIA and corresponding recommendations for improvement will be identified and provided at the end of the paper.
The intention of this paper is to show the discrepancies and possible reasons for the different data in the same industry, using NVIDIA's financials as the core, and to present the possibility of NVIDIA being at the heart of the development of AI technology. It provides some ideas for improvement and development for NVIDIA and this industry.
2. Accounting Analysis
Accounting analysis plays an important role in improving companies’ decision-making for its future based on their objective financial position [5]. The analysis for NVIDIA will primarily be based on its fiscal year 2023 annual report, with three dimensions: horizontal analysis, vertical analysis and ratio analysis. Since NVIDIA's sales and stock value exploded in May 2023, one of the quarterly reports of fiscal year 2024 will also be used as another point of comparison and analysis. The 2022 financial data were used to select suitable competitors for NVIDIA as it is more stable and comparable than the existing 2023 data and TTM forecasts. Based on key figures and ratios, NVIDIA's most appropriate competitors in this time being are AMD, Intel, Broadcom and Texas Instrument.
2.1. Revenue Recognition
Revenue recognition is crucial throughout the valuation. Reportable segments in NVIDIA’s revenue include compute & networking and graphics, at $15,068 billion and $11,906 billion. Based on the figure of FY22, they increased by 36% and decreased by 25%, respectively (as of January 29, 2023). NVIDIA's revenue is on an upward trajectory from FY21 to FY23 and has maintained a strong competitive advantage over its competitors. NVIDIA follows the principal ASC 606 for revenue recognition, where the rights of both customer and seller and payment terms in the contract are identifiable [6].
The consolidated financial statements of NVIDIA are produced based on U.S. GAAP. However, GAAP has limitations and is not all-inclusive [7]. For example, the GAAP standard does not include financial indicators such as EBITDA and free cash flow, which are essential and may influence decisions [8]. Another example, for high-tech companies, the economic purpose of some intangible assets is investment (e.g., R&D and human capital), which should be classified assets, but under GAAP they are classified as expenses [9]. This may lead to a loss for a company that uses knowledge to invest, that is, affecting the judgement of investors and evaluators on the its financial situation.
Therefore, a single GAAP display is not enough. Non-GAAP metrics are not audited and may not be fully compliant with GAAP principles, but they can be used by management for internal decision-making and as a reference for investors. NVIDIA provides both the company's GAAP and non-GAAP data in the quarterly presentation for FY24. This is also the choice of many similar companies (i.e., technology or software companies), as non-GAAP data can highlight certain items for potential investors, and the combination of the two methods is more comprehensive and persuasive, and gives more valuable financial information. In the case of NVIDIA, the gross margin for FY23 and FY22 are 56.9% and 64.9% respectively, with the reduction due to NVIDIA's underestimation of demand forecasts. In this section, the non-GAAP approach produces slightly higher numbers than the GAAP approach, which is more in line with recent trends in NVIDIA. NVIDIA's revenue recognition is explicit and reasonable in its principles and structure, and the annual report provides objective and detailed explanations of special variations and abnormal data. This makes the data sensible and comparable.
2.2. Intangible Assets
For semiconductor companies like NVIDIA, having intangible assets such as trademarks, brands or patents can give the company substantial advantages. Intangible assets cannot be imitated by competitors and have a high degree of viability and appreciation, which can generate high profit margins as a company matures, leading to healthy and sustainable capital appreciation. In fiscal 2023, NVIDIA lists developed technology, customer relationships, order backlogs, trade names and IPR&D as intangible assets. The total intangible assets recorded in NVIDIA's books are little changed ($3,539 million for 2023 and $3,507 million for 2022). However, during the first quarter of fiscal year 2023, $630 million of in-process R&D intangible asset was not recorded. This is because one of Mellanox's IPR&D projects had not reached technical feasibility as at the date of acquisition. Therefore, although the books have seen little change, NVIDIA has made noteworthy progress in terms of intangible property. And the highest percentage of these intangible assets is developed technology, which represents 55.22% of fair value, a massive asset for a technology company and a solid foundation for NVIDIA's future growth.
2.3. PPE
Property and equipment of NVIDIA is reported at $3,807 million in annual report of FY23, up 37.0% from the previous fiscal year [3]. Investment in PE is inherently objective, because there is no direct correlation between changes in the number of PE and the company recent performance. PE is a relatively fixed element of assets, providing long-term benefits to NVIDIA, but will inevitably depreciate over time. But a clear increasing investment in PE sends a positive signal to investors that NVIDIA has long-term goals in its intentions. This could give NVIDIA's investors more confidence and attract more potential investors to part with their own money into NVIDIA's market, supporting a higher valuation for the company. NVIDIA's lease obligations primarily consist of operating leases for headquarters buildings, office facilities and data center space. Property and real estate are stated at cost in NVIDIA’ report. The lease term expires between the 2024 and 2035 financial years. In NVIDIA’s annual report, there are details of debts to be repaid in each fiscal year in the future. Short-term debt operating lease obligations are relatively evenly distributed from FY24 to FY29 and thereafter. There is also $902 million in long-term operating lease liabilities, which puts modest pressure on NVIDIA to repay its debt compared to its market capitalization and sales.
3. Performance Evaluation
3.1. Liquidity
For the quick ratio and current ratio data collection, there is a maximum time gap of no more than one month for the five companies. Also, there were no notable changes in the debt of these companies during this period, so these data were retained for comparison. Table 1 reveals that the selected companies have both a quick ratio and a current ratio greater than one, meaning they have enough liquid assets to fully cover their debts. The top performers here are NVIDIA and Texas Instrument, both of which have ratios above 2.50, demonstrating excellent liquidity and superior financial health compared to other companies in the same industry. A key component of current assets is short-term investment, which is high-quality, highly liquid capital that is primarily reflected in NVIDIA's annual report as marketable securities. Of NVIDIA's total current assets of $23,073 million, $9,907 million are marketable securities, which can accelerate the concentration of capital and meet the demands of NVIDIA's expanding product production and commodity exchange.
Table 1: Liquidity ratios of NVIDIA and its competitors (Resource: Morningstar).
Current ratio | Quick ratio | |
NVIDIA | 3.43 | 2.67 |
AMD | 2.38 | 1.52 |
Intel | 1.76 | 1.15 |
Broadcom | 2.38 | 1.94 |
Texas Instrument | 5.17 | 3.93 |
3.2. Leverage
Different leverage ratios reflect the different asset structures of companies, the different financial positions over time and their level of risk. In general, a high debt ratio will put a company in financial difficulty, which is risky for the company and its investors, such as Broadcom's leverage ratio of 3.23 and its D/E ratio of 1.72 in Table 2, which indicates that Broadcom is likely to be unable to pay its debts [10]. Naturally, if a company's rate of return is higher than its loan rate, a higher debt ratio gives the company more liquid assets and a greater amount of discretionary investment, which may help drive growth. For example, the debt structures of NVIDIA, Intel and Texas Instrument are quite appropriate, with NVIDIA's figures even being pretty standard. Another example of a low D/E ratio in Table 2 is AMD's 0.05 D/E ratio, which may be a case of a company being reluctant to borrow due to its low profit margins. This suggests that AMD has been overly reliant on equity during this period, which can be costly and inefficient, and that its financial position needs to be improved. With all three aspects of leverage in combination, NVIDIA is in a relatively strong financial position among its peers, with a solid internal financial foundation and structure to underpin its rapid growth.
Table 2: Leverage ratios of NVIDIA and its competitors (Resource: Morningstar).
Leverage | D/E(%) | D/A(%) | |
NVIDIA | 1.86 | 0.48 | 0.39 |
AMD | 1.23 | 0.05 | 0.13 |
Intel | 1.80 | 0.37 | 0.38 |
Broadcom | 3.23 | 1.72 | 0.63 |
Texas Instrument | 1.87 | 0.59 | 0.41 |
3.3. Efficiency
All three metrics in Table 3 are used to measure the efficiency of the company, and the size of the data is proportional to the efficiency. NVIDIA's efficiency as reflected in its inventory turnover and receivable turnover is not very impressive. The expensive price of its products is one reason for this. The higher the asset turnover, the better the performance of the company. Although asset turnover varies by industry, a value of less than one is always on the underside. This means that these five companies generate less than one dollar of revenue per dollar of assets and their asset utilization efficiency needs to be enhanced. Non-performing acquisitions are one of the reasons for low asset turnover. NVIDIA's acquisition termination cost of $1,353 million was recorded as an operating expense in the FY23 annual report. This was due to significant regulatory challenges that prevented the completion of the NVIDIA and Arm transaction. NVIDIA and SoftBank ultimately announced the Termination of the Arm Share Purchase Agreement (February 2022). NVIDIA's acquisition of Arm eventually ended in failure and the attempt did not gain NVIDIA any returns, which definitely lowered its asset turnover for the year.
Another reason for the decline in NVIDIA's short-term turnover rate is its increasing technology-based investments. NVIDIA's investment in technology is very ambitious, with the input in non-affiliated entities rising to $2.99 million in FY23, up 12.4% from the previous fiscal year. This declined NVIDIA's asset turnover ratio to 0.63, which is lower than usual. But investments in technology are necessary for NVIDIA to enhance creativity and accelerate technological progress. Acknowledge investment may cause large fluctuations in data and even negative feedback in the short term. But in long-term investment, it will show obvious advantages, and successful acknowledge investment will become the core strength of a technology company's competition. The data of NVIDIA corporation condensed consolidated statement of cash flows (unaudited) prove that their investment is effective: in the three months ended January 30, 2022, net losses on investment in non-affiliates was 53 million dollars, and in the 12 months ended the same day, the net gains on it is 100 million dollars.
Table 3: Efficiency ratios of NVIDIA and its competitors (Resource: Morningstar).
Asset turnover | Inventory turnover | Receivable turnover | |
NVIDIA | 0.63 | 2.99 | 6.36 |
AMD | 0.59 | 4.54 | 6.91 |
Intel | 0.36 | 3.02 | 9.28 |
Broadcom | 0.45 | 6.90 | 13.20 |
Texas Instrument | 0.77 | 2.68 | 11.14 |
3.4. Profitability
In terms of profitability, Broadcom and Texas Instrument performed better, with the best gross profit margins in the semiconductor industry. This makes NVIDIA's profitability comparisons less stellar. In fact, NVIDIA's profitability did shrink compared to the previous year, with NVIDIA's gross margin at FY22 being 64.9% (Table 4). Because the PC game market is slowing down after experiencing a popular boom. Nvidia graphics cards, which were once difficult to find in 2020 and 2021, have now available retail discounts. Nvidia's gaming division reported sales of $1.57 billion in 2022, down 51% year-over-year. The company has more inventory than demand as both macroeconomic conditions and China's zero-COVID policy have cut consumer demand. Coupled with the significant amount of investment NVIDIA has made in technology, there is a lag in return. Continuing to break new ground and adjusting inventory appropriately will help NVIDIA further increment profitability.
Table 4: Profitability ratios of NVIDIA and its competitors (Resource: Morningstar).
Gross profit margin (%) | Net (profit) margin(%) | Return on assets (ROA) (%) | Return on equity (ROE) (%) | Return on Invested Capital (ROIC) (%) | |
NVIDIA | 56.93 | 16.19 | 10.23 | 17.93 | 11.82 |
AMD | 44.93 | 5.59 | 3.30 | 4.24 | 4.08 |
Intel | 42.61 | 12.71 | 4.57 | 8.14 | 5.75 |
Broadcom | 66.55 | 33.80 | 15.08 | 47.09 | 20.07 |
Texas Instrument | 68.76 | 43.48 | 33.57 | 62.41 | 39.44 |
4. Valuation & Risk Assessment
The P/E ratio is one of the most widely used stock valuation metrics and measures of company performance [11]. Figure 1 shows an increasing P/E ratio of NVIDIA from 2018 to 2021 and a turning point in 2022.
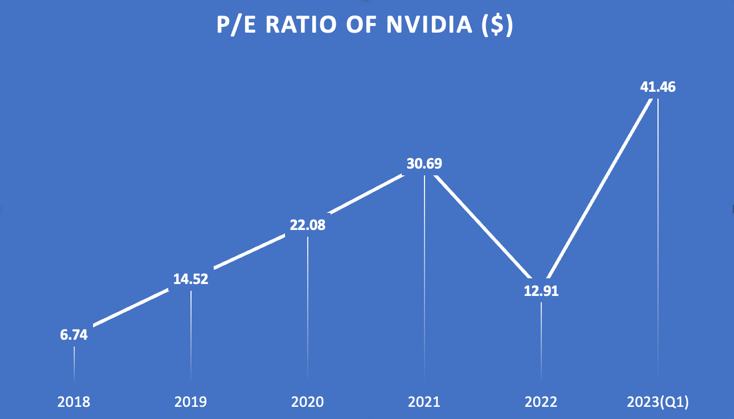
Figure 1: P/E ratio of NVIDIA (2018-2023Q1).
From the aftermath of the global outbreak, when many manufacturing facilities shut down, leaving world demand for chips far greater than supply, NVIDIA's inventory leaves it with a large profit margin. The inflection point comes after 2022 as the negative impact of the outbreak on the whole industry diminishes markedly, the world economy recovers, and supply and demand begin to balance, so NVIDIA's P/E ratio begins to fall. However, a spurt in the first quarter of 2023 led directly to NVIDIA becoming a member of Wall Street's “trillion dollar” market cap club [12]. The upward range in the P/E ratio indicates that the market expects NVIDIA’s earnings to continue to grow, providing the market's estimate of the its prosperous prospects.
Table 5: The valuation of stock price and enterprise value of NVIDIA.
Price (actual EPS, 2022) | Price (EPS 2023 forecast) | Price (EPS 2024 forecast) | Enterprise value (actual EBITDA, 2022) | Enterprise value (EBITDA 2023 forecast | Enterprise value (EBITDA 2024 forecast) | |
Using median | 94.29 | 263.81 | 209.28 | 189.43 | 328.12 | 268.65 |
Using Average | 207.77 | 314.13 | 227.34 | 217.16 | 408.40 | 268.96 |
The forecast data for NVIDIA is presented in Table 5. Estimates and valuations for NVIDIA are based on data from May 26, 2023. The stock valuation formula: Stock price = P/E*EPS and the median and average of the actual and two estimated values of price and enterprise value were used to obtain the corresponding valuations. Stock price of NVIDIA (May 26, 2023) is $389.46 and enterprise value of it (May 26, 2023) is $958.73 billion. According to the calculation and comparison, it is easy to find that nearly all the data of NVIDIA are overvalued. But such an overvaluation does not mean that NVIDIA's audience or investors are not fairly evaluating the company. Because NVIDIA did demonstrate exceptional capabilities and continued competitiveness in the first quarter of 2023, such a “premium” share price is a reward for companies that dare to invest and innovate. NVIDIA's near-monopoly power in a fiercely competitive marketplace has earned the trust of investors. This overvaluation also reflects the higher expectations of NVIDIA.
It is also because of the higher expectations that any existing risks are magnified. NVIDIA's risks can be divided into two levels: micro and macro. On the micro level, the first is the inaccuracy of demand levels, resulting in stagnant inventory that can be very costly to NVIDIA. Secondly, NVIDIA's increased reliance on third party suppliers reduces its control over the quality and quantity of goods and delivery times, which could harm the company's business. There is also the difficulty of capturing the right intensity of investment. It is dangerous that any research-related investment carries the risk of not being able to recover costs. On the macro level, changes in the general economic environment or in international trade policies, even international relations can have a significant impact on the cost and effectiveness of NVIDIA International operations [13]. The risk mitigation measures are focused on the manageable micro perspective. For demand estimation, it is advisable to use specialized technology, such as AI big data calculations and field market research, to fully consider the market environment and make a reasonable prediction of demand. To address the issue of quality reduction by suppliers, NVIDIA is encouraged to consider developing its own production line to ensure the quality and delivery time of high-end products under its own control to ensure core user experience. In terms of investment decisions, use ingenuity to attack areas of the market that are not yet fully open and expand the number of patents to dominate the market as soon as possible. Reduce investment in saturated areas. NVIDIA might not be able to change the macro environment alone, but real advanced technology always has a better chance of opening consumer wallets therefore NVIDIA should concentrate on what it does best.
5. Conclusion
Through the comparison and analysis of commercial data, this paper provides the elaboration of key data and the evaluation of related events with NVIDIA as the core. NVIDIA is clear and reasonable in summarizing and displaying internal data, outperforms competitors in the same industry in most economic index comparisons, and has the ability to maintain its competitive edge in a long-term and stable manner. The forecast and risk part of the paper estimates NVIDIA's stock price and EV, and provides an explanation for NVIDIA's overestimation. The risks at both micro and macro levels of NVIDIA are revealed, and specific improvement suggestions are also offered. There are many problems hidden in objective business data, only the analyzed data has the ability to uncover them. Compared with the AI algorithm, the subjective elaboration of the paper has certain limitations and is not universally applicable, but it is temporarily superior to the innovative ability of computer algorithms in solving specific and special problems. This article takes NVIDIA, the pioneer of semiconductor company, as an example to provide specific improvement methods for the company and development ideas for the same industry.
References
[1]. N Kurian, JM Cherian, NA Sudharson, KG Varghese, S Wadhwa.: AI is everywhere. British Dental Journal 234 (2), 72-72, 2023.
[2]. Nvidia brings Generative AI to World’s enterprises with cloud services for creating large language and visual models. GlobeNewswire News Room. https://www.globenewswire.com/en/news-release/2023/03/21/2631609/0/en/NVIDIA-Brings-Generative-AI-to-World-s-Enterprises-With-Cloud-Services-for-Creating-Large-Language-and-Visual-Models.html, last accessed 2023/06/25.
[3]. Nvidia announces financial results for fourth quarter and fiscal 2022. NVIDIA Newsroom. https://nvidianews.nvidia.com/news/nvidia-announces-financial-results-for-fourth-quarter-and-fiscal-2022, last accessed 2023/06/25.
[4]. AI chip boom sends Nvidia’s stock surging after Whopper of a quarter. CNN business. https://www.cnn.com/2023/05/25/tech/nvidia-earnings-ai/index.html, last accessed 2023/06/25.
[5]. Scott, R., Irem, T., Peter, W.: Accounting anomalies and fundamental analysis: A review of recent research advances. Journal of Accounting and Economics 50 (2-3), 410-454, 2010.
[6]. Lisa, A. H., Gabriel, P., Mark, Z.: The Decision-Usefulness of ASC 606 Revenue Disaggregation. SSRN 4108032, 2022.
[7]. Marinus, J. B., Paul, F., Patricia, A. F.: The Relevance of GAAP-Based Information: A Case Study Exploring Some Uses and Limitations. Accounting Horizons. Dec95, Vol. 9 Issue 4, p22-47. 26p. 1 Diagram, 5 Charts.
[8]. Denis, C., Samira, D., Michel, M.: Beyond earnings: do EBITDA reporting and governance matter for market participants?. Managerial Finance 43 (2), 193-211, 2017.
[9]. Govindarajan, V., Srivastava, A., & Zhao, R.: Mind the GAAP. Harvard Business Review (2021).
[10]. Balasundaram, N. Capital structure and its impact on profit ability: a study of listed manufacturing companies in SRI Lanka. Ekonomika, Journal for Economic Theory and Practice and Social Issues 56 (4), 83-92, 2010.
[11]. Wu, W.-T. (Alexandra). (2013). The P/E Ratio And Profitability. Journal of Business & Economics Research (JBER), 12(1), 67–76.
[12]. Investor presentation Q4 FY23. https://s201.q4cdn.com/141608511/files/doc_presentations/2023/02/nvda-f4q23-investor-presentation-final.pdf, last accessed 2023/06/25.
[13]. Nvidia revenue falls 17% but data center growth remains strong. CNBC. https://www.cnbc.com/2022/11/16/nvidia-nvda-earnings-q3-2023-.html, last accessed 2023/06/25.
Cite this article
Ma,C. (2023). Financial Valuation and Assessment of NVIDIA. Advances in Economics, Management and Political Sciences,43,17-24.
Data availability
The datasets used and/or analyzed during the current study will be available from the authors upon reasonable request.
Disclaimer/Publisher's Note
The statements, opinions and data contained in all publications are solely those of the individual author(s) and contributor(s) and not of EWA Publishing and/or the editor(s). EWA Publishing and/or the editor(s) disclaim responsibility for any injury to people or property resulting from any ideas, methods, instructions or products referred to in the content.
About volume
Volume title: Proceedings of the 7th International Conference on Economic Management and Green Development
© 2024 by the author(s). Licensee EWA Publishing, Oxford, UK. This article is an open access article distributed under the terms and
conditions of the Creative Commons Attribution (CC BY) license. Authors who
publish this series agree to the following terms:
1. Authors retain copyright and grant the series right of first publication with the work simultaneously licensed under a Creative Commons
Attribution License that allows others to share the work with an acknowledgment of the work's authorship and initial publication in this
series.
2. Authors are able to enter into separate, additional contractual arrangements for the non-exclusive distribution of the series's published
version of the work (e.g., post it to an institutional repository or publish it in a book), with an acknowledgment of its initial
publication in this series.
3. Authors are permitted and encouraged to post their work online (e.g., in institutional repositories or on their website) prior to and
during the submission process, as it can lead to productive exchanges, as well as earlier and greater citation of published work (See
Open access policy for details).
References
[1]. N Kurian, JM Cherian, NA Sudharson, KG Varghese, S Wadhwa.: AI is everywhere. British Dental Journal 234 (2), 72-72, 2023.
[2]. Nvidia brings Generative AI to World’s enterprises with cloud services for creating large language and visual models. GlobeNewswire News Room. https://www.globenewswire.com/en/news-release/2023/03/21/2631609/0/en/NVIDIA-Brings-Generative-AI-to-World-s-Enterprises-With-Cloud-Services-for-Creating-Large-Language-and-Visual-Models.html, last accessed 2023/06/25.
[3]. Nvidia announces financial results for fourth quarter and fiscal 2022. NVIDIA Newsroom. https://nvidianews.nvidia.com/news/nvidia-announces-financial-results-for-fourth-quarter-and-fiscal-2022, last accessed 2023/06/25.
[4]. AI chip boom sends Nvidia’s stock surging after Whopper of a quarter. CNN business. https://www.cnn.com/2023/05/25/tech/nvidia-earnings-ai/index.html, last accessed 2023/06/25.
[5]. Scott, R., Irem, T., Peter, W.: Accounting anomalies and fundamental analysis: A review of recent research advances. Journal of Accounting and Economics 50 (2-3), 410-454, 2010.
[6]. Lisa, A. H., Gabriel, P., Mark, Z.: The Decision-Usefulness of ASC 606 Revenue Disaggregation. SSRN 4108032, 2022.
[7]. Marinus, J. B., Paul, F., Patricia, A. F.: The Relevance of GAAP-Based Information: A Case Study Exploring Some Uses and Limitations. Accounting Horizons. Dec95, Vol. 9 Issue 4, p22-47. 26p. 1 Diagram, 5 Charts.
[8]. Denis, C., Samira, D., Michel, M.: Beyond earnings: do EBITDA reporting and governance matter for market participants?. Managerial Finance 43 (2), 193-211, 2017.
[9]. Govindarajan, V., Srivastava, A., & Zhao, R.: Mind the GAAP. Harvard Business Review (2021).
[10]. Balasundaram, N. Capital structure and its impact on profit ability: a study of listed manufacturing companies in SRI Lanka. Ekonomika, Journal for Economic Theory and Practice and Social Issues 56 (4), 83-92, 2010.
[11]. Wu, W.-T. (Alexandra). (2013). The P/E Ratio And Profitability. Journal of Business & Economics Research (JBER), 12(1), 67–76.
[12]. Investor presentation Q4 FY23. https://s201.q4cdn.com/141608511/files/doc_presentations/2023/02/nvda-f4q23-investor-presentation-final.pdf, last accessed 2023/06/25.
[13]. Nvidia revenue falls 17% but data center growth remains strong. CNBC. https://www.cnbc.com/2022/11/16/nvidia-nvda-earnings-q3-2023-.html, last accessed 2023/06/25.