


1. Introduction
In the increasingly competitive landscape of the banking sector, effective marketing strategies have become integral to fostering strong customer relationships, enhancing brand image, and driving profitability. Traditional methods often yield high customer acquisition costs with relatively low conversion rates, diminishing returns on investment. In light of these challenges, leveraging advanced analytics and machine learning techniques has become imperative for optimizing marketing strategies. This study focuses on analyzing the real-world of the bank telemarketing campaign and investigating key factors that influence customer receptiveness to term deposits. The insights derived will equip banks to execute targeted, efficient campaigns, personalize customer communication, and foster stronger relationships. Ultimately, the goal is to maximize bank profitability through effective strategies and sustainable growth.
In the field of bank telemarketing, several notable studies have made significant contributions. Moro, Cortez, & Rita presented a Decision Support System (DSS) applying a Data Mining (DM) approach to predict the outcome of phone calls selling long-term deposits. Their work compared four DM models and demonstrated the system's value to bank telemarketing managers by increasing campaign efficiency through targeted customer selection [1]. Further, Vajiramedhin & Suebsing advanced the field by implementing a correlation-based feature selection algorithm and a data balancing technique. Their study revealed a significant enhancement in the predictive model for bank marketing, providing a two-fold benefit: reducing computation time and saving storage space [2]. Lastly, Kim, Lee, Jo, & Cho leveraged deep convolutional neural networks (DCNN) to elucidate relationships among attributes and hierarchical features. Their research showcased the superior performance of DCNN, achieving the highest accuracy score among seven evaluated classifiers. These diverse studies set a robust foundation for understanding and improving bank telemarketing strategies, highlighting the need for continued exploration in this field [3].
This study harnesses several machine learning methodologies to explore a Portuguese bank telemarketing dataset, beginning with a detailed Exploratory Data Analysis (EDA) and the application of stratified sampling. To prevent overfitting, cross-validation is employed, facilitating the independent training and validation of algorithms. The model's performance is then thoroughly evaluated using a confusion matrix, precision and recall metrics, and the Receiver Operating Characteristics (ROC) Curve. Concluding the study, key factors influencing term deposit subscriptions are identified, forming the basis of data-driven recommendations for future bank telemarketing campaigns. These recommendations integrate the insights garnered from the data analysis with traditional marketing theories, providing a novel perspective for optimizing campaign strategies.
2. Description of Data
The research utilizes a dataset sourced from the UC Irvine Machine Learning Repository, comprising authentic data from a Portuguese banking institution’s direct marketing campaign. These campaigns, conducted from May 2008 to June 2013, primarily revolved around phone calls - both outbound, with human agents calling a customer list to promote the term deposit, and inbound, recording customer calls to subscribe to the deposit. The central objective of this study is to predict if a client will subscribe to a long-term deposit. To enhance prediction accuracy, this research concentrates on a subset of the dataset, comprising 11,162 records (rows) and 17 attributes (columns).
The dataset under study consists of two main types of input variables: numerical and categorical. Numerical variables include attributes like 'age', 'balance', 'day', 'duration', 'campaign', 'pdays', and 'previous'. In contrast, the categorical variables consist of 'job', 'marital', 'education', 'default', 'housing', 'loan', 'contact', 'month', and 'poutcome'. The final column in the dataset represents the target output variable 'deposit', signifying whether a client has subscribed to a term deposit or not, recorded as a binary 'yes' or 'no'. For a detailed description of the data used in this paper, please refer to the UC Irvine Machine Learning Repository (https://archive.ics.uci.edu).
3. Exploratory Data Analysis (EDA)
The initial phase of any knowledge discovery procedure involves Exploratory Data Analysis (EDA). This process provides an interactive platform for gaining an intimate understanding of a new dataset, comprehending its distinctive attributes, and extracting early insights from the data [4].
3.1. The Structure of Data
The comprehensive dataset comprises 11,162 rows (indexed from 0 to 11,161) and 17 columns. The data types present include seven int64 types and ten objects. Notably, there are no missing values across any columns, ensuring data integrity. The 'deposit' column is of binary nature, signifying whether a client has subscribed ('yes') or has not subscribed ('no') to a term deposit. Out of all clients, 5,289 (or 47.38%) have term subscriptions, while the remaining 5,873 (or 52.62%) do not.
3.2. Numerical Columns Exploration
The dataset comprises seven numerical columns, the distributions of which are analyzed and visualized through graphical representation. An evaluation of the age data reveals a client age span of 18 to 95 years, with a conspicuous concentration in the 30–40-year age group. The average age within the dataset is about 41 years. The second numeric variable, balance, denotes each client's available account balance. With a range spanning approximately 0 to 30,000, the mean balance stands at 1,528. Nonetheless, a high standard deviation implies a wide dispersion in account balances across the dataset.
3.3. Categorical Columns Exploration
The dataset incorporates nine categorical input variables. The study scrutinizes the distribution of these categorical data and their interrelation with numerical variables to deepen our understanding.
Among ten occupational categories in the sample population, management, blue-collar, and technician job titles are the most common, with respective client counts of 3604, 1833, and 1694. An examination of age per occupation indicates that retired individuals tend to be the oldest, while students are the youngest. A parallel analysis of account balance by occupation reveals management personnel and retirees maintain the highest account balances (See Fig. 1).
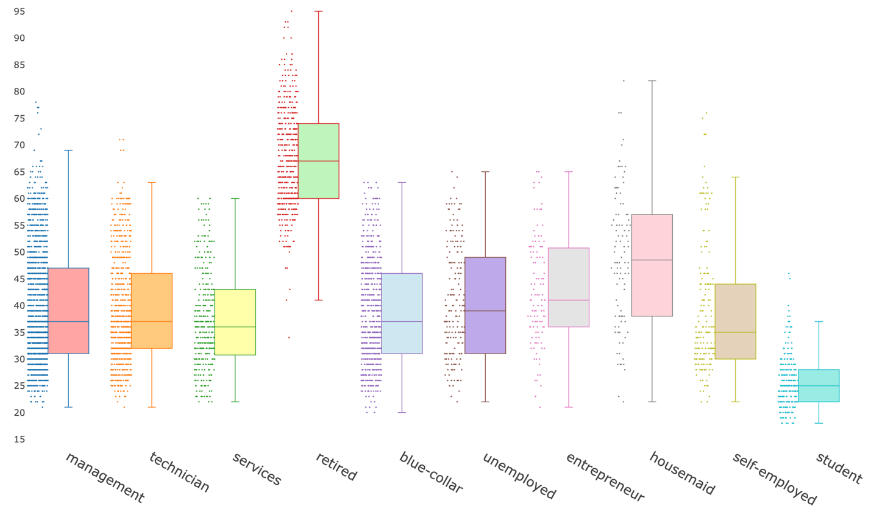
Figure 1: Distribution of age by occupation.
Marital status within the sample is categorized into three types: married, single, and divorced. Married individuals represent the largest client group, amounting to 5815, followed by single and divorced clients, amounting to 3336 and 1174 respectively. When exploring account balances by marital status, it is evident that married clients generally maintain a higher balance, while divorced clients tend to hold considerably lower balances.
Lastly, the 'education' variable is classified into three distinct categories: primary, secondary, and tertiary. A cross-sectional analysis of education level, marital status, and median account balance suggests that clients with tertiary education and those married with tertiary education tend to have relatively high median balances. Notably, the married-with-tertiary-education category also presents the highest proportion of clients without personal loans (See Fig. 2).
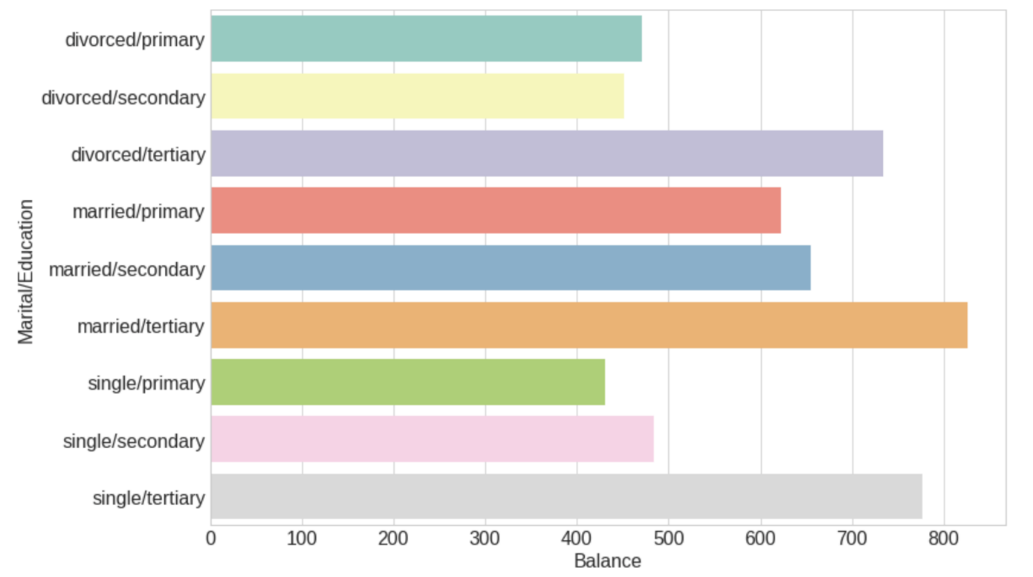
Figure 2: Distribution of median balance by education and marital group.
3.4. Analysis of the Response Columns
The examination of the response column, specifically the 'deposit' value, provides crucial insight into the prediction outcomes. This value fluctuates based on the other categorical variables present in the dataset. Consequently, it is paramount to explore the distribution of 'deposit' in correlation with these categorical variables.
Job vs Deposit: The 'deposit' distribution across job categories indicates that the 'management' and 'unemployed' sectors have a near-equal number of 'yes' and 'no' responses regarding term deposit subscriptions. In contrast, 'blue-collar' and 'services' sectors feature a significantly higher number of clients who do not subscribe, suggesting a lower likelihood of term deposit subscriptions in these job categories. Conversely, 'retired' and 'student' sectors are more inclined towards term deposit subscriptions.
Marital Status vs Deposit: It is observed that married clients generally maintain a higher deposit balance. However, within this group, there are significantly more individuals without term deposits, suggesting that married clients are less inclined to subscribe to term deposits.
Education vs Deposit: The data suggests that individuals within the 'secondary' education category are less likely to subscribe to a term deposit, evidenced by a larger proportion of customers without such subscriptions in this group.
Type of Contact vs Deposit: The distribution of 'deposit' across different types of contact reveals that customers contacted via cellular means are less likely to subscribe to a term deposit (See Fig. 3).
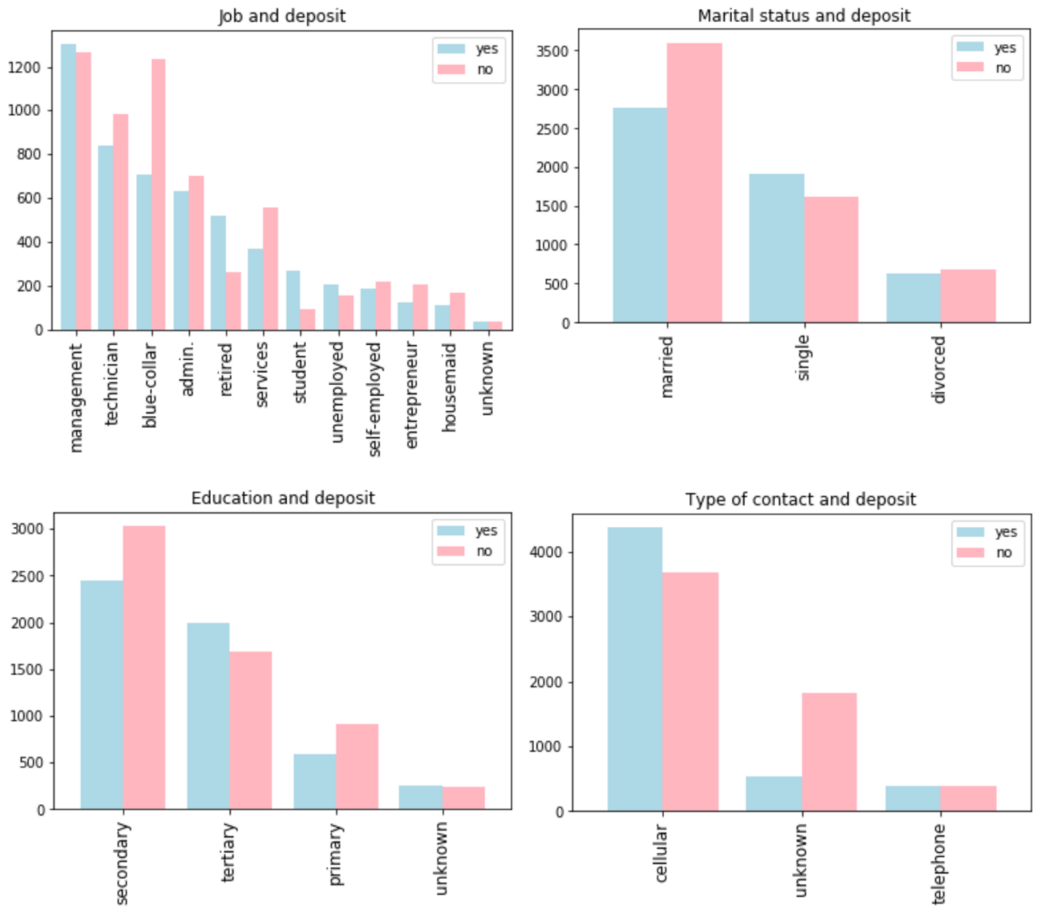
Figure 3: Distributions of categorical columns versus deposit.
4. Classification Models
4.1. Stratified Sampling
Stratified sampling, a prevalent method in survey studies, works by categorizing the entire target population into distinct groups or strata. This categorization is achieved based on characteristics that are vital to the study's context, such as key variables X within each stratum that share substantial similarities [5]. In the present analysis, this method has been employed to ensure that features bearing the most significant influence on the outcome - the potential client's decision to open a term deposit - are equitably distributed. Therefore, stratified sampling not only optimizes the sample design in relation to cost efficiency and estimator precision but also creates an environment where influential factors are effectively represented.
In this study, the personal loan feature is considered as a significant determinant of the outcome. The data records 'no' for 87% of instances and 'yes' for 13% under this feature. To retain this proportion in the training and test sets, a stratified shuffle split is utilized. This method ensures the distribution of important features, like the personal loan feature, is consistent in both the training and test sets, thereby minimizing the potential for biased outcomes and improving model accuracy. After segregating the labels and the features, it's observed that the training data for 'deposit' includes 4697 'no' and 4232 'yes'. The dataset is then partitioned into 80% training data and 20% testing data, resulting in a training set with 8929 entries across 17 columns. Table 1 illustrates the training scores for eight unique classification models employed in this study.
Table 1: Train scores for each classifier.
Classifier | Train_Score |
Decision Tree | 1.000 |
Random Forest | 0.996 |
Nearest Neighbors | 0.863 |
Gradient Boosting | 0.861 |
Neural Net | 0.854 |
Linear SVM | 0.852 |
Logistic Regression | 0.831 |
Naive Bayes | 0.722 |
4.2. Avoid Overfitting Using Cross Validation
Overfitting is a modeling error that arises when a model fits the training data too closely, often failing to generalize to unseen data. A prime indicator of overfitting is when a model exhibits stellar performance on the training set, yet underperforms on the test set. This project aims to create a model capable of discerning the general data pattern to accurately predict if a prospective client will subscribe to a term deposit. Judging by the training scores, the Decision Tree classifier and the Random Forest classifier are likely overfitting, given their near-perfect accuracy scores of 100% and 99% respectively.
Cross-validation (CV), a technique that splits data once or several times, is utilized to calculate the risk for each algorithm. A segment of the data, referred to as the training sample, is used to educate each algorithm, while the remaining portion, the validation sample, is employed to appraise the algorithm's risk. CV then selects the algorithm that presents the smallest estimated risk, thereby curtailing overfitting as the training sample is kept distinct from the validation sample [6].
The partitioning of the training dataset is a crucial step in this process. For example, if the dataset is divided into three parts, 2/3 (or 66%) of the data is dedicated to training, while the remaining 1/3 (or 33%) is used for testing. This tri-fold testing process will iterate through all the training and testing sets, aiming primarily to understand the overall data pattern. By applying the cross-validation method to all eight classifiers and documenting the score for each, it's observed in Table 2 that all models demonstrate satisfactory performance, with mean scores exceeding 70%. The leading three classifiers in terms of high scores are Neural, Naive Bayes, and Gradient Boosting.
Table 2: Cross-validation scores.
Classifiers | CV Mean Scores | |
6 | Neural Classifier | 0.848 |
7 | Navies Bayes | 0.848 |
4 | Gradient Boosting | 0.845 |
5 | Random Forest | 0.843 |
1 | SVC | 0.840 |
0 | Logistic Regression | 0.838 |
2 | KNN | 0.804 |
3 | Decision Tree | 0.786 |
4.3. Confusion Matrix
A confusion matrix, commonly utilized in machine learning, serves as a visual tool to assess and understand the performance of predictive models [7]. In the context of this study, the 'deposit' column, being a binary classification, allows for four possible outcomes. Utilizing a confusion matrix primarily aims to gauge the model's ability to classify potential clients who are likely to subscribe to a term deposit.
The matrix enumerates the number of true positives (TP), true negatives (TN), false positives (FP), and false negatives (FN) that the model generates on the test data. In this context, the confusion matrix is interpreted as such: Positive/Negative designates the class of ‘no’ and ‘yes’, while True/False signifies if the prediction by the model is accurate or inaccurate. TN represents the correct "No" classifications, indicating potential clients disinclined to subscribe to a term deposit. FN, on the other hand, denotes incorrect "No" classifications. FP is the count of incorrect "Yes" classifications, suggesting potential clients willing to subscribe, while TP is the number of correct "Yes" classifications. The confusion matrix comparison involves training data comprising 4,697 'no' and 4,232 'yes' responses.
Table 3 delineates the distribution of each classification based on the dataset. Among the four categories, TN represents the largest group, comprising 3,926 accurate predictions of clients rejecting the term deposit. In addition, 3,620 correct predictions are made of clients accepting the term deposit. The number of incorrect predictions is significantly lower, suggesting a high accuracy level of the model.
Table 3: Confusion matrix of the dataset.
Prediction | |||
Negative (N) | Positive (P) | ||
Actual | Refused Term Deposit | 3926 | 612 |
Accepted Term Deposit | 771 | 3620 | |
4.4. Precision and Recall
Recall, also known as Sensitivity, measures the percentage of actual positive cases that the model correctly identifies as positive. On the other hand, Precision, often referred to as confidence, signifies the percentage of predicted positive instances that are correctly identified as actual positives. Both of these metrics, individually and collectively, concentrate on positive instances and their predictions [8]. In the context of this study, 'Recall' refers to the proportion of actual "Yes" responses correctly identified by the model, while 'Precision' quantifies the model's confidence in predicting a "Yes" response. The respective scores for precision and recall are 0.824 and 0.855, indicating a well-performing model. The model's f1 score, a metric that evaluates overall accuracy, stands at 0.840, affirming the model's robustness. However, it's important to note the inverse relationship between precision and recall. If we raise the model's precision from 30% to 60%, the model will focus on predictions it deems 60% accurate. But in cases where it predicts a 58% chance of a customer subscribing to a term deposit and categorizes it as a "No", the model could miss a true "Yes". Consequently, higher precision may lead to missing actual "Yes" instances.
Another aspect to consider is determining the best threshold for precision and recall curves. Higher thresholds may lead to increased precision but decreased recall. The optimal threshold setting is one that balances high recall and precision rates. Specifically, a 0.13 threshold achieves an ideal balance, with both precision and recall surpassing 0.8 (See Table 4).
Table 4: Precision, recall, and F1 score of the model.
Value | |
Precision | 0.824 |
Recall | 0.855 |
F1 | 0.840 |
4.5. Receiver Operating Characteristics (ROC) Curve
The Receiver Operator Characteristics (ROC) curve is a widely adopted graphical representation to showcase the performance of binary classifiers in machine learning, especially when the distribution of classes is almost even [9]. It plots the true positive rate against the false positive rate, providing a visual assessment of a model's classification ability between positive instances (term deposit subscriptions) and negative ones (non-term deposit subscriptions). The x-axis symbolizes the false positive rate (1-specificity), while the y-axis corresponds to the true positive rate (sensitivity). As we shift along the curve, the classification threshold modifies, producing various outcomes. A curve closer to the top left corner signifies a more capable model at differentiating between the classes.
Fig. 4 presents the ROC curves of the three top-performing classifiers with the highest mean scores: Gradient Boosting, Neural Classifier, and Naive Bayes. The ROC-AUC (Area Under the Curve) score is an indication of the model's effectiveness, with the scores for Gradient Boosting, Neural Classifier, and Naive Bayes recorded as 91.73%, 91.68%, and 80.34%, respectively. The high AUC scores for Gradient Boosting and Neural Classifier, close to 1, signify their exceptional ability to accurately differentiate positive from negative values.
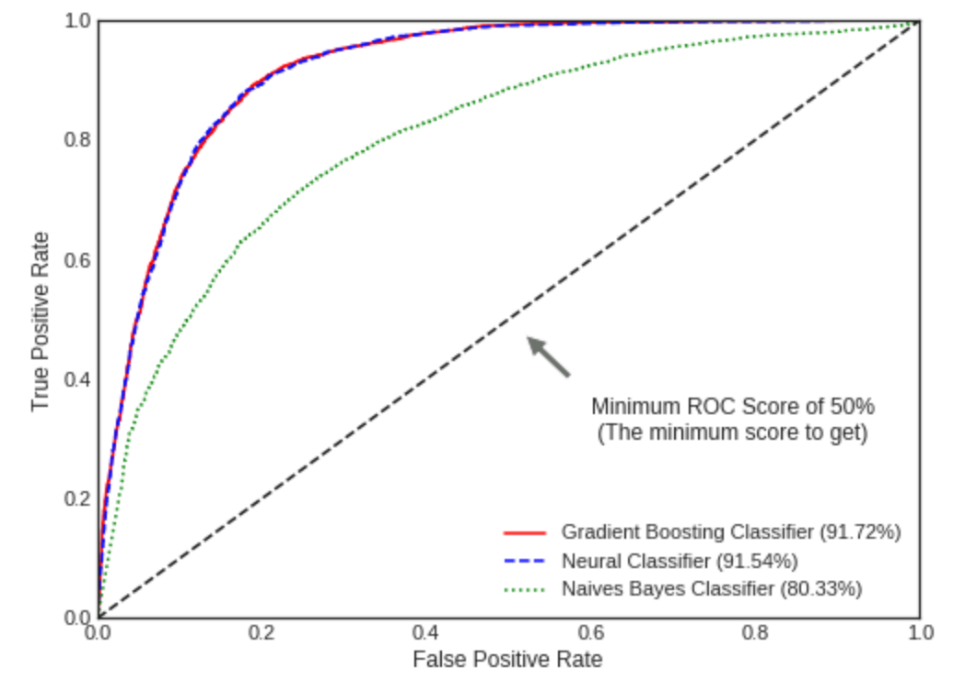
Figure 4: The ROC curve of the top 3 classifiers.
5. Features Impacting Term Deposit Subscriptions
First, a Decision Tree classifier is utilized to identify the most influential features for classification. This is accomplished by generating new train and test splits with an 80:20 ratio, followed by a visualization of the feature importance. The top three significant features that emerge are: (1) 'Duration', representing the length of the conversation between the sales agent and potential client, (2) 'Contact', indicating the number of touches with the potential client during the same marketing campaign, and (3) 'Housing', signifying whether the client has a housing loan. Notably, a 46% difference is observed between 'duration' and 'contacts'.
Next, the accuracy scores of various classifiers - including Gradient Boosting, Multi-Layer Perceptron, and Gaussian Naive Bayes - are assessed. A voting classifier is also employed to amalgamate the results from each base estimator. Table 5 presents the accuracy scores of each model. The Gradient Boosting classifier emerges as the most effective model for predicting potential client subscriptions to a term deposit, boasting an accuracy score of 0.846.
Table 5: The accuracy score of each classifier.
Classifiers | Scores |
Gradient Boosting | 0.846 |
VotingC | 0.821 |
Muti-layer Perceptron | 0.779 |
Gaussian Naive Bayes | 0.751 |
6. Recommendations
Utilizing the marketing mix, a collection of controllable tools, can significantly enhance a firm’s competitive position by catering specific market demands [10]. The research findings, in conjunction with conventional marketing tenets such as the Four Ps (Product, Price, Place, Promotion), suggest several strategies to enhance the effectiveness of the bank's future telemarketing campaigns. The recommendations will focus on understanding the customer better in terms of account balance and age demographics (Product and Price), managing contact frequency (Promotion), and optimizing marketing activity timing (Place). By intertwining empirical data insights with time-honored marketing principles, innovative strategies can be devised to optimize the effectiveness of future telemarketing campaigns.
In terms of product and price, it's evident that a client's account balance is a significant determinant in their likelihood to subscribe to term deposits. Clients with account balances exceeding $1,490 showed greater readiness to subscribe. It's recommended to devise specialized term deposit products tailored to these high-balance clients, offering competitive pricing that reflects their financial standing.
Age also plays a vital role in influencing campaign outcomes. As demonstrated, the highest potential is observed in customers aged below 30 and above 50. Future campaigns can benefit from tailored product offerings and pricing structures that cater specifically to these demographics, effectively serving their unique needs and expectations.
The research underlines the importance of managing customer contact frequency. With data showing that limiting customer contact to four instances during a campaign yields better results, the bank should consider implementing this as a threshold in its promotion strategy. Striking a balance between engaging customers and avoiding over-contact is crucial, as the latter can lead to customer fatigue and resistance.
Place also carries significant implications for campaign outcomes. The study found that while May had the highest marketing activity, it also recorded the lowest effectiveness rate. In contrast, the months of March, September, October, and December demonstrated better results. These months, which coincide with the fall and winter seasons, should thus be prioritized in future promotional activities.
Furthermore, occupation emerged as an influential factor in the likelihood of term deposit subscriptions. Students and retirees were found to be most responsive to term deposits. It's recommended to introduce products that address the unique needs of these groups. For instance, term deposits offering flexible access could appeal to students, while retirees might prefer high-interest, secure options.
Finally, the study revealed a clear link between home loans, balances, and term deposit subscriptions. Potential clients with low or no balances, typically burdened with home loans, have less disposable income for term deposits. On the other hand, clients with average and high balances, usually without home loans, are more likely to open term deposits. Future campaigns can thus focus on individuals with average and high balances. Additionally, introducing tailored pricing strategies could incentivize higher balance clients to subscribe and enable lower balance clients to start small and grow their investments over time.
In conclusion, these data-driven recommendations grounded in the Four Ps framework provide a strategic roadmap for the bank to optimize its future telemarketing campaigns, fostering better customer engagement and improving term deposit subscription rates. These strategies should be employed judiciously, striking a balance between pursuing new opportunities and maintaining robust relationships with existing customers.
7. Conclusion
The goal of this project is to evaluate and enhance the efficiency of a bank's marketing campaign, providing insights that can inform improvements in future campaigns. A thorough analysis of actual bank client data was conducted, using an array of machine learning techniques and exploring data from varied angles. We commenced by investigating the raw data to comprehend its basic characteristics and structures. Subsequent Exploratory Data Analysis (EDA) facilitated a deeper exploration of the numerical and categorical columns' attributes. Data visualization techniques were employed to examine factor distributions and relationships using a correlation matrix, providing an in-depth understanding of the data. The dataset was partitioned into training and testing sets, and the performance of various classification models including Decision Tree, Random Forest, and Logistic Regression, among others, was compared. Cross-validation was employed as a safeguard against overfitting. We further constructed a confusion matrix, analyzing its derivatives like precision, recall, ROC curve, and ROC-AUC scores, demonstrating overall strong model performance. Of all models tested, Gradient Boosting outperformed the rest in terms of accuracy, establishing itself as the most potent predictor of potential client behavior. By considering critical factors such as seasonality, age, occupation, and financial background, banks can make informed decisions to target the most receptive potential clients, thus maximizing the effectiveness of their marketing strategies and enhancing overall profitability.
References
[1]. Moro, S., Cortez, P., Rita, P.: A data-driven approach to predict the success of bank telemarketing. Decision Support Systems 62, 22-31 (2014).
[2]. Mathematical Sciences 8(114), 5667-5672 (2014).
[3]. Kim, K. H., Lee, C. S., Jo, S. M., Cho, S. B.: Predicting the success of bank telemarketing using deep convolutional neural network. International Conference of Soft Computing and Pattern Recognition, 314-317 (2015).
[4]. Milo, T., Somech, A.: Automating exploratory data analysis via machine learning: An overview. In Proceedings of the 2020 ACM SIGMOD International Conference on Management of Data, 2617-2622 (2020).
[5]. Parsons, V. L.: Stratified sampling. Wiley StatsRef: Statistics Reference Online 1-11 (2014).
[6]. Arlot, S., Celisse, A.: A survey of cross-validation procedures for model selection (2010).
[7]. Caelen, O.: A Bayesian interpretation of the confusion matrix. Annals of Mathematics and Artificial Intelligence 81(3-4), 429-450 (2017).
[8]. Powers, D. M.: Evaluation: from precision, recall and F-measure to ROC, informedness, markedness and correlation. arXiv preprint arXiv:2010.16061 (2020).
[9]. Davis, J., Goadrich, M.: The relationship between Precision-Recall and ROC curves. In Proceedings of the 23rd international conference on Machine learning, 233-240 (2006).
[10]. Khan, M. T.: The concept of ‘marketing mix’ and its elements. International journal of information, business and management 6(2), 95-107 (2014).
Cite this article
Guan,Y. (2023). Machine Learning Insights: Identifying Factors for Successful Bank Telemarketing Campaigns. Advances in Economics, Management and Political Sciences,43,40-50.
Data availability
The datasets used and/or analyzed during the current study will be available from the authors upon reasonable request.
Disclaimer/Publisher's Note
The statements, opinions and data contained in all publications are solely those of the individual author(s) and contributor(s) and not of EWA Publishing and/or the editor(s). EWA Publishing and/or the editor(s) disclaim responsibility for any injury to people or property resulting from any ideas, methods, instructions or products referred to in the content.
About volume
Volume title: Proceedings of the 7th International Conference on Economic Management and Green Development
© 2024 by the author(s). Licensee EWA Publishing, Oxford, UK. This article is an open access article distributed under the terms and
conditions of the Creative Commons Attribution (CC BY) license. Authors who
publish this series agree to the following terms:
1. Authors retain copyright and grant the series right of first publication with the work simultaneously licensed under a Creative Commons
Attribution License that allows others to share the work with an acknowledgment of the work's authorship and initial publication in this
series.
2. Authors are able to enter into separate, additional contractual arrangements for the non-exclusive distribution of the series's published
version of the work (e.g., post it to an institutional repository or publish it in a book), with an acknowledgment of its initial
publication in this series.
3. Authors are permitted and encouraged to post their work online (e.g., in institutional repositories or on their website) prior to and
during the submission process, as it can lead to productive exchanges, as well as earlier and greater citation of published work (See
Open access policy for details).
References
[1]. Moro, S., Cortez, P., Rita, P.: A data-driven approach to predict the success of bank telemarketing. Decision Support Systems 62, 22-31 (2014).
[2]. Mathematical Sciences 8(114), 5667-5672 (2014).
[3]. Kim, K. H., Lee, C. S., Jo, S. M., Cho, S. B.: Predicting the success of bank telemarketing using deep convolutional neural network. International Conference of Soft Computing and Pattern Recognition, 314-317 (2015).
[4]. Milo, T., Somech, A.: Automating exploratory data analysis via machine learning: An overview. In Proceedings of the 2020 ACM SIGMOD International Conference on Management of Data, 2617-2622 (2020).
[5]. Parsons, V. L.: Stratified sampling. Wiley StatsRef: Statistics Reference Online 1-11 (2014).
[6]. Arlot, S., Celisse, A.: A survey of cross-validation procedures for model selection (2010).
[7]. Caelen, O.: A Bayesian interpretation of the confusion matrix. Annals of Mathematics and Artificial Intelligence 81(3-4), 429-450 (2017).
[8]. Powers, D. M.: Evaluation: from precision, recall and F-measure to ROC, informedness, markedness and correlation. arXiv preprint arXiv:2010.16061 (2020).
[9]. Davis, J., Goadrich, M.: The relationship between Precision-Recall and ROC curves. In Proceedings of the 23rd international conference on Machine learning, 233-240 (2006).
[10]. Khan, M. T.: The concept of ‘marketing mix’ and its elements. International journal of information, business and management 6(2), 95-107 (2014).