


1. Introduction
The securities market in China has witnessed over three decades of growth and development since the inception of the Shanghai and Shenzhen Stock Exchanges. Among them, China’s A-share market has made significant progress in many aspects in the past ten years. First of all, the scale of the A-share market has expanded considerably and the trend is going on. According to a statistics report of the Shanghai Stock Exchange, the total market value has exceeded US $10 trillion, making the A-share market become one of the world's largest stock markets [1]. In the future, the expanding market demand will promote the market further. Secondly, the market investment methods are growing diversified. The investment portfolio containing derivatives has developed varied forms. Driven by market demand, securities investment has developed many different combinations applying various financial instruments [2]. Thirdly, the construction of the regulatory system has gradually improved, including the listing system, information disclosure system, trading system, and so on. As for the current deficiencies, relevant laws and regulations will be further improved in the future [3]. Fourthly, the level of internationalization is constantly improving. More and more foreign investors enter the Chinese market. At the same time, China will also strengthen its connection with the international market to gradually realize the internationalization of the A-share market [4]. With the ongoing transformation and upgrading of China's economic structure, the impetus of scientific and technological innovation has gained prominence as a vital catalyst for advancing market development. For example, big data, with its satisfying commercial insights, is widely used by commercial organizations and brings innovation to various industries [5].
With Eviews, SPSS, and other statistical analysis software being more and more widely used, an increasing number of researchers have conducted empirical research on the investment value of stocks. At present, the main methods used in the research of stock investment value are Analytic Hierarchy Process, Logic Regression Model, Factor Analysis, and Cluster Analysis. For example, Wu applied Analytic Hierarchy Process (AHP) to study the entire stock behavior as a whole and quantified various influencing factors of stock value to help investors choose the right investment method [6]. Liu used the Principal Component Analysis (PCA) to rank the competitiveness and influence of companies [7].
Factor Analysis is a statistical technique used for examining interdependencies among multiple variables, enabling scientific exploration of their underlying relationships. It facilitates the synthesis of numerous variables with intricate connections into a smaller set of comprehensive factors [8]. Factor Analysis has significant advantages in multivariate analysis. First of all, it enables the recognition of relationships among variables, thereby unveiling the latent factor structures that lie beneath, thereby enhancing researchers' comprehension of the data, and exposing concealed factors and interconnections. Secondly, Factor Analysis possesses the ability to condense the dimensionality of multiple variables into a smaller number of factors, resulting in streamlined and comprehensible data that is more manageable and amenable to analysis. The method reduces the complexity of calculation and processing, and improves efficiency. Therefore, Factor Analysis has been widely used in medicine, finance, economy, biology, education, and other fields. It provides a scientific and effective analysis method in research with complex, correlated factors to deal with.
Clustering is the process of grouping data members that are similar in some way. K-means clustering aims to divide a dataset into 𝐾 distinct, non-overlapping clusters, where 𝐾 is specified in advance. 𝐾-means will assign each observation precisely to one of the 𝐾 clusters. K-means clustering has become one of the most widely used clustering algorithms because of its simplicity and efficiency.
Cloud computing was first proposed in the 1960s by Turing Prize winner John McCarthy, who was known as the "father of artificial intelligence". Since China entered the new era, the digital economy has become an indispensable guiding force for people's daily life. The data from China Academy of Information and Communications Technology (CAICT) show that the scale of the cloud computing industry is increasing year by year. Gartner and other related research institutions predicted that it will continue to grow at a high annual growth rate [9]. Since 2019, the cloud computing industry’s leading stocks have been performing well. The total financial institutional position and allocation significantly increased. Cloud computing-related concept stocks are widely concerned by investors. It shows that the cloud computing industry is getting more and more attention from the capital market. Therefore, this study initially employs factor analysis to diminish the variable dimensionality, followed by the utilization of K-means clustering to categorize stocks within the cloud computing sector.
2. Methodology
2.1. Data Source Description
As the objection of this paper is to classify the stocks of cloud computing sector, the author randomly selected 47 stocks from 210 stocks in the cloud computing sector and downloaded the basic information of these stocks from the database, as well as some indicators of the balance sheet and profit statement. All data in this paper are from RESSET database.
2.2. Indicator Selection and Description
The investment philosophy of the securities market can be roughly divided into four categories: the absolute value school which takes the fundamentals as the analysis tool; the relative value investors looking for arbitrage opportunities; the index investors invest based on random walk theory and market efficiency theory and the technology investors follows the Dow theory [10]. The indicators used by investors are mainly divided into two categories, namely technical analysis indicators and fundamental indicators. Among them, technical analysis indicators are models of market indicators fitted through long-term observation of market behavior. Thus, the indicators selected in this paper are divided into two categories: market indicators and fundamental indicators.
Market indicators include the highest price, lowest price, amplitude, average price, and other indicators that reflect the stock trading situation. The company's fundamental indicators include return on total assets, return on equity, current ratio, asset-liability ratio, etc.
For market indicators, this paper selects the daily index from January 1, 2023 to March 31, 2023. Due to the time lag of the release of fundamental indicators and small fluctuations in a short period of time, it is considered that the data released on March 31, 2023 is the daily value from January to March. The market indicators are shown in Table 1. Fundamental indicators are shown in Table 2.
Table 1: Market indicators table.
Index | Variable name | Description |
Amplitude(%) | Dampltd | (Day high - Day low) *100/ Closing price |
Transaction amount | Trdsum | The number of transactions in a day |
Transaction volume | Trdvol | The number of shares traded in a given trading day |
Daily turnover rate of outstanding shares | DTrdTurnR | The turnover rate of outstanding shares in a certain day |
Highest price | Hipr | The highest transaction price of the stock on the specified trading day |
Lowest price | Lopr | The minimum transaction price of the stock on the specified trading day |
Opening price | Oppr | The opening price of a stock on a specified trading day shall be calculated and announced by the exchange |
Closing price | Clpr | The closing price of the stock on the designated trading day shall be calculated and announced by the exchange |
Average price | Avpr | Turnover for the day/Turnover for the day |
Table 2:Fundamental indicators table.
Index | Variable name | Description |
Return on total assets | ToassRR | Pre-tax profit/Average total assets *100% |
Gross profit margin on sales | Ngpft | (Main business income - main business cost)/Net main business income * 100% |
Net profit margin on sales | Nspft | Net profit/net income from main business *100% |
Liquidity ratio | Liqr | Current assets/current liabilities * 100% |
Table 2:(continued).
Quick ratio | Quir | (Current assets - survival)/current liabilities |
The ratio of asset and liability | Assliar | Total liabilities/total assets * 100% |
Total assets growth rate | Toassgr | (Total assets for the current period - Total assets for the same time scale as last year)/Total assets for the same time as last year * 100% |
Net assets growth rate | Neassgr | (Net assets of the current time frame - net assets of the same time scale as last year)/Total assets of the same time frame at last year * 100 |
2.3. Method Introduction
Due to the high correlation between variables, it is not conducive to direct cluster analysis. Thus, the factor analysis method is first used to reduce the dimension of variables. Factor analyses utilize the Common Factor Model, as depicted in Figure 1, as their foundation. This model posits that each observed response (from  to
to  ) is influenced both by latent common factors (Factor 1 to Factor n) and unique underlying factors (F1 through F5). The analysis involves investigating the interrelationships (correlations or covariances) among the observed variables. Highly correlated (correlation coefficient close to one) measurements may be affected by the same factors, while relatively uncorrelated measurements may be affected by different factors.
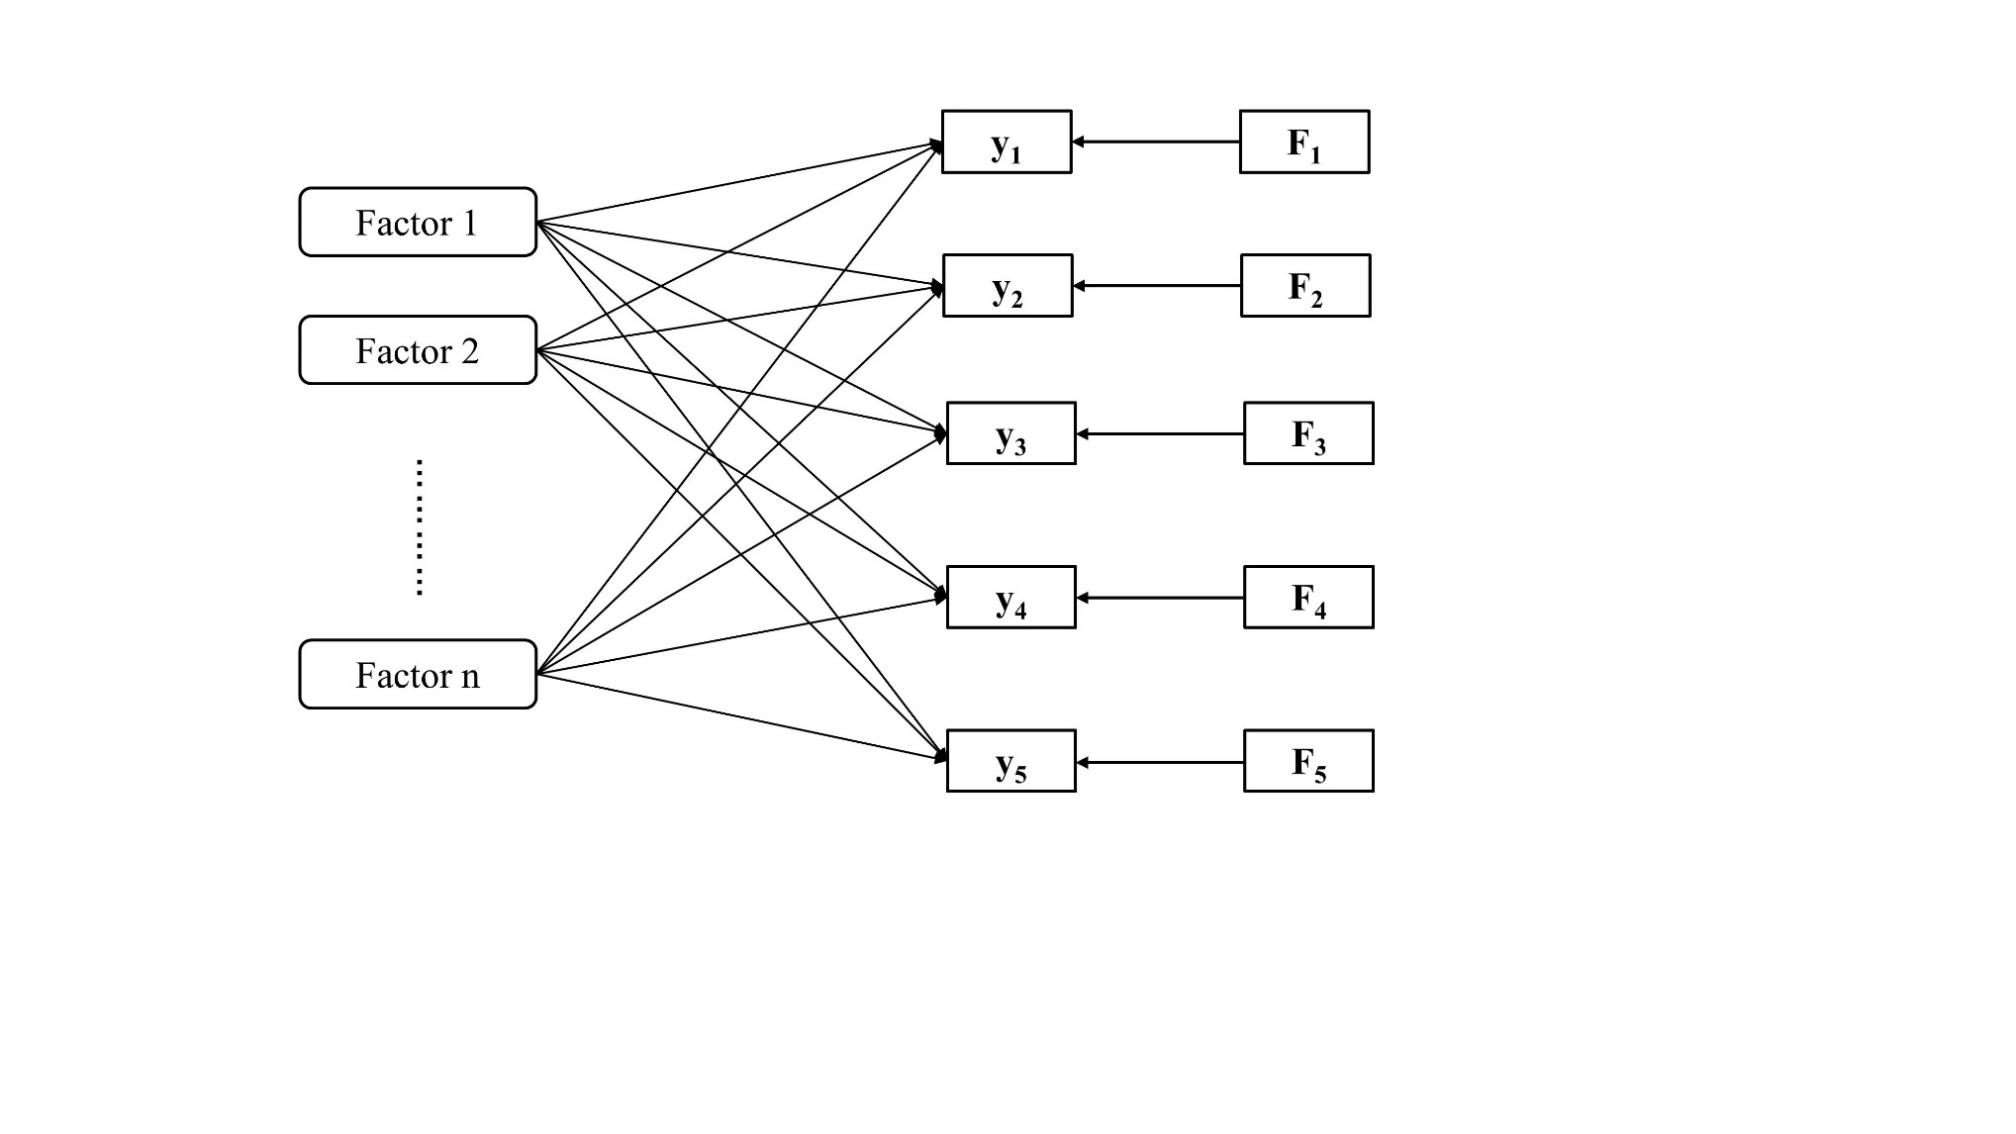
Figure 1: The common factor model.
K-means clustering first set the goal of dividing the data into K clusters and divides each point into the closest cluster by calculating the distance from each point to K centers. After each point classification is complete, the center of each cluster is calculated again, and the process is repeated until a certain condition is reached. The process of K-means clustering is shown in Figure 2.
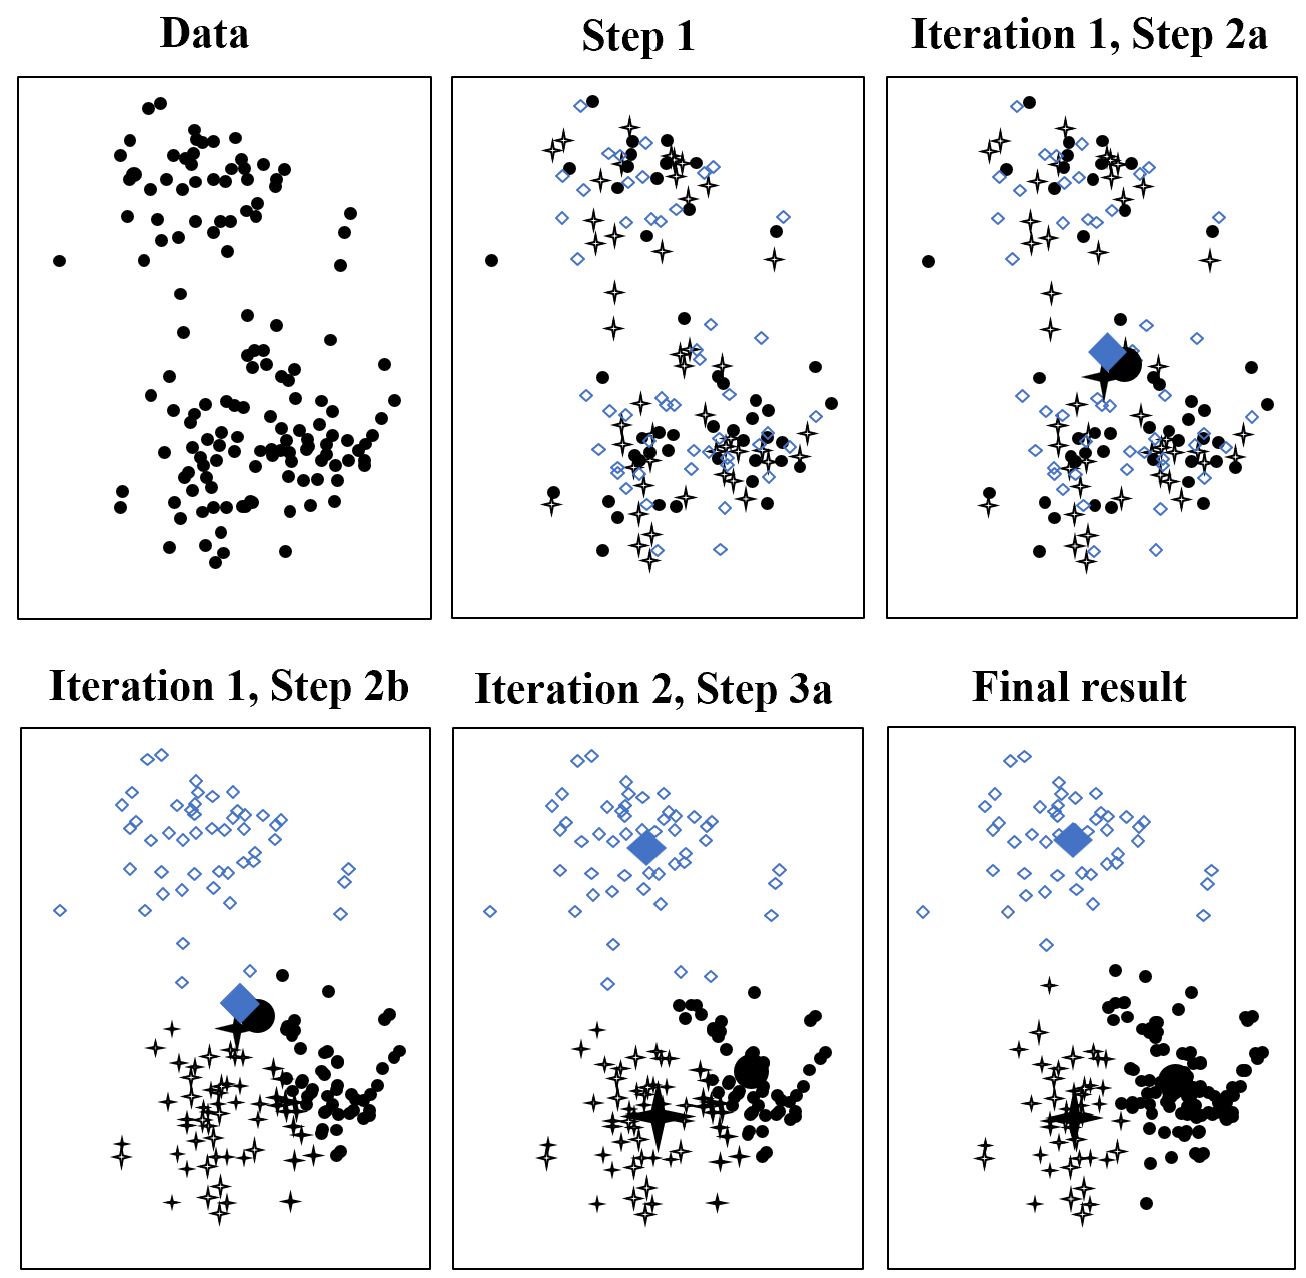
Figure 2:The process of K-means.
For the selection of K, the Elbow Method is used. The central concept underlying this approach is as follows: as the number of clusters, denoted by k, increases, the sample partition becomes more intricate, resulting in a progressive intensification of cluster consolidation. Consequently, the sum of squares (SSE) gradually diminishes. Moreover, when k falls below the optimal cluster count, SSE experiences a substantial reduction due to the substantial augmentation of cluster consolidation resulting from an increase in k. Upon reaching the optimal cluster number, further increments in k result in a rapid decline in the level of consolidation achieved and lead to a significant decrease in SSE. Ultimately, as the value of k continues to rise, the sum of squares error (SSE) reaches a plateau. In other words, the association between SSE and k takes on the form of an elbow, where the k value corresponding to this bend signifies the optimal number of clusters for the given dataset, as Figure 3 shows.
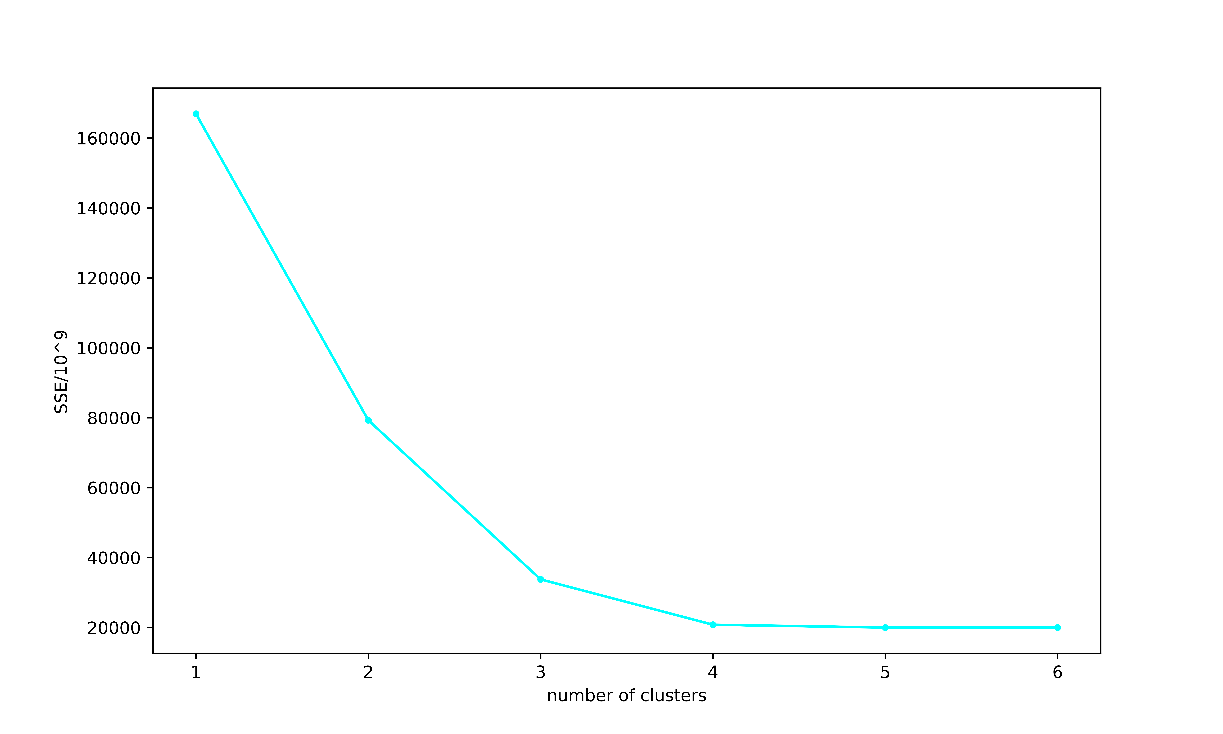
Figure 3: An example of elbow plot.
3. Results And Discussion
3.1. Factor Analysis
First, the correlations heatmap of variables are drawn, and the results are shown in Figure 4. It can be seen that there is a high correlation between variables.
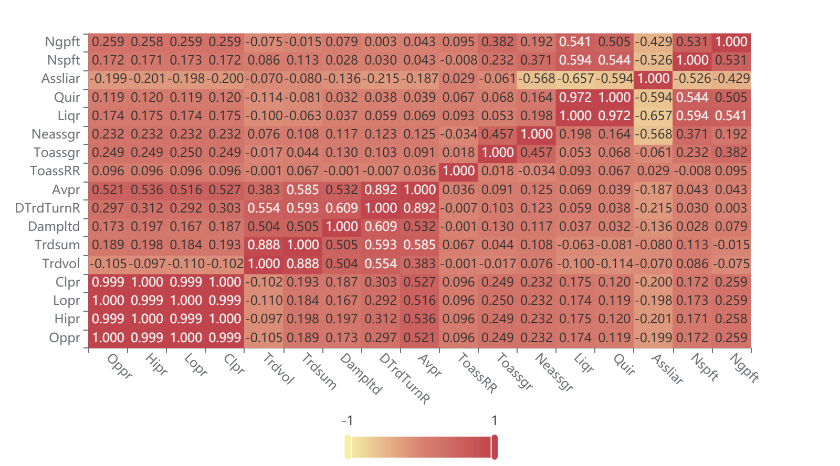
Figure 4:Correlations heatmap.
Next, Bartlett tested and KMO test are done to determine whether it was suitable for factor analysis. The results are shown in Table 3. First the p-value of Barelett's test is lower than 0.001, which indicates factor analysis can be applied to this dataset. Then the result of KMO test is 0.674, indicating that there is a certain correlation between the variables, which is well-suited for conducting factor analysis and extracting shared factors.
Table 3:Kaiser-Meyer-Olkin and Bartlett’s test.
KMO Measure of Sampling Adequacy. | 0.674 |
Bartlett's Test of Sphericity | 9653 |
Approx. Chi-Square | 7.821 |
Degree of freedom | 136 |
Sig. | 0.000 |
Use principal component analysis to determine the optimal number of factors and draw the scree plot. It depicts the eigenvalues on the vertical axis, while the number of common factors is represented on the horizontal axis. The number of factors whose eigenvalue is greater than 1 is determined to be the best number of factors. As in Figure 5, there are five factors.
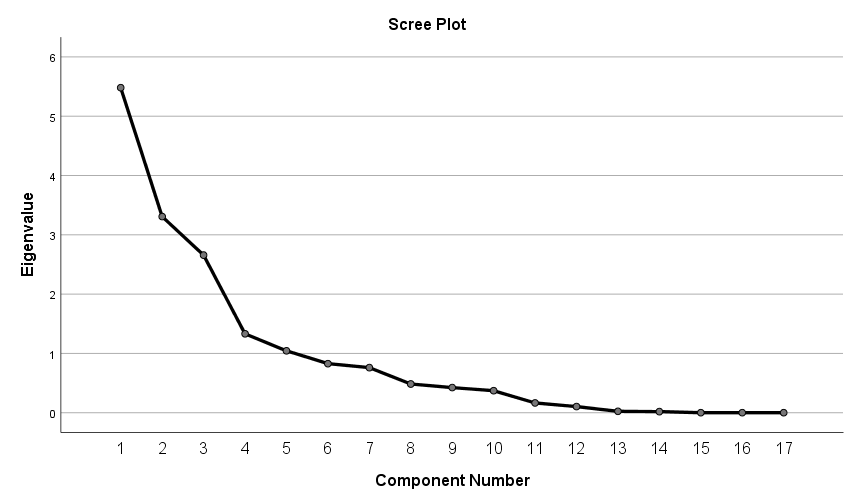
Figure 5:Scree plot.
In addition, Table 4 shows that when five factors are extracted, the cumulative factor loadings reach 81.294, indicating that the selection of silver quantity is reasonable.
Table 4:Extraction sums of squared loadings.
Total | % of Variance | Cumulative % |
5.480 | 32.238 | 32.238 |
3.307 | 19.456 | 51.693 |
2.658 | 15.633 | 67.327 |
1.331 | 7.828 | 75.155 |
1.044 | 6.139 | 81.294 |
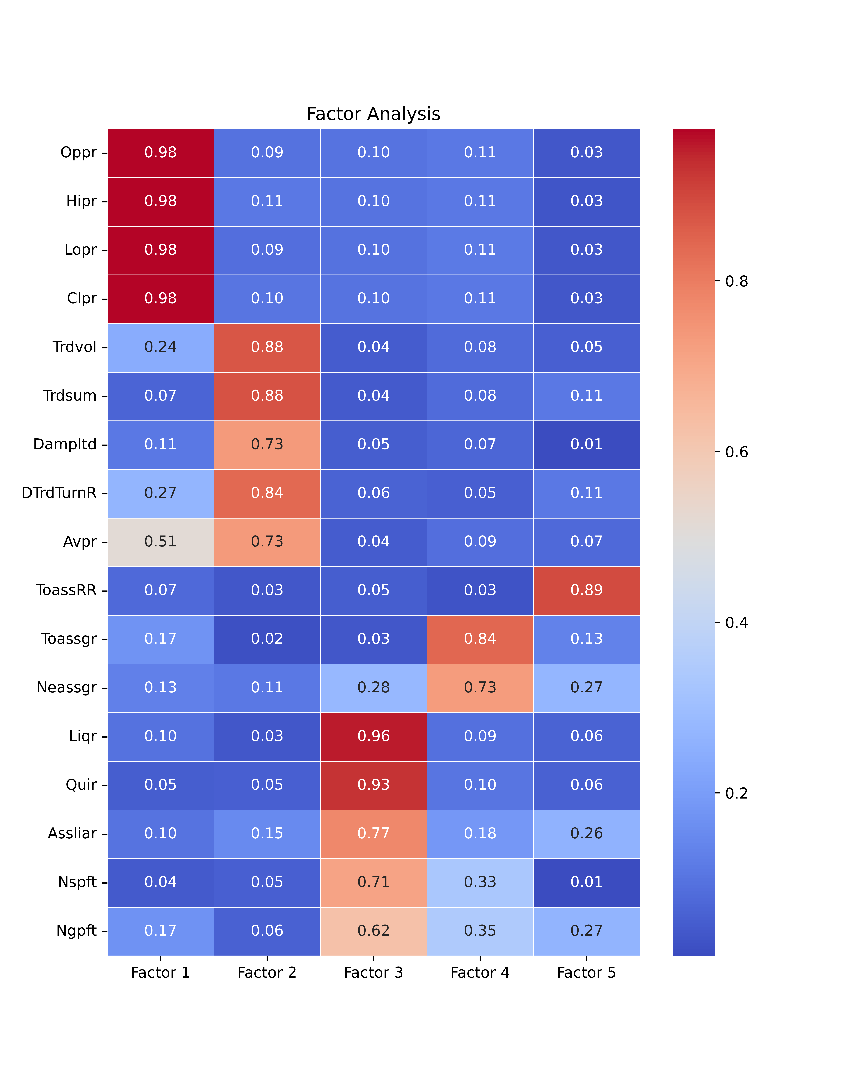
Figure 6:The orthogonal rotation heat map.
The next step is to rotate the factor loadings matrix by the orthogonal rotation method and draw the heat map 10 by taking the absolute value, as Figure 6 shows. Through analysis, each factor is summarized and named as follows.
Factor 1 has a higher loading on the average price, the highest price, the lowest price, the opening price, the closing price, and other price variables. All of them are positive. From the definition of these variables, it can be inferred that factor 1 can reflect the performance of the stock in terms of price. Therefore, this paper names it the Price Factor.
Factor 2 has a higher loading on transaction amount, transaction volume, and amplitude. Both the transaction amount and volume positively reflect the performance of the stock on the transaction. The amplitude also has a certain correlation with the transaction performance. Thus, factor 2 is named the Trading Factor.
Factor 3 has a high loading on the current ratio, quick ratio, and asset-liability ratio. While the current ratio and speed ratio serve as indicators of the company's short-term solvency, the asset-liability ratio provides insights into the company's long-term solvency. Therefore, it is named as Debt Service Factor.
Factor 4 carries a higher loading on the growth rate of total assets and the growth rate of net assets. Both of the two variables positively reflect the company's performance on growth. Hence, this paper names it as Growth Factor.
Factor 5 has a higher loading on the total assets return rate, net asset return rate and return rate on net sales rate. The total and net assets return rate reflect the company's profit on assets positively. The return rate on net sales rate positively reflects the company's profit on sales. Therefore, it is named as the Profit Factor.
3.2. K-Means Clustering
To reduce the weight differences in different dimensions as well as improve the accuracy, all variables are standardized before cluster analysis. The measure is the sum of squares (SSE) of Euclidean distance between each point and cluster centroids, where smaller values are better. Figure 7 is obtained by the Elbow Method. As can be seen from the figure, before k=2, the SSE plunge as k increases. While after k=2, with the increase of k, SSE decreases abruptly until it becomes stable. Therefore, this paper divides the selected stocks into two categories.
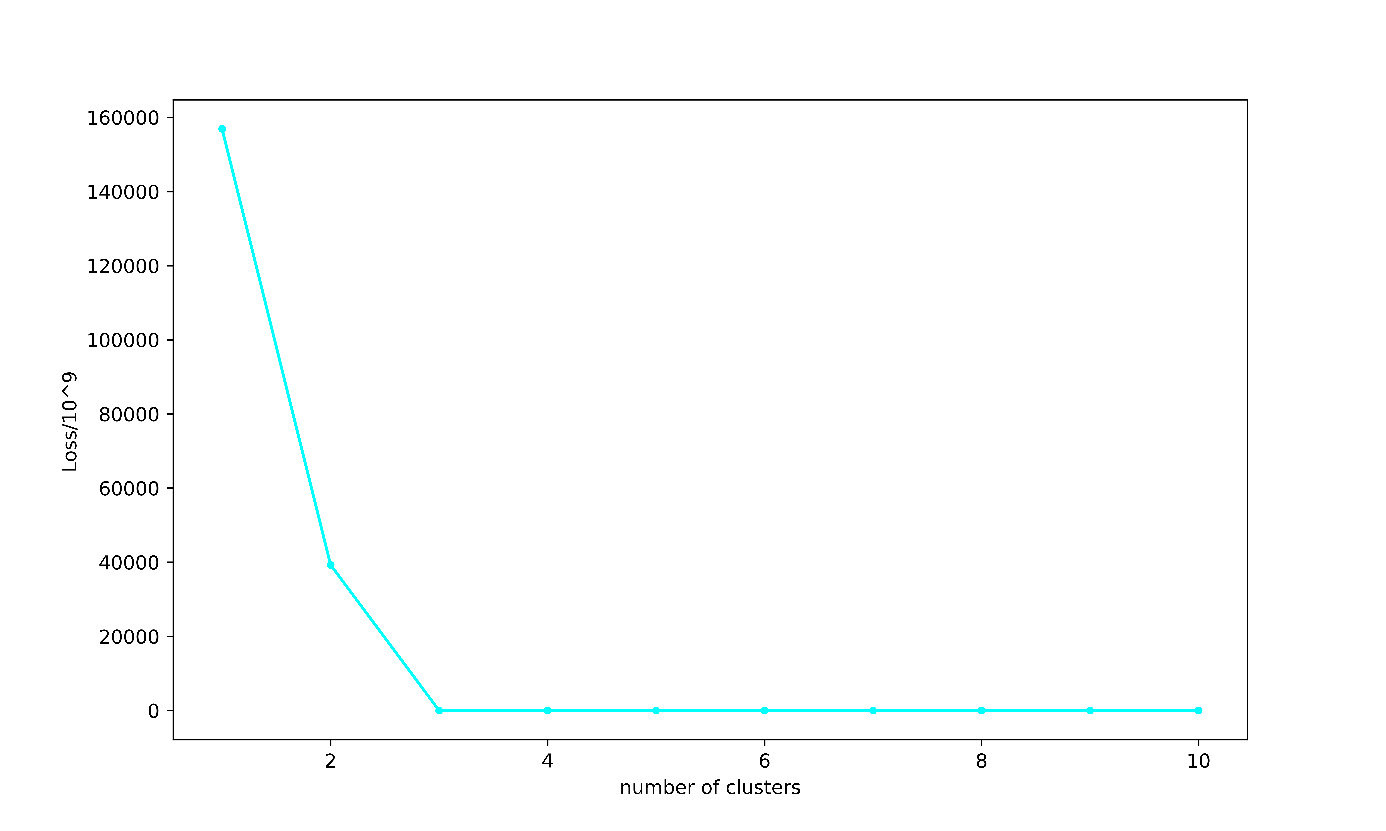
Figure 7:Elbow plot generated by the five common factors.
4. Conclusion
Through analysis, this paper divides the selected cloud computing stocks into two categories: mature stocks and common stocks. The scores of price factor and growth factor of mature stocks are low, but the scores of debt factor and trading factor are high. The overall growth is relatively gentle, the operation is relatively stable and prudent, but the debt repayment risk is low. It is also for this reason that these stocks are easier for stable investors to choose. The second category is common stock, accounting for a relatively high proportion, close to 70%. This is consistent with the fact that most investors encounter mediocre stocks. The indicators of this type of stock are more average, and the indicators are also near the average. In addition, the factor extraction results of this paper are similar to the analysis of the overall capital market in the literature, indicating that the characteristics of the cloud computing sector are consistent with the overall market.
This paper analyzes and classifies the selected stocks successfully. However, because the authors only randomly selected 47 of the 210 cloud computing stocks, the results may have some bias. For example, some very special stocks that can be classified by themselves are not selected, which results in only two categories of K-means classification. If people select more stocks, they can get more detailed information and better categories, such as potential stocks. In the future, more stocks can be selected for analysis, which may result in a clearer classification.
Overall, this research provides valuable insights into the China A-share market, factor analysis, and K-means clustering techniques. The findings contribute to the system of knowledge in investment research and reveal the cloud computing sector's performance and potential opportunities for investors.
References
[1]. Cong L Shanghai 2022 social responsibility report. Shanghai securities journal (002).
[2]. Xiaoyu Z 2018 Our country securities market present situation analysis and regulation research. China Report, 972 (17).
[3]. Siqi Y, Qiaoqi W 2019 Research on the development Status and trend of China's securities Market under the new economic situation. Modern Marketing (Management Edition) (03) 172.
[4]. Tao L 2019 Our country securities market internationalization analysis. Journal of cooperation in economy and technology 605 (6) 58-59.
[5]. Transportation. Big Data & Smart City (ICITBS) 309-312.
[6]. Jiachao W 2014 Application of Analytic Hierarchy Process in Stock investment value evaluation. Administrative Assets and Finance 36-38.
[7]. Qiang L 2011 Research on Competitiveness of Listed securities companies based on Principal Component Analysis. Journal of Economic Research, 28 74-76.
[8]. Xia Y, Yayun W 2015 Analysis of stock investment value of China's listed commercial banks based on factor analysis. Special Zone Economy, (12) 67-69.
[9]. Heng W 2021 Cloud computing based on intellectual capital enterprise value evaluation research. China mining university.
[10]. Peng S 2014 Validity test of Securities Investment trend Index. Western Finance, 9 33-37
Cite this article
Li,Y. (2023). Classification of Cloud Computing Sector Stocks Based on Factor Analysis. Advances in Economics, Management and Political Sciences,43,79-88.
Data availability
The datasets used and/or analyzed during the current study will be available from the authors upon reasonable request.
Disclaimer/Publisher's Note
The statements, opinions and data contained in all publications are solely those of the individual author(s) and contributor(s) and not of EWA Publishing and/or the editor(s). EWA Publishing and/or the editor(s) disclaim responsibility for any injury to people or property resulting from any ideas, methods, instructions or products referred to in the content.
About volume
Volume title: Proceedings of the 7th International Conference on Economic Management and Green Development
© 2024 by the author(s). Licensee EWA Publishing, Oxford, UK. This article is an open access article distributed under the terms and
conditions of the Creative Commons Attribution (CC BY) license. Authors who
publish this series agree to the following terms:
1. Authors retain copyright and grant the series right of first publication with the work simultaneously licensed under a Creative Commons
Attribution License that allows others to share the work with an acknowledgment of the work's authorship and initial publication in this
series.
2. Authors are able to enter into separate, additional contractual arrangements for the non-exclusive distribution of the series's published
version of the work (e.g., post it to an institutional repository or publish it in a book), with an acknowledgment of its initial
publication in this series.
3. Authors are permitted and encouraged to post their work online (e.g., in institutional repositories or on their website) prior to and
during the submission process, as it can lead to productive exchanges, as well as earlier and greater citation of published work (See
Open access policy for details).
References
[1]. Cong L Shanghai 2022 social responsibility report. Shanghai securities journal (002).
[2]. Xiaoyu Z 2018 Our country securities market present situation analysis and regulation research. China Report, 972 (17).
[3]. Siqi Y, Qiaoqi W 2019 Research on the development Status and trend of China's securities Market under the new economic situation. Modern Marketing (Management Edition) (03) 172.
[4]. Tao L 2019 Our country securities market internationalization analysis. Journal of cooperation in economy and technology 605 (6) 58-59.
[5]. Transportation. Big Data & Smart City (ICITBS) 309-312.
[6]. Jiachao W 2014 Application of Analytic Hierarchy Process in Stock investment value evaluation. Administrative Assets and Finance 36-38.
[7]. Qiang L 2011 Research on Competitiveness of Listed securities companies based on Principal Component Analysis. Journal of Economic Research, 28 74-76.
[8]. Xia Y, Yayun W 2015 Analysis of stock investment value of China's listed commercial banks based on factor analysis. Special Zone Economy, (12) 67-69.
[9]. Heng W 2021 Cloud computing based on intellectual capital enterprise value evaluation research. China mining university.
[10]. Peng S 2014 Validity test of Securities Investment trend Index. Western Finance, 9 33-37