


1. Introduction
As an inalienable part of the financial system, the stock market has an important and active influence on the macroeconomy and residents' life and well-being. Stock investors all hope to gain more benefits by analyzing stock market index movements. In the era of big data, news articles are an essential channel for people to obtain information and affect the stock market trend. Therefore, as a primary sources of stock market information, daily news is deffusely valued and analyzed by financers [1]. However, predicting the change in the trend of stock is difficult to operate due to the sharp fluctuation and high noise in the financial market, which is non-linear, unstable and complex [2]. Unexpected information could significantly impact stock market, and machine learning models that can make precise predictions from text messages will be a helpful decision-making tool. Machine-learning models give predictions that can help investors filter out the noise and make smarter decisions. Our research helps solve this problem by implementing the Logistic Regression and Long Short-Term Memory models, widely used in text categorization problems. Our research helps solve this problem.
In this article, the headlines of world news published by mainstream media globally would be merged with Dow Jones Industrial Average. The combined dataset has to be in the form of digital data; only in this way can existing applications process it [3]. For Logistic Regression, the whole process includes four attempts with different parameters. By setting the word count and word frequency interval, the original intention of this approach is to seek the most suitable treatment which outputs the highest accuracy. Similarly, the LSTM model has two attempts but only varies from one parameter controlling the limit of time of training circulation. The target of this research is to compare the test accuracy of these two models and find a way to dispose of the literal dataset together with a numeral dataset. With the prediction accuracy of test sets, LSTM shows superior fitting performance than Logistic Regression on this dataset. For future studies, the researchers could make more attempts on LSTM parameters to modify the model and thus achieve a higher test index.
The remainder of this paper is organized as follows. In Section 2, the article describes the source of datasets and how the combined data is processed into measures used for model training and analysis. In the following, Section 3 builds the machine learning models. Then Section 4 presents and discusses the output of the test index and emphasizes their significance and validation on the mutual effects between news and the stock market. Eventually, the article concludes by summarizing the experiment and describing the reference and contributions to future research.
2. Dataset
2.1. News Data
Daily news headlines are downloaded from Kaggle ‘News Headline & Summary from select 12 sources’ (https://www.kaggle.com/datasets/adammcmurchie/news-headlines-summary-from-select-12-sources), which is pulled by API calls service, continuously running daily and appending local data. All news titles are collected from authoritative media globally, BBC News, CNN, Fox News, Reuters, The Huffington Post, etc. The time range of news is from January 1, 2020, to November 22, 2021. For various numbers of titles attached to each date (max: 561 min: 22), the counts of columns should be equal. Therefore, the news data finally contains 20 columns of daily news headlines randomly selected from the original file and attached to the date.
2.2. Stock Data
The stock data, Dow Jones Industrial Average (DJIA), is directedly collected from Yahoo Finance (http://finance.yahoo.com) and has an identical time range with the news headlines (from 2020-01-01 to 2021-11-22). As Figure 1 shows, the stock index of DJIA includes trading data (‘date’), closing level (‘close’), open level (‘open’), the highest point (‘high’) and the lowest point (‘low’). The difference is the value of ‘close’ minus ‘open’.
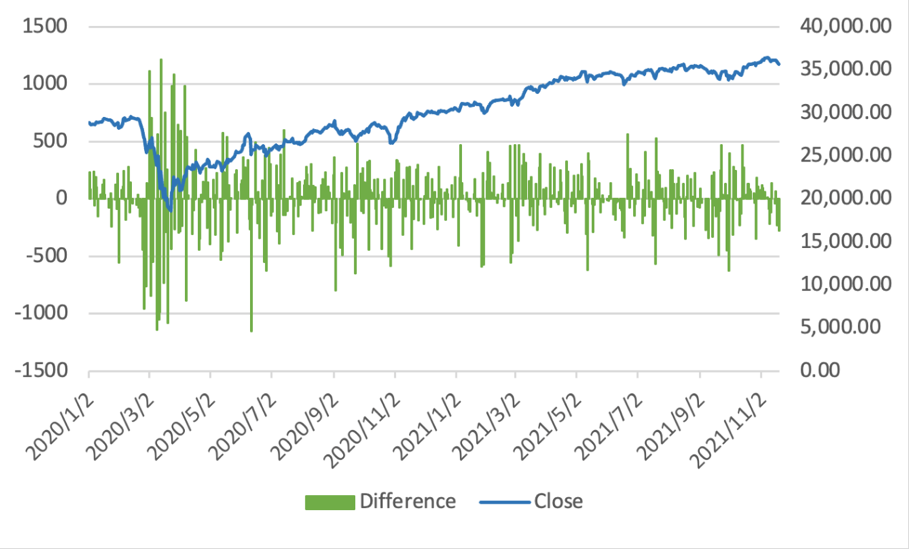
Figure 1: The closing price and difference between closing and opening price of dow jones industrial average.
2.3. Combined Data
The two datasets should be concatenated into a combined dataset for model training. Because both news and stock data are time series in the “Date” column, merging them by importing the Concat function is operable. Meanwhile, omit the rows that contain null values (both datasets are not consecutive). As mentioned, the machine learning models aim at a binary classification task. Hence, there are only two labels. The column “Label” is the binary expression of the difference between the closing and opening price of DJIA, where “1” represents DJIA Adjusted value increased or stayed the same and “0” represents DJIA Adjusted value reduced. For further import and evaluation, the combined dataset splits into a training set and a test set at a proportion of eight to two. The training set is from 2020-01-02 to 2021-07-20, and the test set is from 2021-07-21 to 2021-11-22.
3. Methodology
3.1. Logistic Regression
The first method uses Logistic Regression model to construct, which is widely used in big data and economics, and belongs to a kind of generalized linear regression. The Logistic regression model produces the predicted value in the range of 1 and 0, which is mainly used to solve the binary classification problem. Set the independent variable \( Y \) as a binary variable. The values \( Y=0 \) and \( Y=1 \) ,respectively indicate that the DJIA Adjusted value decreased and increased or stayed the same. The independent variables \( n \) that affect the value of Y are \( {X_{1}}, {X_{2}}, ⋯, {X_{n}} \) , and conditional probability under the action of the independent variable \( n \) is \( P=P(Y=1|{X_{1}}, {X_{2}}, ⋯, {X_{n}}) \) . Thus, the Logistic Regression model [4]:
\( {z_{i}}={a_{0}}+{a_{1}}{X_{i1}}+{a_{2}}{X_{i2}}+⋯+{a_{n}}{X_{in}} \) (1)
\( {P_{i}}=\frac{1}{1+exp(-{z_{i}})} \) (2)
In the formulas above, \( i \) is the date and \( i=1, 2, ⋯, n \) , and \( j \) is the serial number of dates \( i \) ( \( j=1, 2, ⋯, n \) ). The intermediate variable parameter represents as \( {z_{i}} \) with a constant \( {a_{0}} \) on the right-hand side. The regression coefficient of the number \( j \) variable is \( {a_{i}} \) . \( {P_{i}} \) is the probability of regression prediction at date \( i \) .
3.2. Long Short-Term Memory (LSTM)
In 1995, Juergen Schmidhuber and Sepp Hochreiter proposed a modified Recurrent Neural Network (RNN) (Figure 2) [5] model that aimed at solving the long-standing difficulties, gradient explosion and disappearance, and named it as Long Short-Term Memory model [6-7]. LSTM model can carry more valuable information and more accurate results in longer sequences, compare with the RNN model. Because of this, LSTM may be a form of RNN model which is modified to learn long-run dependencies. Figure 3 illustrates a single layer of the LSTM model that activates the tangent \( tan{h} \) hyperbolic:
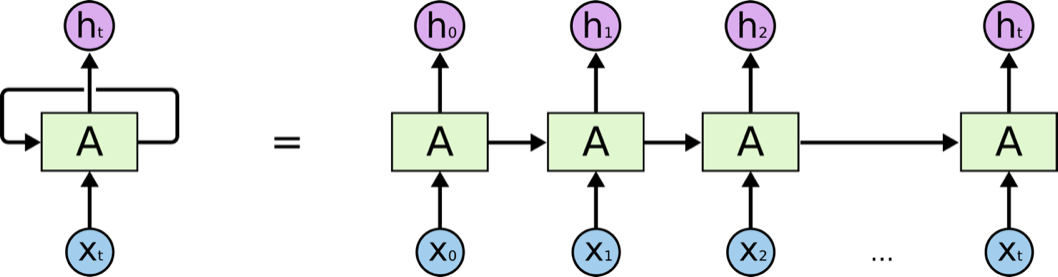
Figure 2: A single layer of RNN model (https://resources.experfy.com/ai-ml/an-introduction-to-recurrent-neural-networks/).
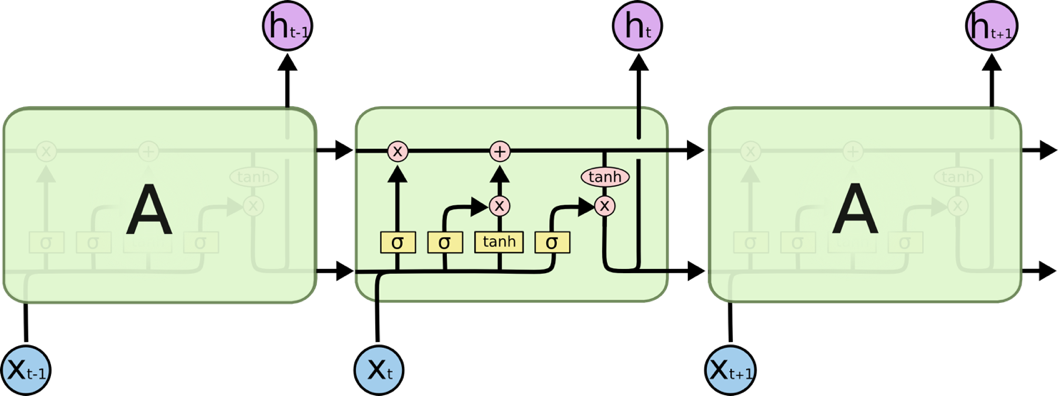
Figure 3: A LSTM module (https://blog.csdn.net/lgzlgz3102/article/details/126552738).
The variables in Figure 3 are shown in the following:
\( {f_{t}}=σ({W_{f}}∙[{h_{t-1}},{x_{t}}]+{b_{f}}) \) (3)
\( {i_{t}}=σ({W_{i}}∙[[{h_{t-1}},{x_{t}}]+{b_{i}}) \) (4)
\( {\widetilde{C}_{t}}=tan{h}({W_{c}}∙[[{h_{t-1}},{x_{t}}]+{b_{c}}) \) (5)
\( {\widetilde{C}_{t}}={f_{t}}*{C_{t-1}}+{i_{t}}*{\widetilde{C}_{t}} \) (6)
\( {o_{t}}=σ({W_{o}}∙[[{h_{t-1}},{x_{t}}]+{b_{o}}) \) (7)
\( {h_{t}}={o_{t}}*tan{h}({C_{t}}) \) (8)
In these formulas, \( {h_{t}} \) represents the output of the LSTM neutral network at time \( t \) . \( {f_{t}} \) , \( {i_{t}} \) , and \( {o_{t}} \) are the variable of forgot gate, input gate and output gate, respectively. Here \( {\widetilde{C}_{t}} \) shows the content stored in the memory unit at time \( t \) . The sigmoid function \( σ \) is imported to treat the input values, which will be discussed in detail in the following. \( {W_{i}} \) is the input weight [8].
4. Results
The model implementation in this article is based on Python 3 powered by Jupyter Notebook, Anaconda. Libraries include Numpy, Pandas, Matplotlib, Sklearn, Keras, Tensorflow, etc.
4.1. Logistic Regression
4.1.1. Build Logistic Regression Model
In this part, four attempts with different parameters of the Logistic Regression model would be built to get the eigenvectors out from the training set headlines and then return the coefficients of words or phrases in descending order towards the stock index 0 and 1. Then evaluate the models with the test set and output the test accurately.
The four attempts and their parameters are shown in Table 1:
Table 1: Parameters of logistic regression.
Attempt | Parameter | Setting |
1 | ngram_range | (1,1) |
max_features | default | |
min_df | default | |
max_df | default | |
2 | ngram_range | (2,2) |
max_features | 20000 | |
min_df | 0.03 | |
max_df | 0.97 | |
3 | ngram_range | (3,3) |
max_features | 20000 | |
min_df | 0.0039 | |
max_df | 0.1 | |
4 | ngram_range | (4,4) |
max_features | 100000 | |
min_df | 0.0039 | |
max_df | 0.1 |
The parameter ngram_range states the word count of output. Except for the first approach, the words which are too familiar, like “a”, “an”, and “the” and the words whose counts are too small, would be evaded. To build models that are more reasonable and efficient, these can be achieved by several parameters: the value of max_feature determines the number of words/phrases that the model takes into consideration and sorts them in descending order. The min_df and max_df are implemented to limit the frequency of phrases lying in a specific interval ( \( min\_df≤frequency \lt max\_df \) ).
4.1.2. Output Results
The extracted words and phrases and their coefficients of each attempt are demonstrated in Table 2. And Table 3 shows the fitting accuracy of four Logistic Regression model with different parameters:
Table 2: Words/Phrases with coefficients.
Attempt | Word/Phrase | Coefficient |
1 | death | 0.5982 |
charge | 0.5057 | |
pandemic | 0.4117 | |
time | 0.3886 | |
leads | 0.3827 | |
2 | floyd death | 1.1560 |
fox news | 0.9470 | |
south africa | 0.9457 | |
covid 19 | 0.8355 | |
super bowl | 0.8049 | |
3 | george floyd death | 0.7127 |
for covid 19 | 0.6480 | |
miami building collapse | 0.5422 | |
alexandria ocasio cortez | 0.4676 | |
hurt in shooting | 0.3982 | |
4 | negative for covid 19 | 0.0887 |
impeachment trial cnn video | 0.0856 | |
the story of the | 0.0715 | |
aung san suu kyi | 0.0710 | |
trump covid 19 diagnoses | 0.0709 |
Table 3: Words/Phrases and their coefficients.
Attempt | Name | Accuracy |
1 | single words | 0.42 |
2 | two-word phrases | 0.51 |
3 | three-word phrases | 0.58 |
4 | four-word phrases | 0.49 |
4.1.3. Model Analysis
Among all these four attempts, the count of phrases with three related words has the highest test accuracy. From the perspective of word frequency, it is necessary to set the parameters to form a limited interval, avoiding some general words such as conjunctions or articles. This experiment's most appropriate frequency interval is 0.39% to 10%.
Referring to the words and their coefficients towards the labels, the three-word phrase method still excels, revealing much information. Take the single word "death" as an example; the amount of the linked messages with "death" are extraordinarily multidirectional, or in other words, not accurate enough. For instance, the subject of death, the way of death etc., are all unknown. This makes the single word count method inconvincible when fitting the stock price movement. However, as the word count increases to two or three, the information given by the titles becomes more specific. "George Floyd death" is far more concrete and meaningful for the prediction model than "death", which increases test accuracy.
Besides, "Covid 19" and some other keywords about the pandemic appear in all four attempts. According to this, the validity between the dataset and the Logistic Regression model has been verified to be correct and sufficient. Because the time range of the dataset is based on the global pandemic, Covid 19, there should be a vast amount of news focusing on this topic.
4.2. LSTM
4.2.1. Build LSTM Neutral Network
i.The parameters of Embedding Layer are shown in Table 4.
Table 4: Embedding parameters [12].
Parameters | Description | Setting |
input_dim | Dimension of the input vectors | len (index_dict) + 1 |
output_dim | Dimension of the output vectors | 100 |
weights | The original value of Embedding | [embedding_weights] |
maxlen | The length of input headlines | 200 |
max_feature | The number of words as features | 10000 |
In Table 4, the index begins from 0 subscripts, so the setting of input_dim needs to be plus 1. For the training set in this article is relatively small, the dimension value is set as 100 to avoid overfitting, and thus improve the performance of this model. As the LSTM model disposes of the sequences resembling string length or a specific interval [9], after importing the maxlen parameter, it truncates the title with a maximum word count of 200. The effect of max_feature parameter excludes the words or phrases that rarely appear (only the top 10,000 most common words in the dataset are considered).
ii.The parameters of LSTM Layer are shown in Table 5.
Table 5: LSTM layer parameters.
Parameters | Description | Setting |
unit | Dimension of the output space | 50 |
activation | Activating function | sigmoid |
dropout | Regularization method | 0.5 |
In Table 5, the forget gate, input gate and output gate use ‘sigmoid’ as the activation function, determining the dimension of the output interval in each calculation process. Setting the dropout regularization method at 0.5 can remit the problem of overfitting by randomly omitting partially hidden state [10].
iii.The parameters of Dense Layer are shown in Table 6.
Table 6: Dense parameters.
Parameters | Description | Setting |
unit1 | The size of dimension of output | 128 |
activision1 | Activation function | softmax |
dropout | Regularization method | 0.5 |
unit2 | The size of dimension of output | 50 |
activation2 | Activation function | sigmoid |
In Table 6, importing the 'softmax' function to calculate the output at step \( t \) and the regularization method 'dropout' can further improve the model's performance in eliminating gradient disappearance and gradient explosion. The 'sigmoid' activation function in the Dense layer would compress the output in the interval of 0 to 1. The second unit equals 1, deciding that there is one cell after an output process; the return 1 represents DJIA Adj increased or stayed as the same; the return 0 represents DJIA Adj reduced.
4.2.2. Model Training
Firstly, employ the “model compile” function to compile the model; use ‘Adam’ optimizer [11] gathering with counterpropagating arithmetic to represent the use of momentum and adaptive learning rate to accelerate the convergence rate; consider the metrics ‘accuracy’ as the evaluation index.
Then train the model with the “model fit” function. There is only one sample (391 training samples in total) in a single batch when gradient descent. For the epoch parameter, in this article, two different attempts (epoch = 3 & epoch = 10) are made to heighten the accuracy. Their results of the value of loss and accuracy are shown in Figure 2-3:
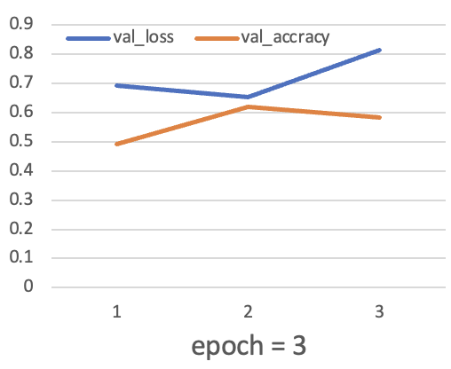
Figure 4: Three times of training circulation.
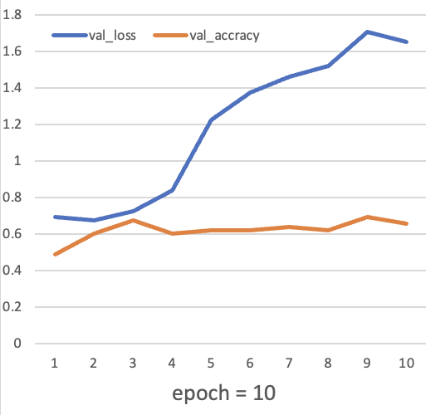
Figure 5: Ten times of training circulation.
After fitting the model, use the "model evaluate" function to output both attempts' test scores and test accuracy. When epoch = 3, the test score is 0.8130, and the test accuracy is 0.58. When epoch = 10, the test score is 1.6504, and the test accuracy is 0.65. Once the model has been tested using test sets, it is feasible to start making formal predictions with the "model prediction" function.
5. Conclusion
This research found that the test accuracy of both models implemented is higher than 50%, which verifies their feasible performance. After determining the word frequency of three-word phrases, the Logistic Regression model is 58% accurate with the test set of DJIA adjusted. Furthermore, LSTM, setting the epoch at 10, can reach a 0.65 accuracy. Accordingly, the LSTM model may be more suitable for this combined task with a literal and numerical dataset, especially for the news dataset used in this article.
The limitation of this experiment is that when selecting the stock index, the datasets only consider the difference between the closing and opening prices of DJIA. The ‘high’, ‘low’ and other stock indexed is excluded from this study to avoid model instability and overfitting. Another inadequacy is that the daily news dataset from Kaggle contains only two-year news titles, which is partly not enough to eliminate the contingency of literal data.
Based on the model result, further studies focusing on using news for stock prediction can utilize the idea of frequency interval and word count for getting a clean and valuable test dataset. In the future, researchers can further refine the operation of the above-related variables or even combine two machine learning models to complete the different parts of a single task. Besides, a more complex model containing various kinds of stock indexes and learning from a vast dataset would make the prediction work far more meaningful, which is a direction worthy of further study.
References
[1]. Li, X., Xie, H., Chen, L. et al.: News impact on stock price return via sentiment analysis. Knowledge-Based Systems 69, 14–23 (2014). doi: 10.1016/j.knosys.2014.04.022.
[2]. Paiva, F.D., Cardoso, R., Haonaoka, G.: Decision-making for financial trading: A fusion approach of machine learning and portfolio selection. Expert Systems with Applications 115, 635–655 (2019). doi: 10.1016/j.eswa.2018.08.003.
[3]. Schumaker, R.P. Chen, H.: A quantitative stock prediction system based on financial news. Information Processing & Management 45, 571–583 (2019). doi:10.1016/j.ipm.2009.05.001.
[4]. Liu, Y., Yin, K., Liu, B.: Application of Logistic Regression and Artificial Neural network model to spatial prediction of landslide disaster. Hydrogeology and Engineering Geology 37, 92–96 (2010). doi: 10.3969/j.issn.1000-3665.2010.05.017.
[5]. Huang, C., Cheng, X.: Research on stock price prediction based on LSTM Neural Network. Journal of Information Science and Technology University of Beijing (Natural Science) 36(1), 79–83 (2021). Available at: https://d-wanfangdata-com-cn.ez.xjtlu.edu.cn/periodical/ChlQZXJpb2RpY2FsQ0hJTmV3UzIwMjMwMzIxEhNiamp4Z3l4eXhiMjAyMTAxMDE1GghpcjZ5eGd1eQ%3D%3D.
[6]. Greff, K., Srivastava, R., Koutník, J., et al.: LSTM: A search space odyssey. IEEE Transactions on Neural Networks and Learning Systems 28(10), 2222–2232 (2017). doi: 10.1109/tnnls.2016.2582924.
[7]. Gers, F.A.: Learning to forget: Continual prediction with LSTM. 9th International Conference on Artificial Neural Networks: ICANN, 99 [Preprint], (1999). doi: 10.1049/cp:19991218.
[8]. Ma, Y., Du, X., Sun, X.: Adaptive modification of turbofan engine nonlinear model based on LSTM neural networks and hybrid optimization method. Chinese Journal of Aeronautics 35(9), 314–332 (2022). doi: 10.1016/j.cja.2021.11.005.
[9]. Chai, Y.: Research on sentiment analysis of book review text based on LSTM and Word2vec. Information Technology 7, 59–64 (2022). doi: 10.13274/j.cnki.hdzj.2022.07.011.
[10]. Li, J., Sun, L., Li, J.: Research on sentiment analysis of comment text based on LSTM. Microcomputer Application 36(5), 1–4 (2020). doi: 10.3969/j.issn.1007-757X.2020.05.002.
[11]. Liu, L., Liu, X., Wang, H.: Coal mine fire prediction based on LSTM neural network. Journal of Heilongjiang University of Science and Technology 33(1), 1–5 (2023). doi: 10.3969/j.issn.2095-7262.2023.01.001.
Cite this article
Liu,Z. (2023). Stock Price Prediction Based on Daily News Headlines: Logistic Regression Model and LSTM Model. Advances in Economics, Management and Political Sciences,45,121-129.
Data availability
The datasets used and/or analyzed during the current study will be available from the authors upon reasonable request.
Disclaimer/Publisher's Note
The statements, opinions and data contained in all publications are solely those of the individual author(s) and contributor(s) and not of EWA Publishing and/or the editor(s). EWA Publishing and/or the editor(s) disclaim responsibility for any injury to people or property resulting from any ideas, methods, instructions or products referred to in the content.
About volume
Volume title: Proceedings of the 2nd International Conference on Financial Technology and Business Analysis
© 2024 by the author(s). Licensee EWA Publishing, Oxford, UK. This article is an open access article distributed under the terms and
conditions of the Creative Commons Attribution (CC BY) license. Authors who
publish this series agree to the following terms:
1. Authors retain copyright and grant the series right of first publication with the work simultaneously licensed under a Creative Commons
Attribution License that allows others to share the work with an acknowledgment of the work's authorship and initial publication in this
series.
2. Authors are able to enter into separate, additional contractual arrangements for the non-exclusive distribution of the series's published
version of the work (e.g., post it to an institutional repository or publish it in a book), with an acknowledgment of its initial
publication in this series.
3. Authors are permitted and encouraged to post their work online (e.g., in institutional repositories or on their website) prior to and
during the submission process, as it can lead to productive exchanges, as well as earlier and greater citation of published work (See
Open access policy for details).
References
[1]. Li, X., Xie, H., Chen, L. et al.: News impact on stock price return via sentiment analysis. Knowledge-Based Systems 69, 14–23 (2014). doi: 10.1016/j.knosys.2014.04.022.
[2]. Paiva, F.D., Cardoso, R., Haonaoka, G.: Decision-making for financial trading: A fusion approach of machine learning and portfolio selection. Expert Systems with Applications 115, 635–655 (2019). doi: 10.1016/j.eswa.2018.08.003.
[3]. Schumaker, R.P. Chen, H.: A quantitative stock prediction system based on financial news. Information Processing & Management 45, 571–583 (2019). doi:10.1016/j.ipm.2009.05.001.
[4]. Liu, Y., Yin, K., Liu, B.: Application of Logistic Regression and Artificial Neural network model to spatial prediction of landslide disaster. Hydrogeology and Engineering Geology 37, 92–96 (2010). doi: 10.3969/j.issn.1000-3665.2010.05.017.
[5]. Huang, C., Cheng, X.: Research on stock price prediction based on LSTM Neural Network. Journal of Information Science and Technology University of Beijing (Natural Science) 36(1), 79–83 (2021). Available at: https://d-wanfangdata-com-cn.ez.xjtlu.edu.cn/periodical/ChlQZXJpb2RpY2FsQ0hJTmV3UzIwMjMwMzIxEhNiamp4Z3l4eXhiMjAyMTAxMDE1GghpcjZ5eGd1eQ%3D%3D.
[6]. Greff, K., Srivastava, R., Koutník, J., et al.: LSTM: A search space odyssey. IEEE Transactions on Neural Networks and Learning Systems 28(10), 2222–2232 (2017). doi: 10.1109/tnnls.2016.2582924.
[7]. Gers, F.A.: Learning to forget: Continual prediction with LSTM. 9th International Conference on Artificial Neural Networks: ICANN, 99 [Preprint], (1999). doi: 10.1049/cp:19991218.
[8]. Ma, Y., Du, X., Sun, X.: Adaptive modification of turbofan engine nonlinear model based on LSTM neural networks and hybrid optimization method. Chinese Journal of Aeronautics 35(9), 314–332 (2022). doi: 10.1016/j.cja.2021.11.005.
[9]. Chai, Y.: Research on sentiment analysis of book review text based on LSTM and Word2vec. Information Technology 7, 59–64 (2022). doi: 10.13274/j.cnki.hdzj.2022.07.011.
[10]. Li, J., Sun, L., Li, J.: Research on sentiment analysis of comment text based on LSTM. Microcomputer Application 36(5), 1–4 (2020). doi: 10.3969/j.issn.1007-757X.2020.05.002.
[11]. Liu, L., Liu, X., Wang, H.: Coal mine fire prediction based on LSTM neural network. Journal of Heilongjiang University of Science and Technology 33(1), 1–5 (2023). doi: 10.3969/j.issn.2095-7262.2023.01.001.